Part 1: The history of Klipfolio

Published 2012-02-16, updated 2023-02-01

Summary - In the first of a three part series, we join Allan, Peter, and James in 2001 as they found Serence Inc (changed to Klipfolio in 2008) and start work on Klipfolio Dashboard 1.0. Find out how it all began in this special blog post!
The story of Klipfolio begins in early 2001 when Allan Wille and Peter Matthews recognized an opportunity for simplifying how people accessed information on the web. As Peter told the Ottawa Business Journal in 2002, "I kept catching myself wasting time online, checking out a ton of different sites each time I browsed the web." Like Peter, they knew that people were constantly checking multiple websites to retrieve one or two tidbits of data. Immediately, they recognized the potential for a tool that could set up the automatic retrieval of that data and then consolidate that data onto a single view. Their goal from the outset was to dramatically simplify how people monitored the information that mattered to them.
Allan and Peter knew that before they could bring their idea to life, they needed to bring on a CTO who would share their vision. Enter James Scott, a hot-shot software developer based in Ottawa whose talent and energy would help guide the technical development of Klipfolio Dashboard. With James Scott on board, Serence Inc (later renamed Klipfolio) was officially founded on August 2, 2001. With the trio assembled, work began on getting what would become version 1 of Klipfolio Dashboard into the market.
That's not to say that everything went smoothly for the trio. In fact, they all had to tighten their belts quite a bit and endure the trials of being a small start-up with a big idea. Not only did each of the founders agree to pitch in some cash for start-up capital, but they also agreed to not to take salaries for the first few months. Peter Matthews, avowed car enthusiast, even had to sell his beloved ride to generate some extra capital. Despite the lean times ahead, the trio stuck to their guns and set up shop in Allan Wille's basement.
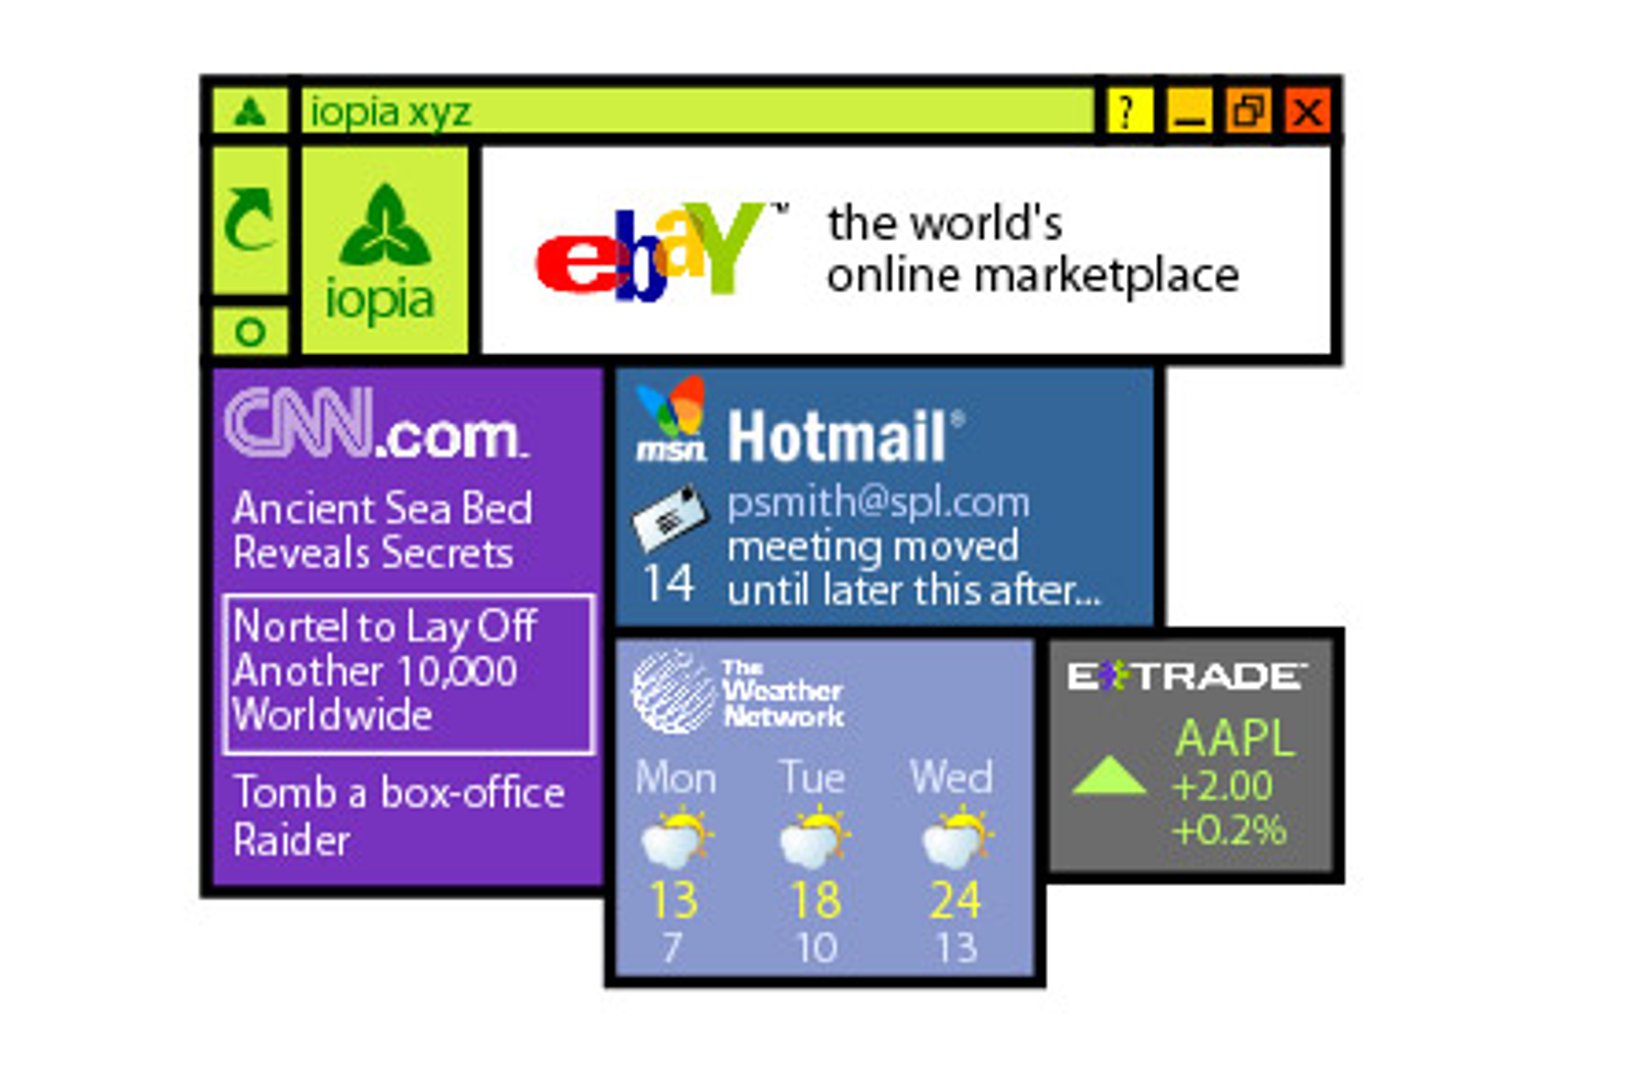
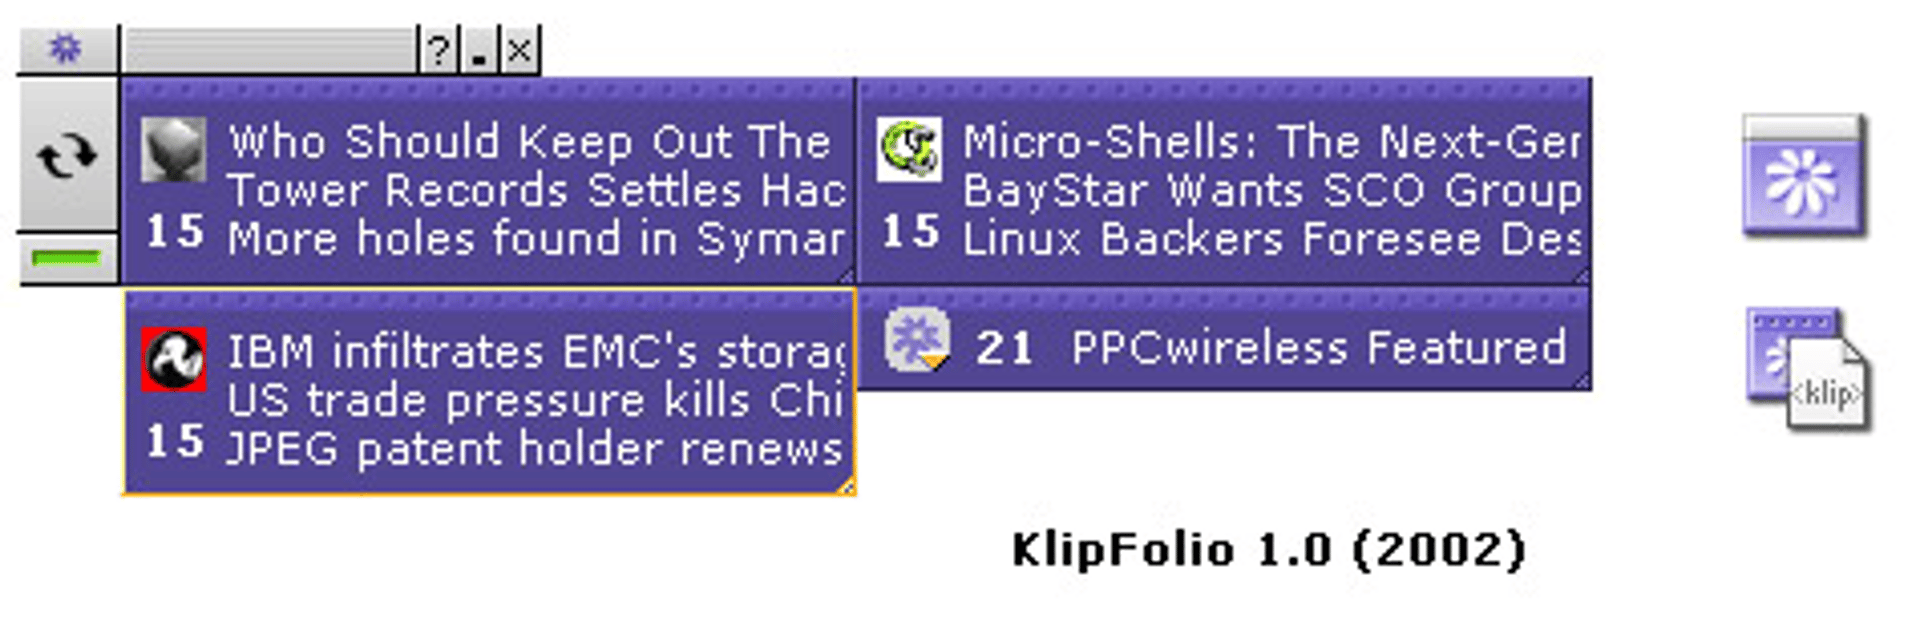
By December 2001, the trio started beta testing for version 1 and the initial response was already very positive. This early version of Klipfolio Dashboard leveraged RSS and XML to allow users to organize multiple data feeds to populate a dashboard. The lynch-pin of these dashboards was an individual reporting device called a Klip. Each Klip presented a single tidbit of data, such as an RSS feed, and could be organized together with other, unique Klips on your dashboard. This idea still serves as the foundation for Klipfolio Dashboard.
Klipfolio Dashboard version 1 was released to the public on April 8th, 2002. Publicizing the event across multiple news outlets across Canada, the US, and the UK, the founding trio nearly became victims of their own success. They had projected Klipfolio Dashboard would have 4,000 downloads in its first month: they hit this target in 4 days. By May 6th, version 1 had already attracted 13,500 downloads! Intuitively, this may seem like extraordinary news (and it was), but the team was also worried about maintaining a high-standard of service. They wanted to make sure they were engaging with their customers and maintaining a lively public forum. In the end, the team was able to deal with this challenge and the forums became a bee-hive of activity.
Throughout 2002 and into 2003, Klipfolio Dashboard continued to evolve. One major addition to the application was the inclusion of a JavaScript-based semantic markup language that created relationships among disparate bits of data. These relationships allowed developers, for the first time, to create and modify Klips according to their own tastes. Rather than offering a prepackaged data source and visualization (like a widget), Klipfolio Dashboard became a development platform that let users and developers control everything about their Klips.
The early years were defined by the success of their product and by the search for paying customers. At its peak, the consumer product was receiving over 1000 downloads a day, with a forum that was a hive of activity. This success was a bit misleading, since the product hadn't generated a significant paying customer - something by the end of 2002 that the trio desperately needed. Despite the value and volume of activity the product generated, the team was forced to tighten their belts and continue work on an unfunded Klipfolio Dashboard.
In part 2 of the history of Klipfolio, we will see that financial success eventually came when the team was approached by a Fortune 1000 company (read part 2 to find out who!) to build branded dashboards. That success, however, only served to whet the team's appetite as they contemplated a bigger, bolder move.
The Visual History of Klipfolio
Related Articles

The Power of Words
By Holly Ebbs — August 12th, 2020

Netguru streamlines company-wide KPI monitoring with Klipfolio
By Mitch Dupuis — July 17th, 2019

Creating a collaborative culture of innovation
By Daniel Bianchi — April 29th, 2019

Why I Broke My Golden Rule of Internships
By Melody Habbouche — April 18th, 2019