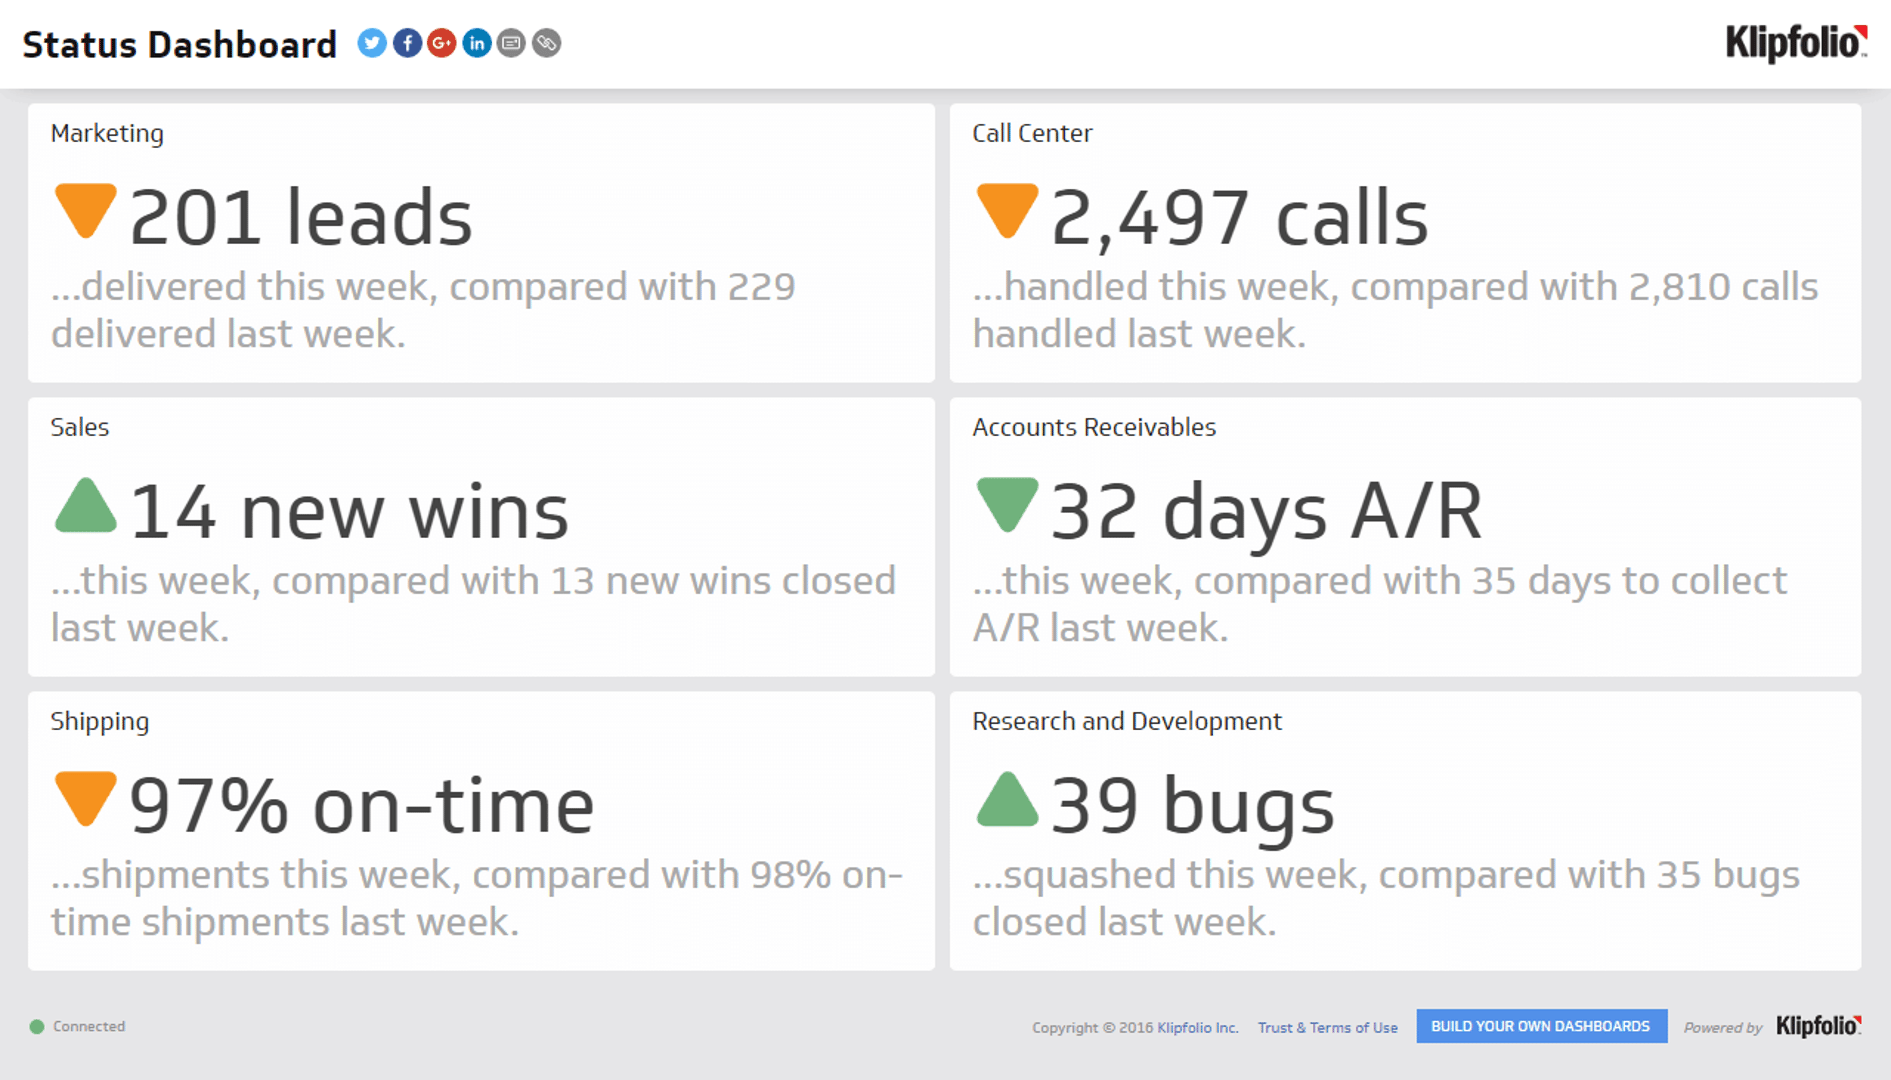
Status Dashboard
A high level overview of performance metrics for each department in an organization.
Track all your Status KPIs in one place
Sign up for a 14-day free trial and start making decisions for your business with confidence.
What is a Status Dashboard?
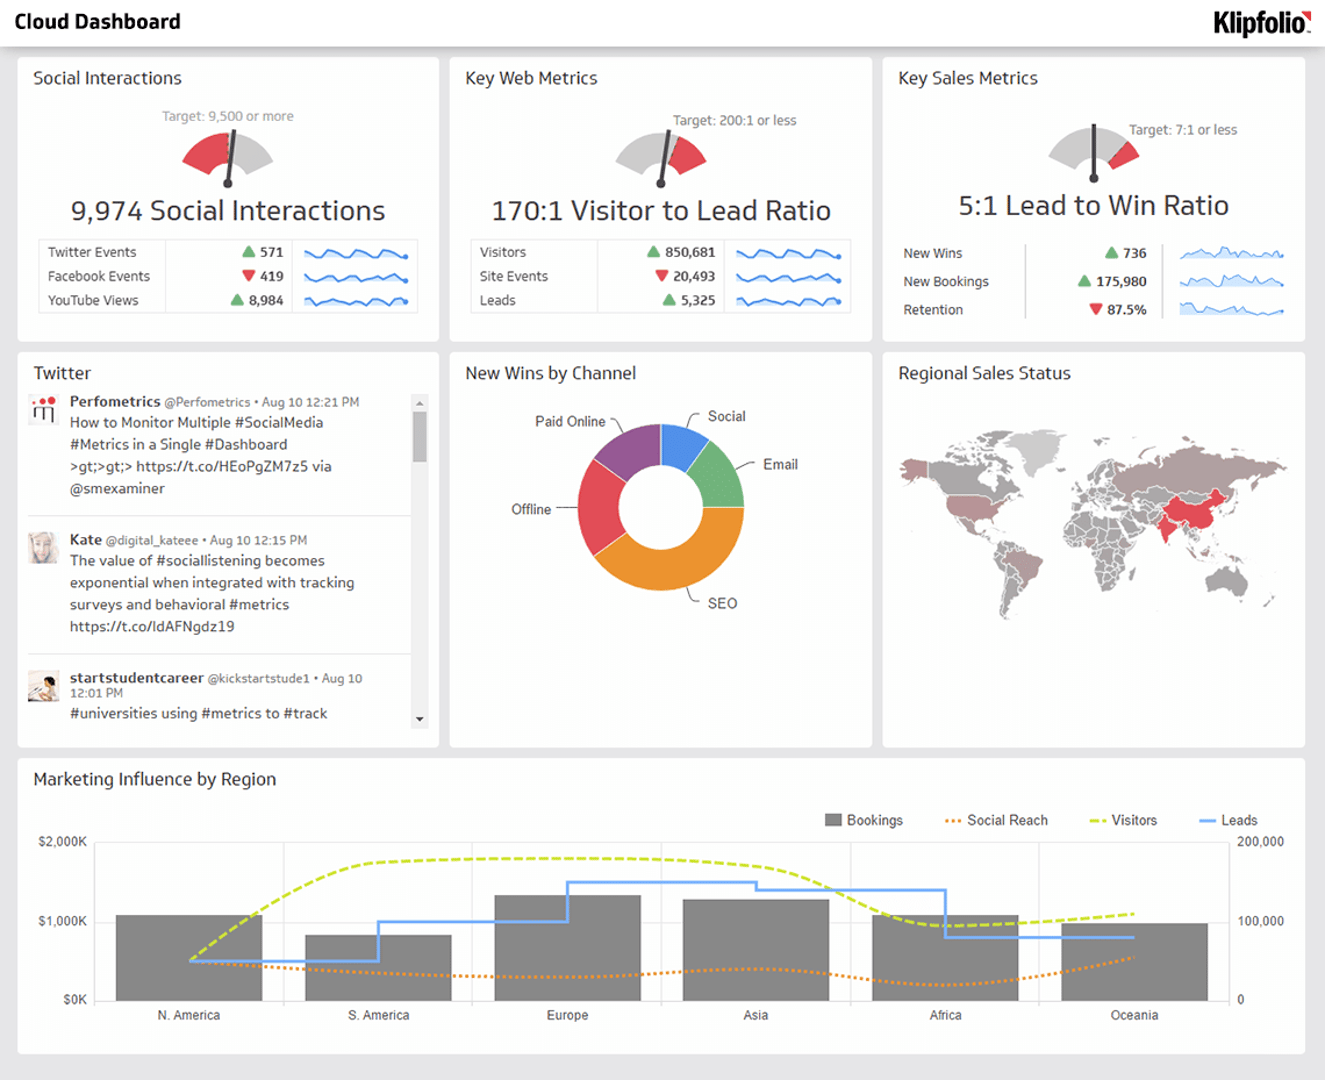
A Status Dashboard is a visual display that provides real-time updates about key performance indicators (KPIs) and other vital data. Crafted for simplicity and clarity, stakeholders can quickly comprehend a situation's status and make informed decisions. From IT operations to marketing campaigns, the Status Dashboard has permeated various business sectors, augmenting efficiency and precision.
Components of a Status Dashboard
A Status Dashboard is more than just a display; it's a complex amalgamation of data, design, and technology. Here are some of its primary components:
- KPIs: These are quantifiable measures that help businesses track and assess progress toward their goals. The Status Dashboard displays these KPIs in an easily digestible format.
- Real-Time Data: Status Dashboards are characterized by their real-time nature. They continually update to provide the most current snapshot of the business operations.
- Visual Elements: Charts, graphs, and other visual aids are employed to make the data more understandable and engaging.
- User-friendly Interface: The design of a Status Dashboard is centered around user-friendliness, enabling users of all technical levels to navigate and interpret the data.
The Importance of Status Dashboards
Status Dashboards have emerged as vital entities in today's data-saturated world. They offer a plethora of benefits:
- Improved Decision Making: Status Dashboards convert raw data into actionable insights, facilitating informed and timely decisions.
- Efficiency: They provide a consolidated view of multiple data sources, reducing the time spent on data collation and analysis.
- Transparency: By displaying real-time data, Status Dashboards promote transparency and foster trust within the organization.
- Goal Tracking: They enable businesses to monitor their progress towards strategic objectives continually.
Applications of Status Dashboards
The versatility of Status Dashboards allows them to be implemented across many sectors. Here are some of the areas where they have made a significant impact:
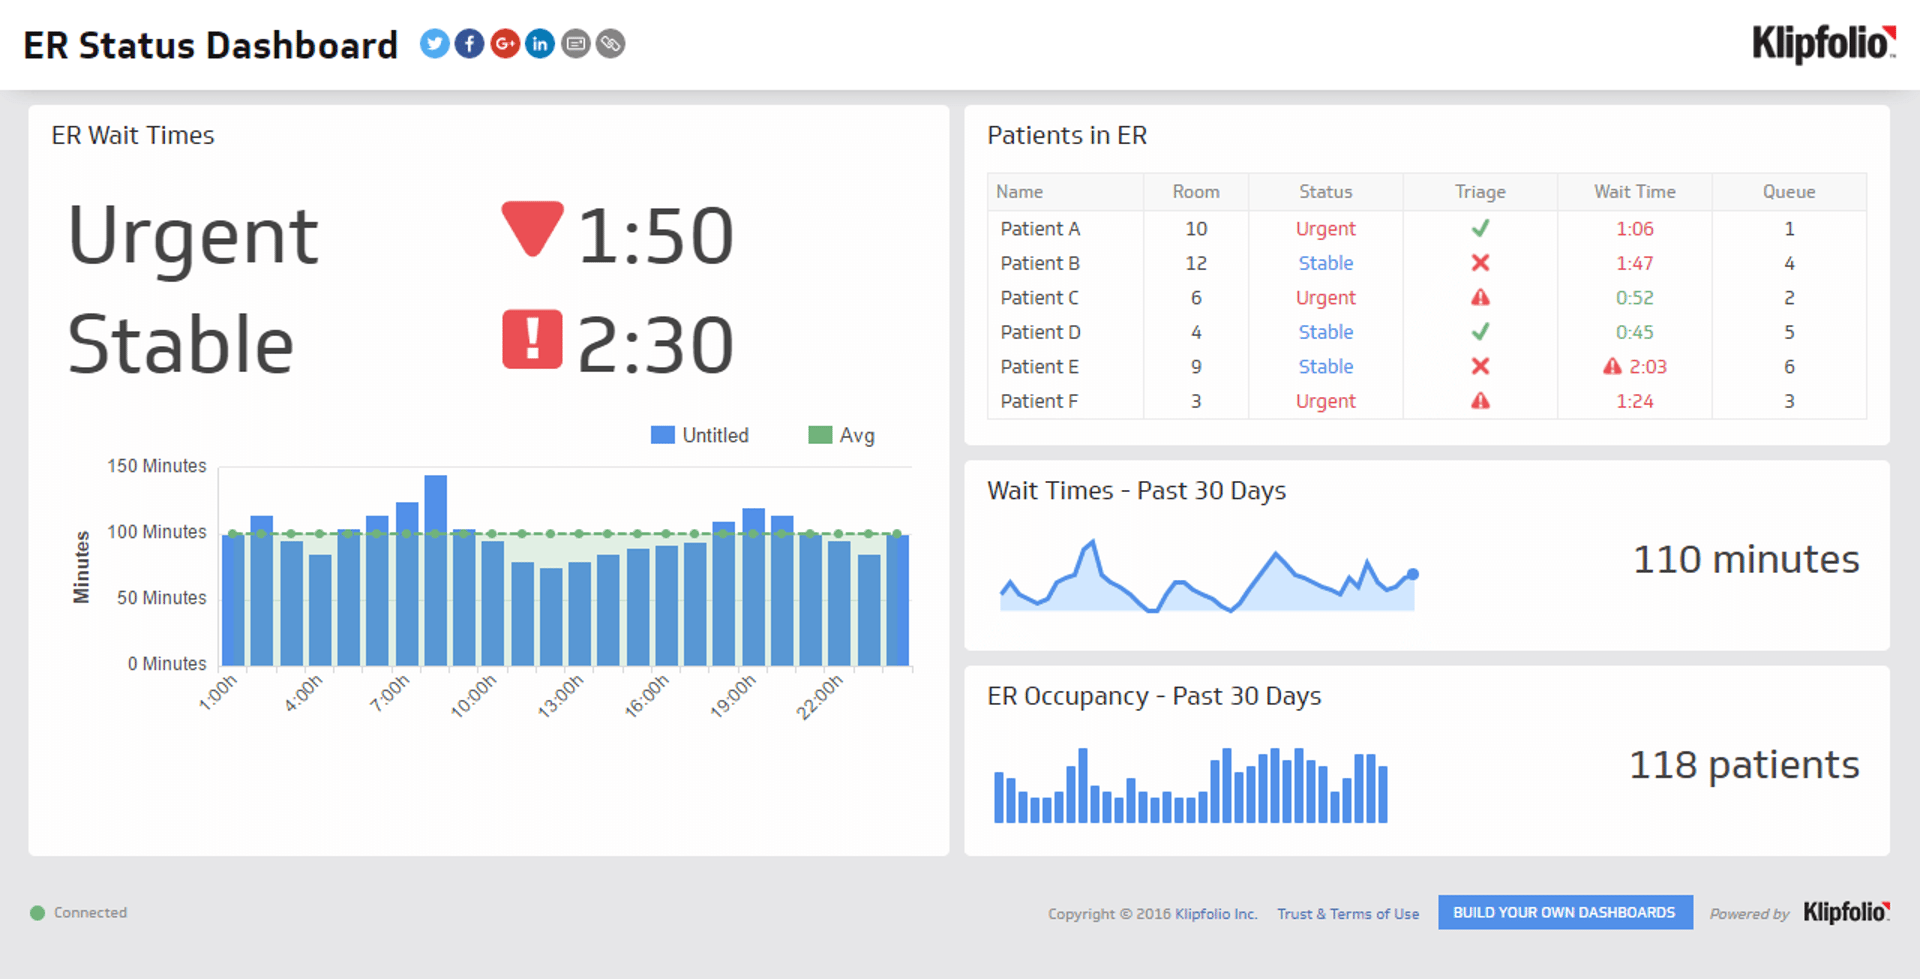
- IT Operations: In IT, Status Dashboards can monitor network health, server status, and system performance, allowing for swift issue resolution.
- Marketing: Marketing teams use Status Dashboards to track campaign performance, user engagement, and return on marketing investment (ROI), enabling them to fine-tune their strategies.
- Sales: Sales departments utilize Status Dashboards to monitor sales figures, track sales opportunities, and analyze sales funnel performance.
- Customer Support: In customer support, Status Dashboards can track ticket resolution times, customer satisfaction levels, and support team performance.
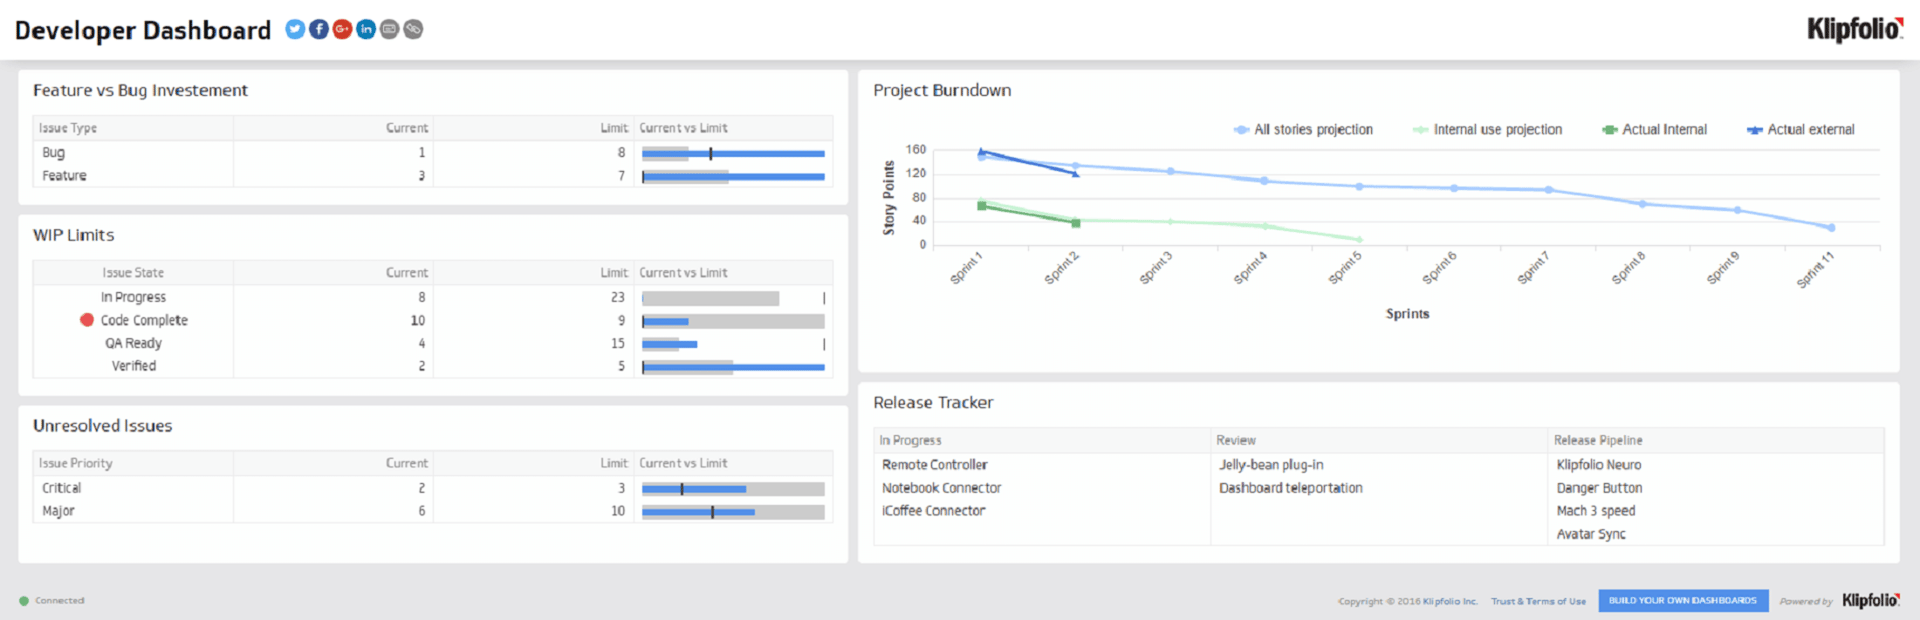
- Project Management: Project managers leverage Status Dashboards to track project status, manage resources, and monitor timelines.
In the world of data, the Status Dashboard serves as the lighthouse, illuminating the path toward informed decision-making and strategic growth. It is a tool of empowerment, enabling businesses to convert the complex language of data into a clear, concise narrative that drives action.
Relevant KPIs and metrics
- Marketing KPIs and Metrics
- Call Center KPIs and Metris
- Sales KPIs and Metrics
- Financial KPIs and Ratios
- Supply Chain KPIs and Metrics
- Support Desk KPIs and Metrics
Definition
A status dashboard provides a high-level overview of the performance of each department in your organization. This type of business dashboard is ideal for different teams as it provides a quick assessment of each department's performance.