
Articles
What is a KPI? Types, Limitations, and How to Make KPIs Work For Your Business
A Key Performance Indicator (KPI) is a measurable value that demonstrates how effectively a company is achieving key business objectives. Read our KPI guide to learn the meaning of the term.

Dashboard
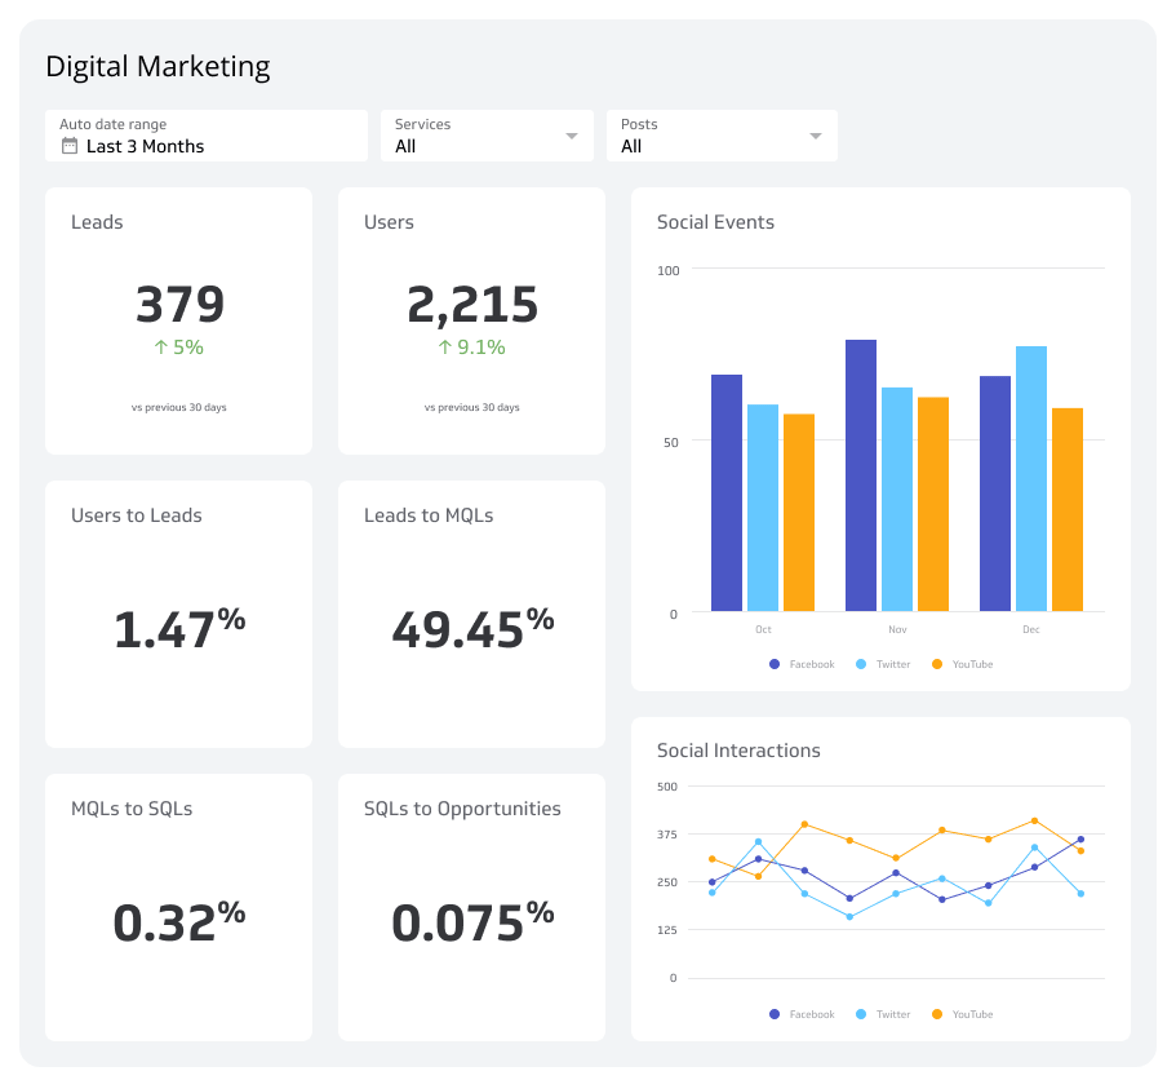
Digital Marketing Dashboard
Using a dashboard to monitor your digital marketing campaign lets you stay on track with your marketing goals and make adjustments to your strategy for areas of improvement.
Dashboard
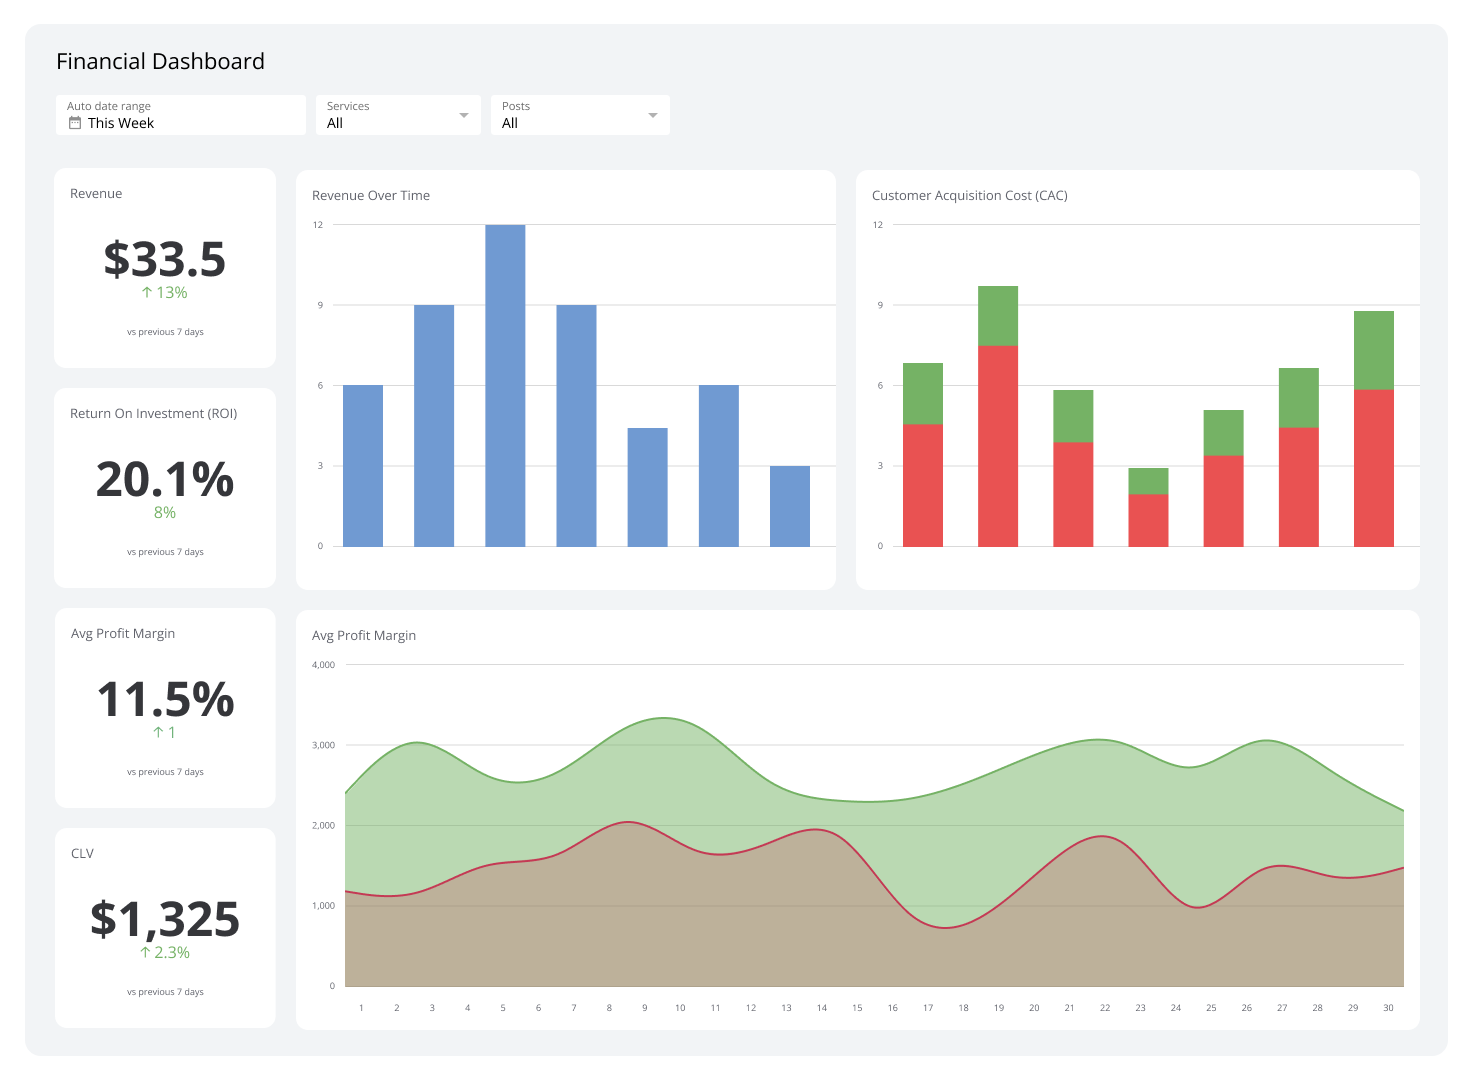
Financial Dashboard
A financial dashboard consolidates your company's financial data into a single visual interface, helping you monitor revenue, expenses, cash flow, and profitability in real time.
KPI Example
Facebook Engagement
Are you connecting with your audience on Facebook? Track your Facebook engagement metrics on a dashboard to measure the impact of your brand messaging and value.
KPI Example
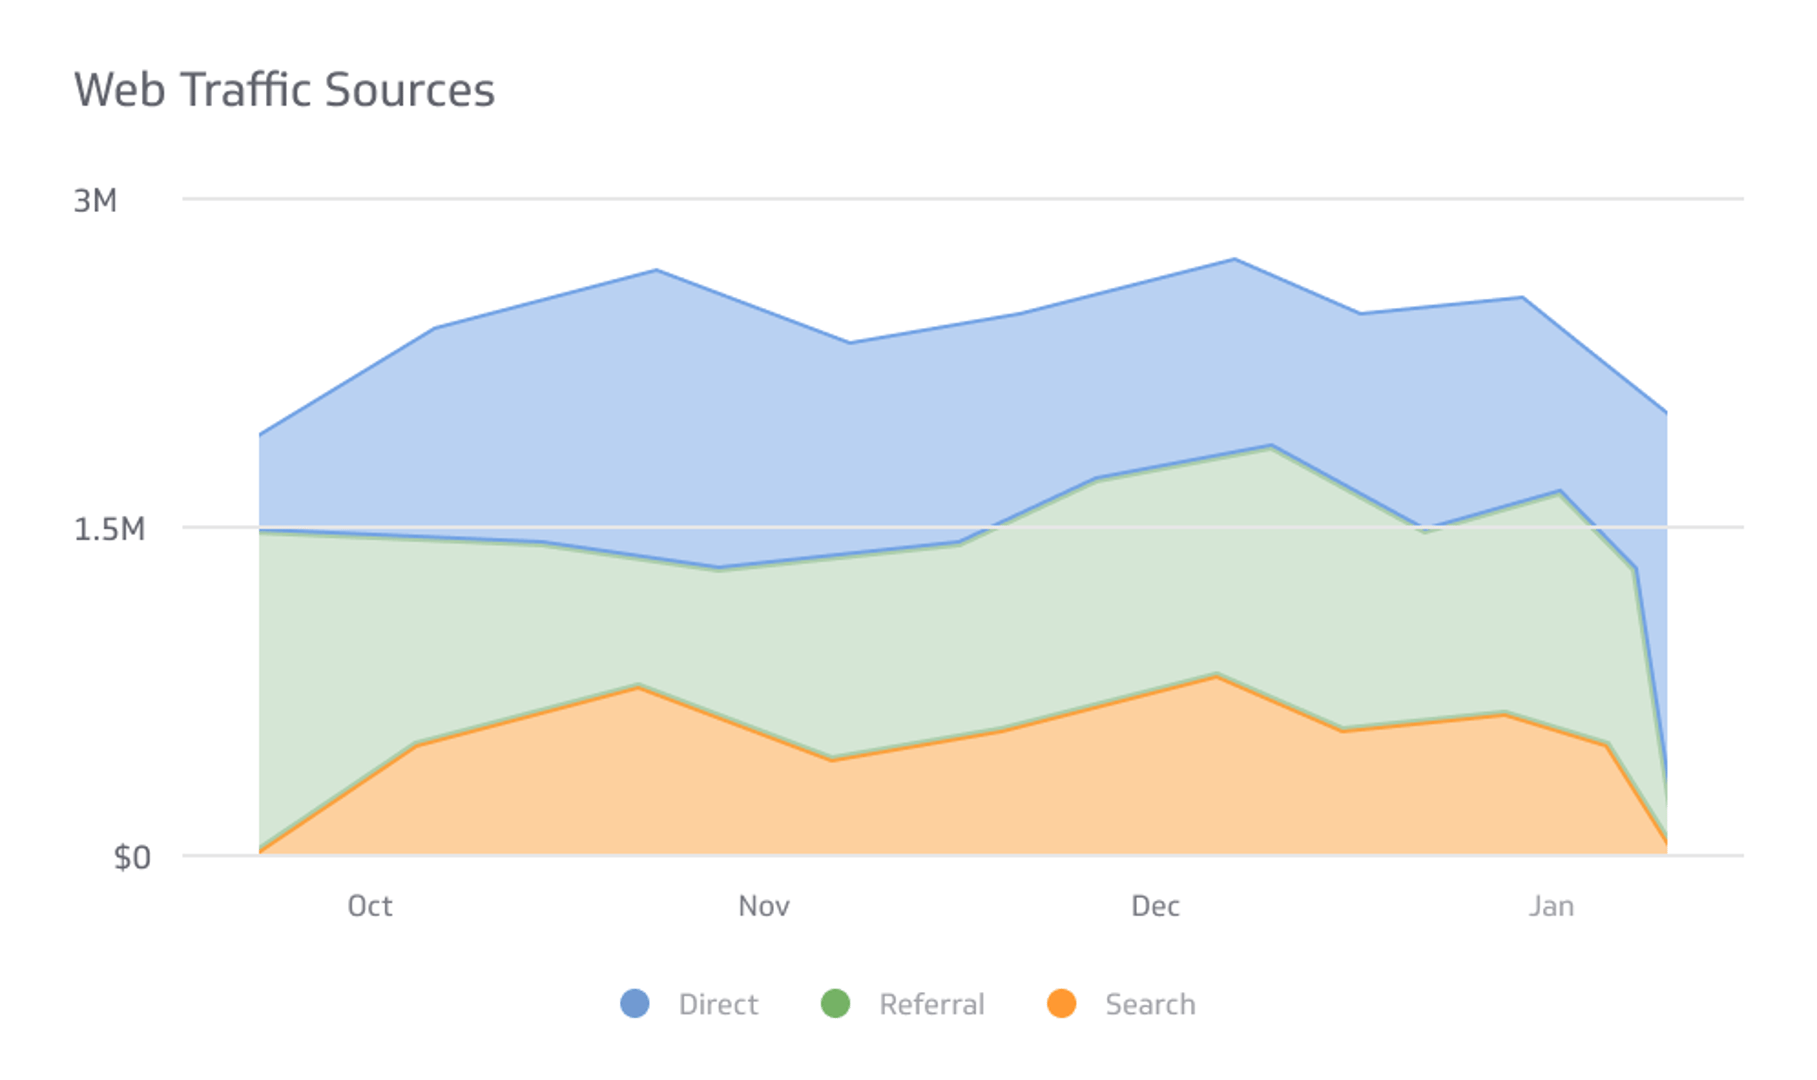
Web Traffic Sources
Learn how Klipfolio can help you measure website traffic in real-time with awesome data visualizations to wow your boss or clients. Start a Free 14 Trial.
KPI Example
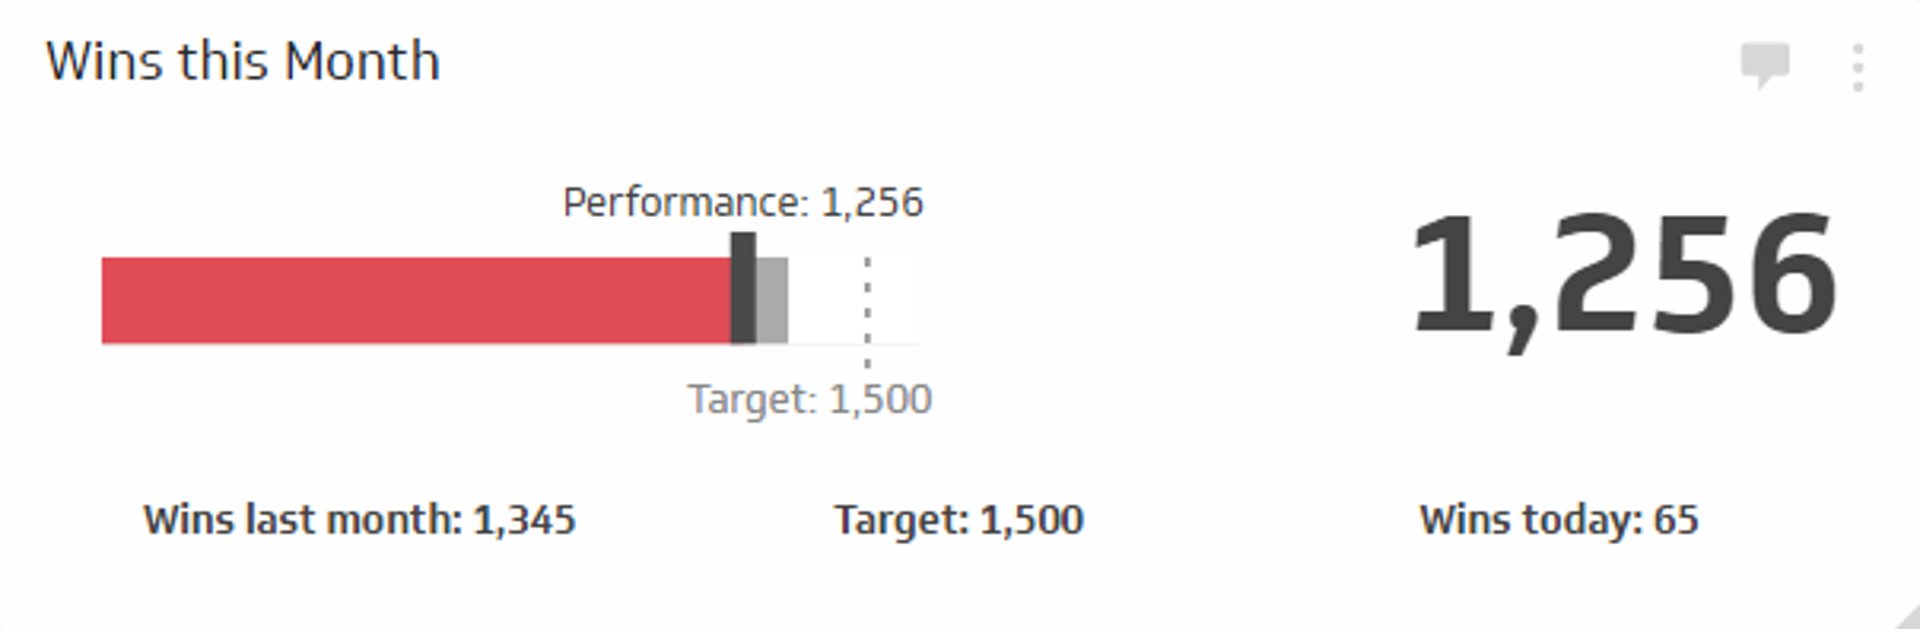
Sales Target
Learn how to measure sales targets and how to monitor your performance against targets. Plus, how to calculate sales targets.
KPI Dashboards
Over 60 business dashboards for Executives, Sales, Marketing, Social Media, and more. Check out this gallery to get inspired in building your own today!

KPI Examples
Visual KPI examples and templates for key departments such as Sales, Marketing, Accounting, Supply Chain, Call Centers and more.

Browse Dashboards & KPI Examples by Category
View all KPI Examples or Dashboard Examples
Social Media Dashboards Dashboards
Monitor your social media metrics on a dashboard so you can track Facebook, Twitter, Instagram, and YouTube all in one place.
Dashboard Example
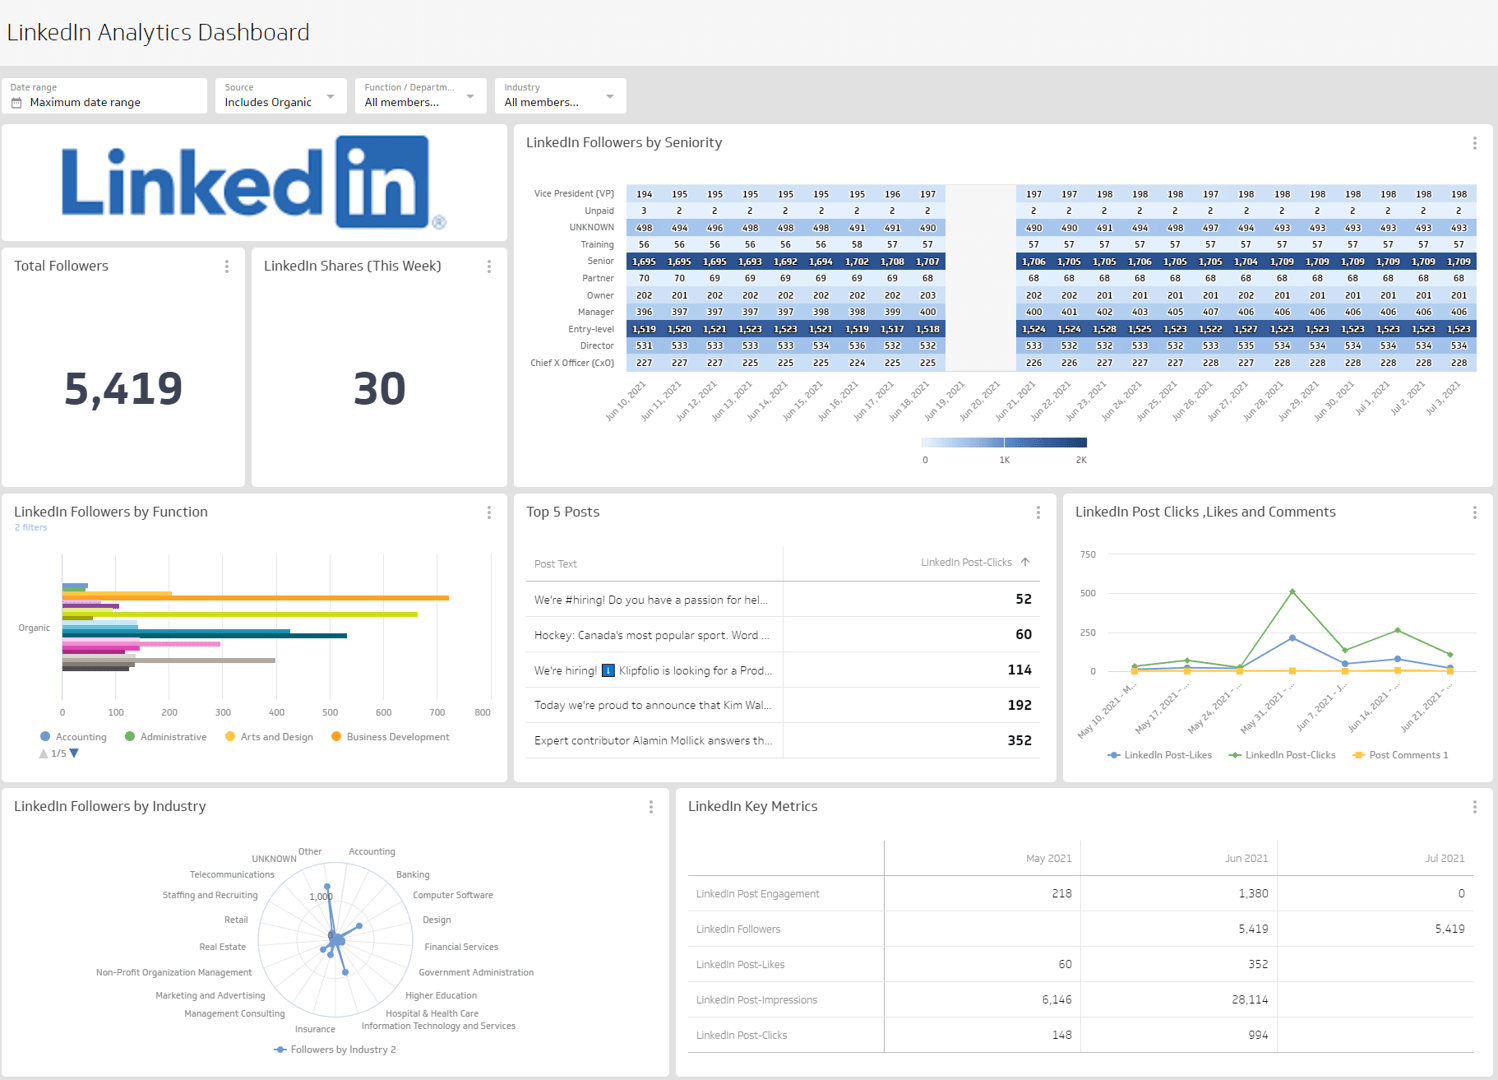
LinkedIn Analytics Dashboard
Measure your organic LinkedIn content strategy.
Dashboard Example
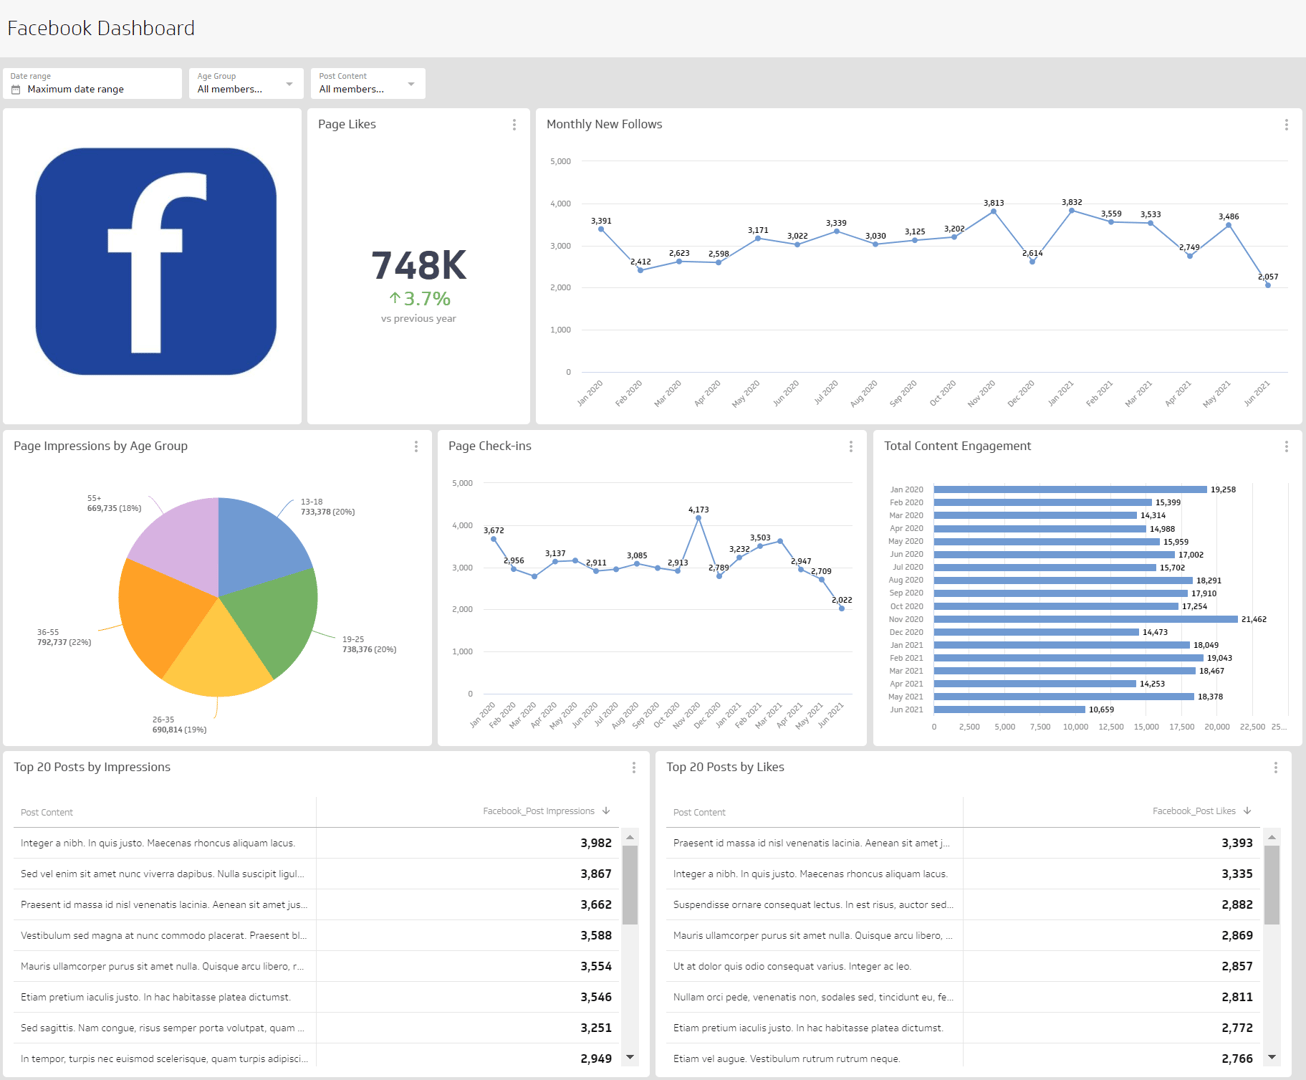
Facebook Analytics Dashboard
Monitor your campaign performance with a Facebook dashboard to track key engagement metrics.
Dashboard Example
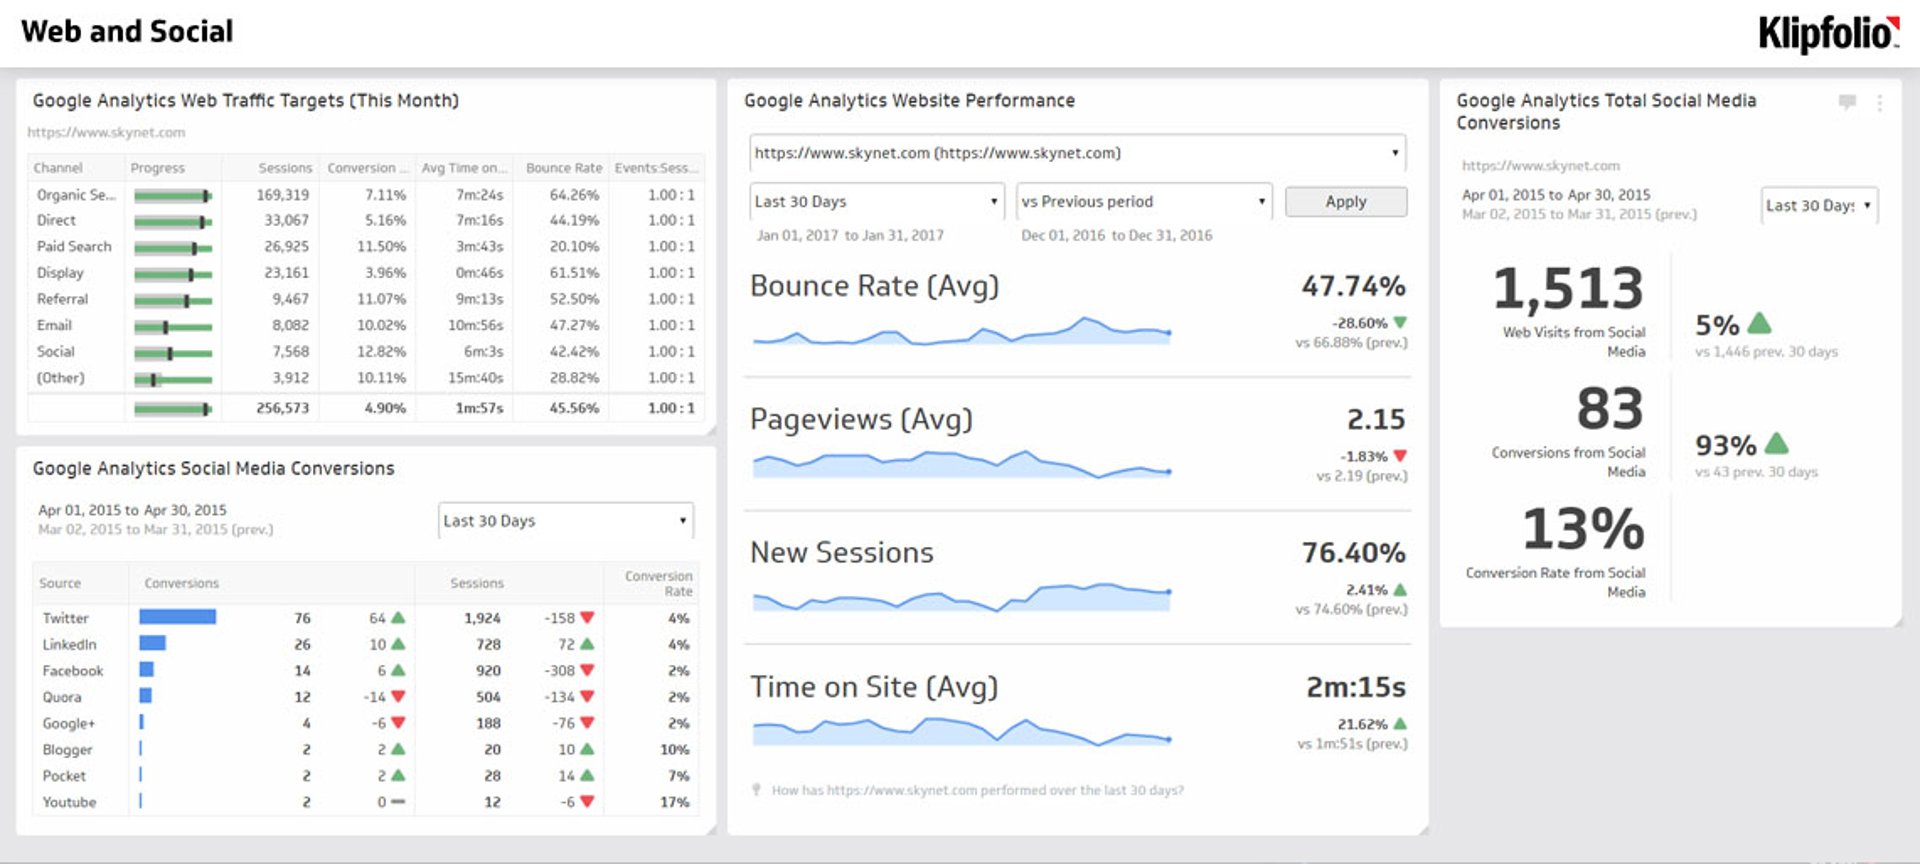
Web and Social Media Dashboard
Connect social media engagement to real business results.
Dashboard Example
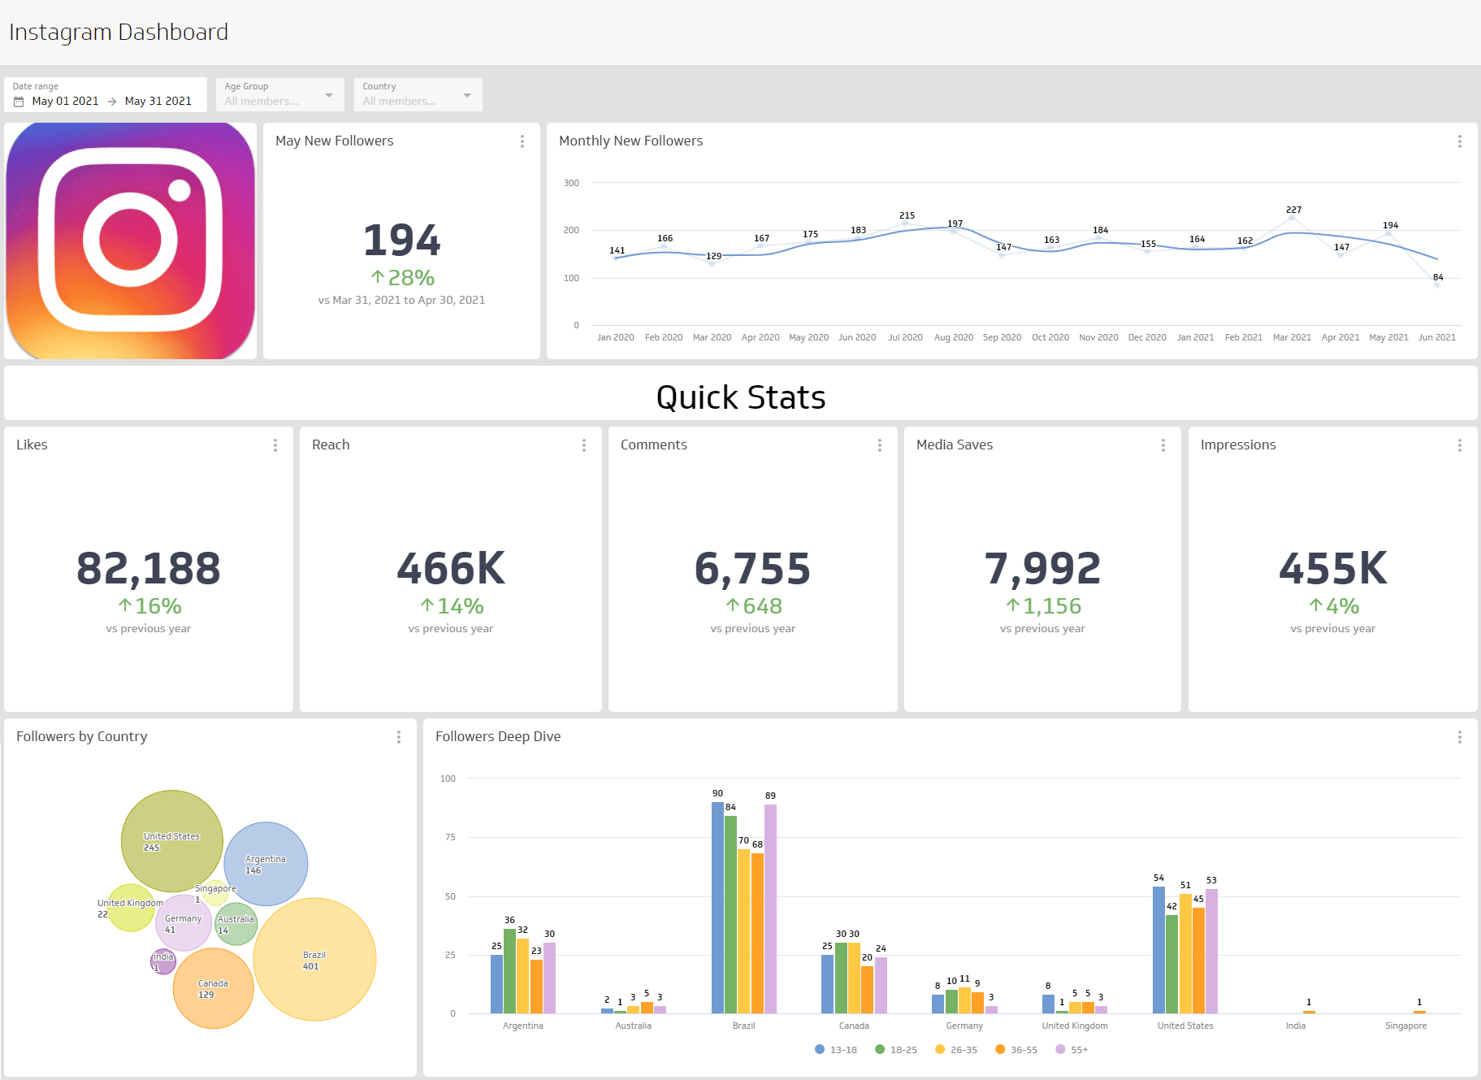
Instagram Dashboard
Track reach, engagement, and growth in one clear Instagram dashboard.
Social Media KPIs
Explore the top metrics and KPIs for modern social media marketing teams
KPI Example
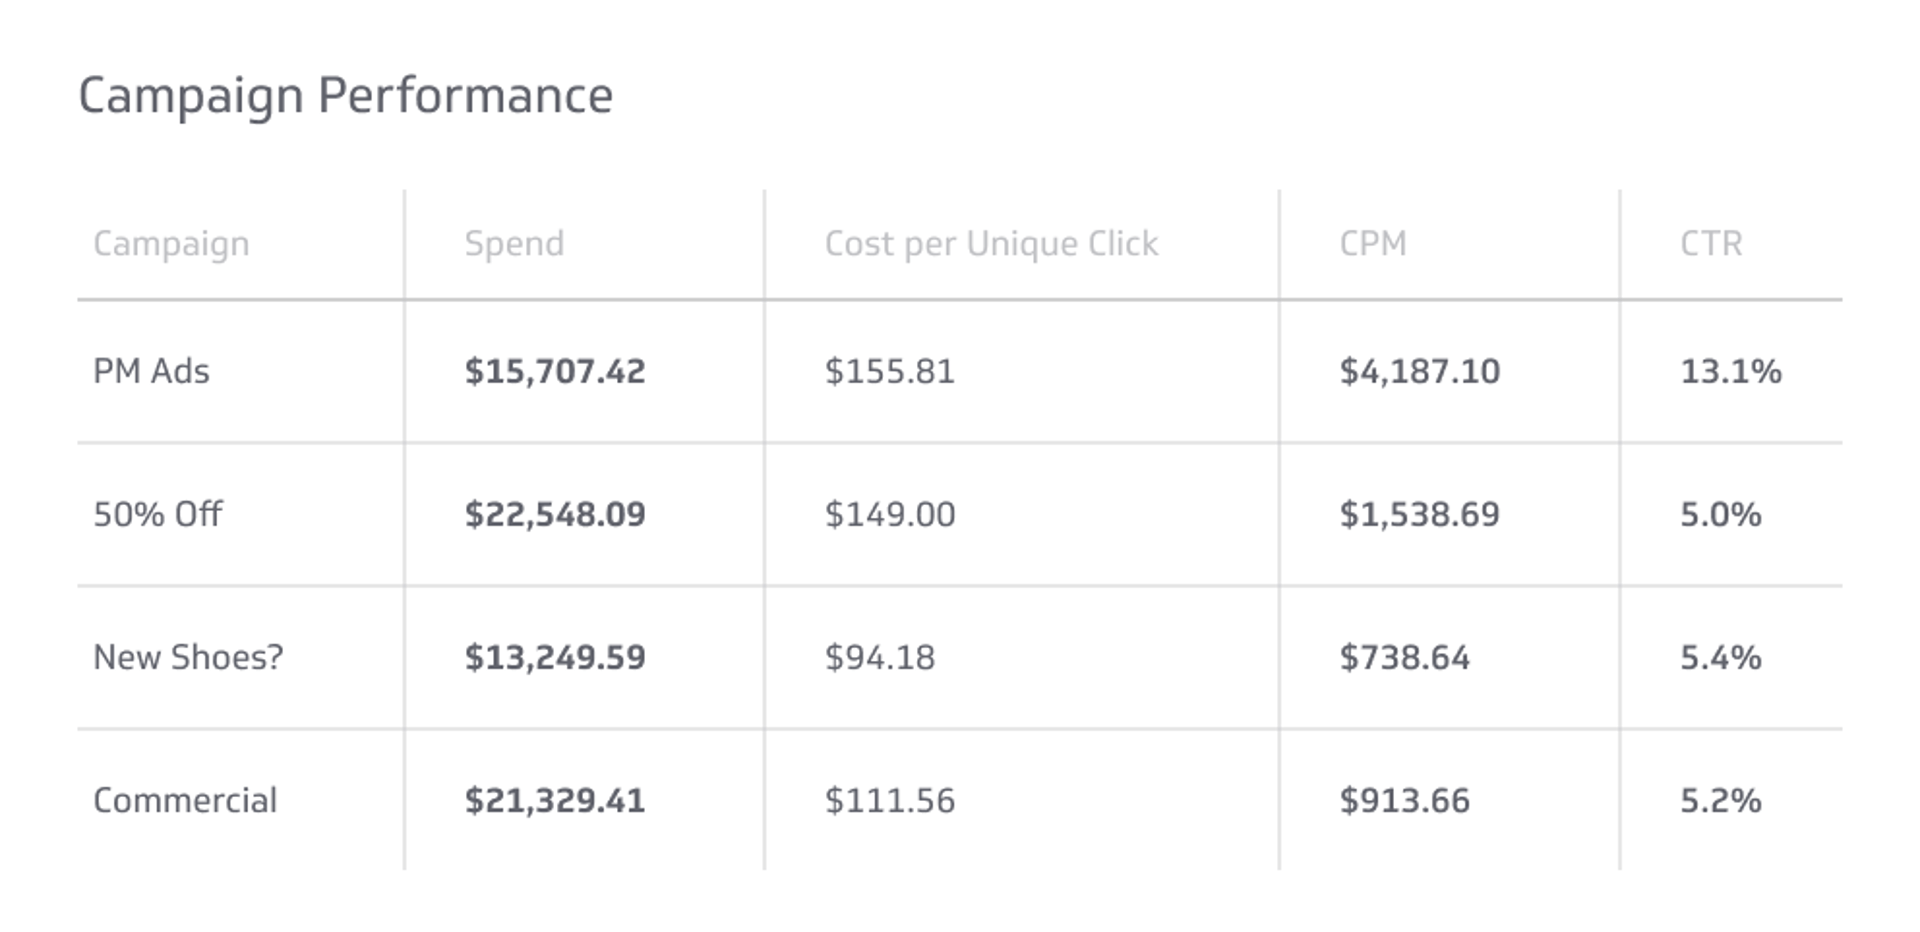
Facebook Ads Campaign Performance
Make sure your message is reaching the right audience by measuring your Facebook Ads campaign performance for the date range of your choice.
KPI Example
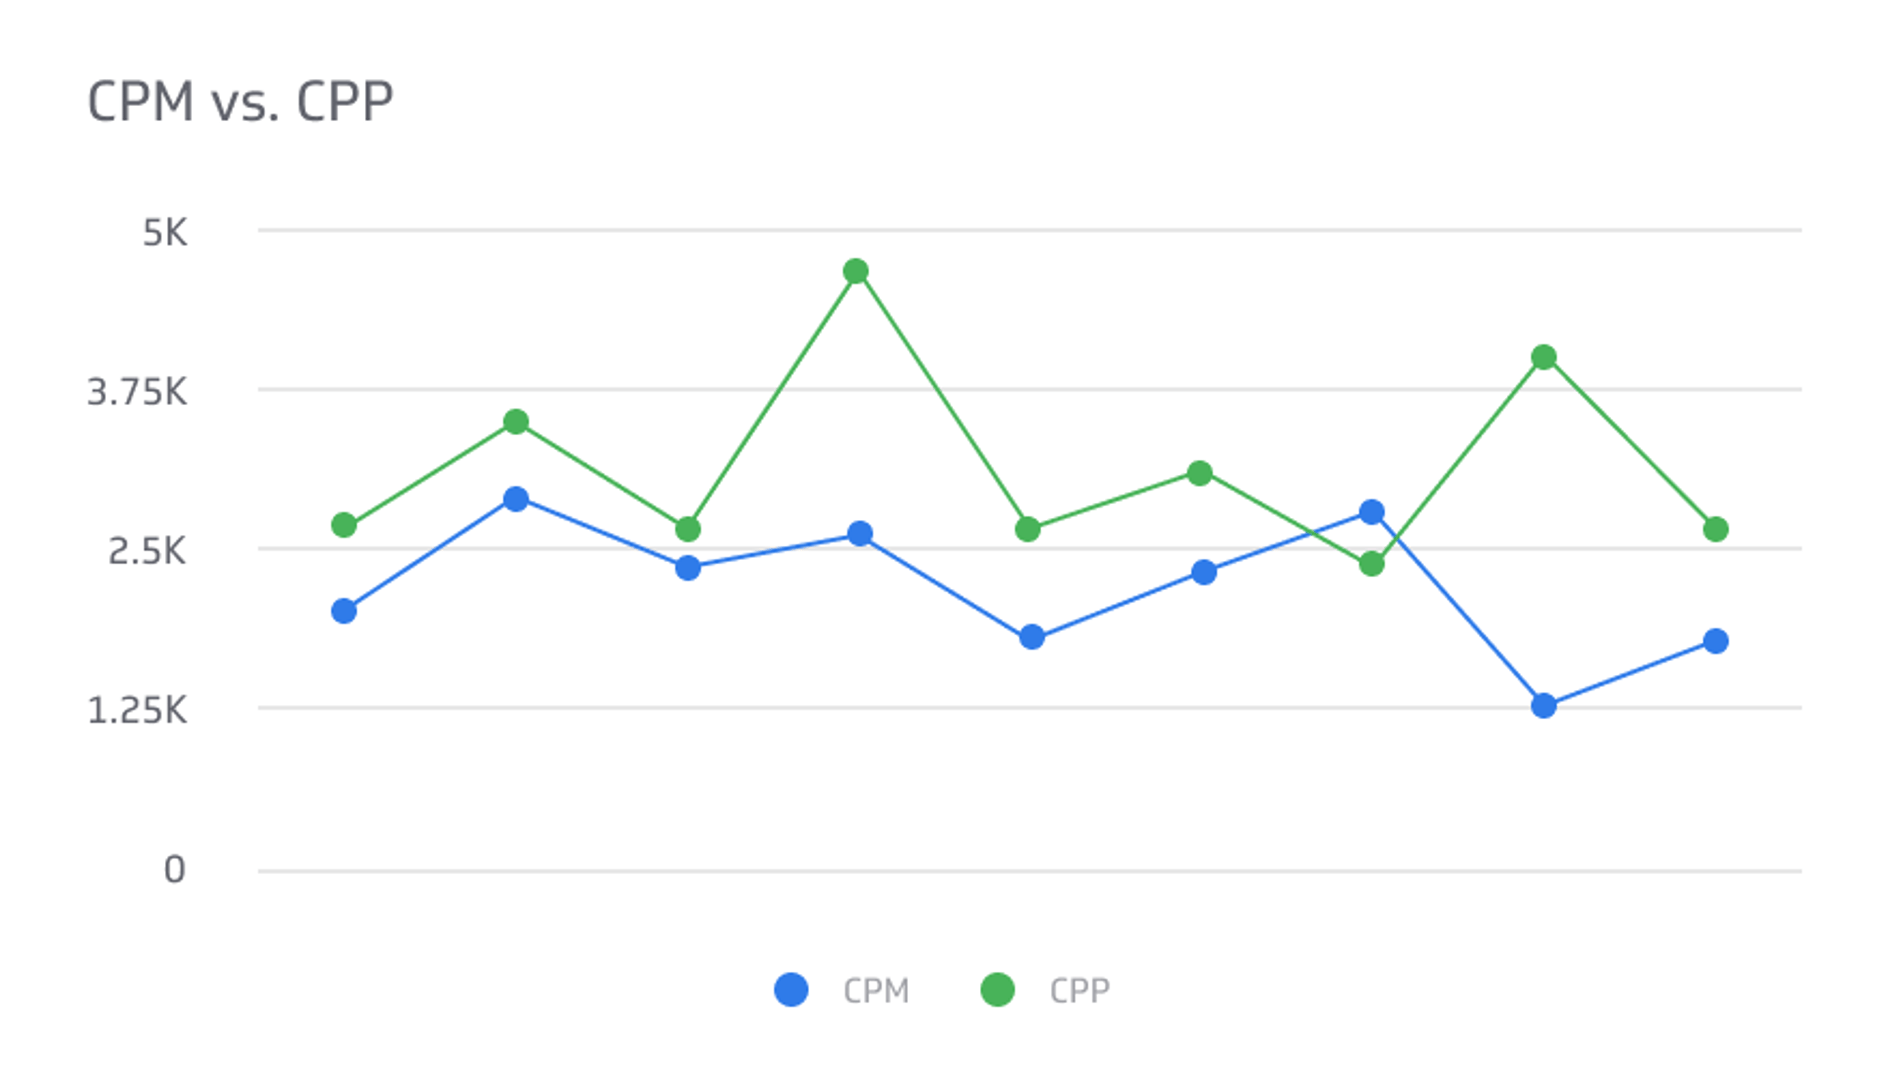
Facebook Ads: CPM and CPP
Track your Facebook Ads cost per impressions and cost per thousand to understand your ad performance and make smart, data-driven advertising decisions.
KPI Example
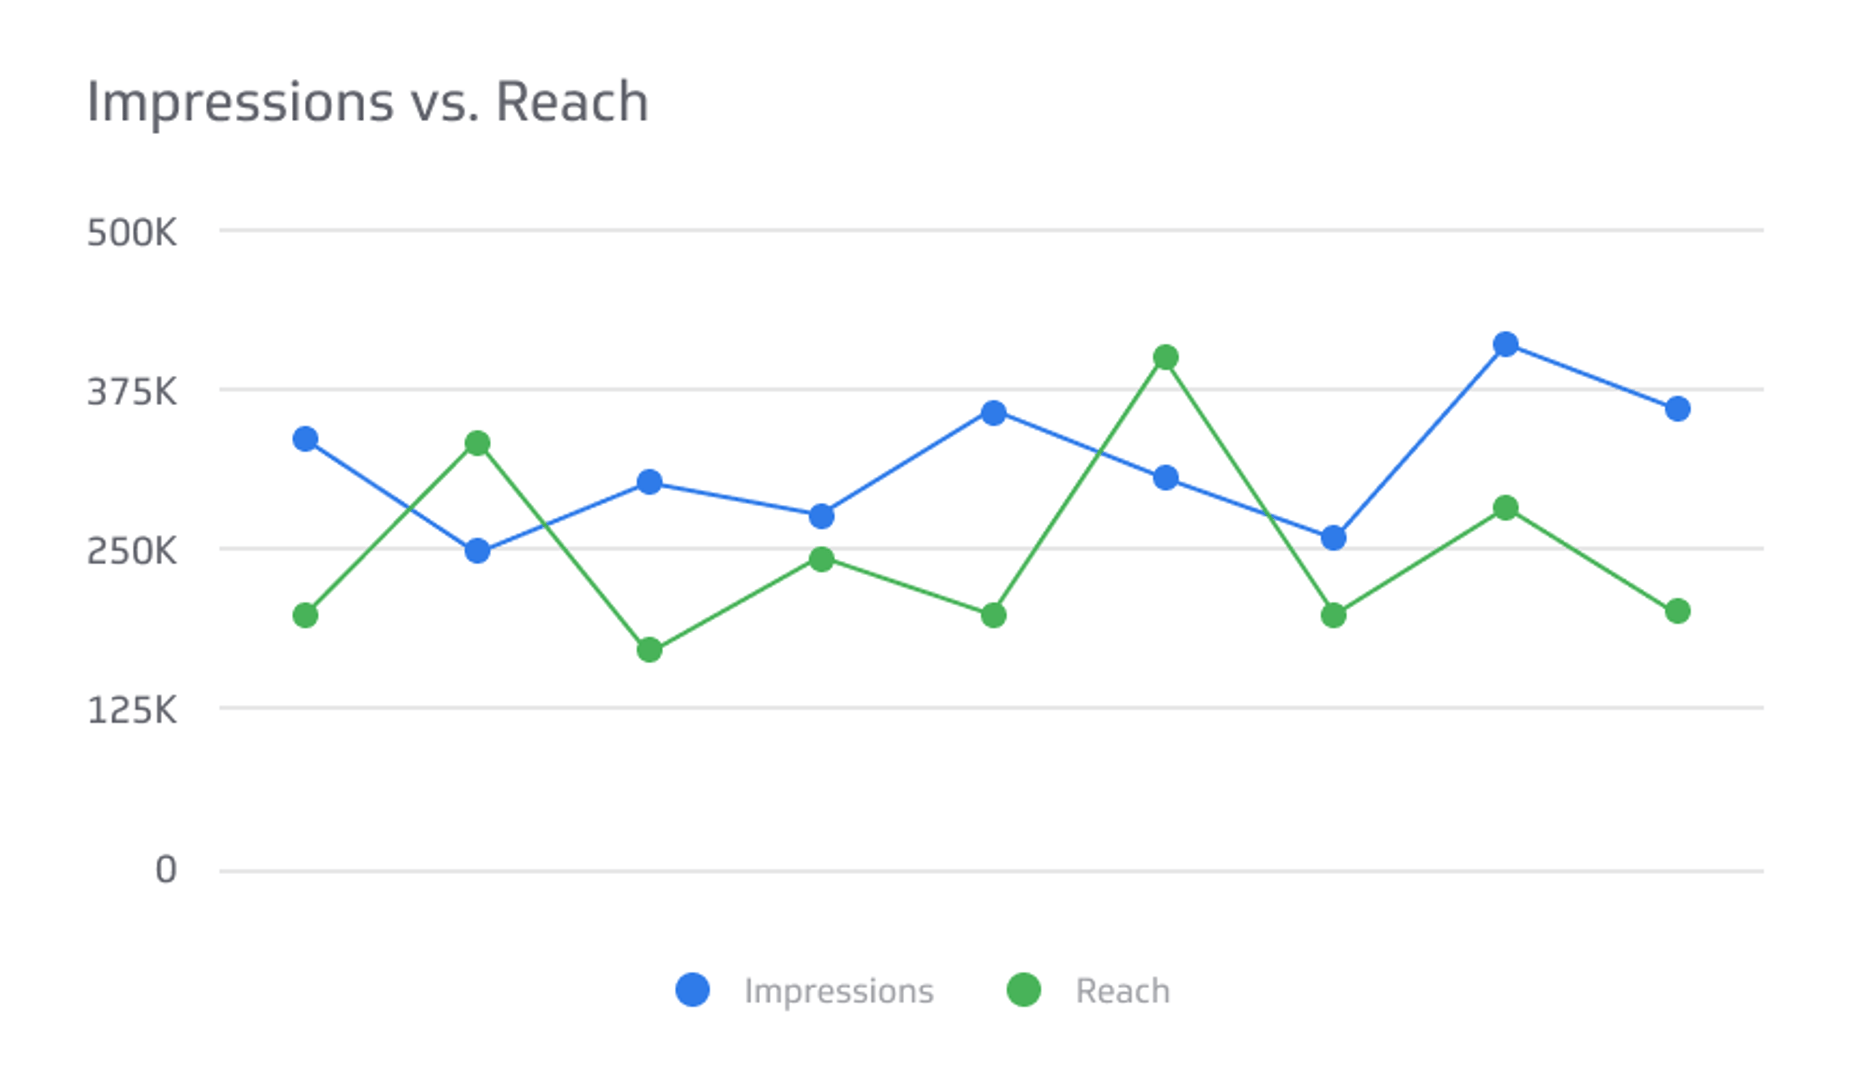
Facebook Ads Impressions and Reach
Compare your Facebook Ads impressions with reach over the past 7 days.
KPI Example
Facebook Ads Today's Summary
Drill down into today's campaign metrics and monitor your Facebook Ads objectives.
Executive Dashboards Dashboards
Modern executives use KPI dashboards to report and track corporate performance.
Dashboard Example
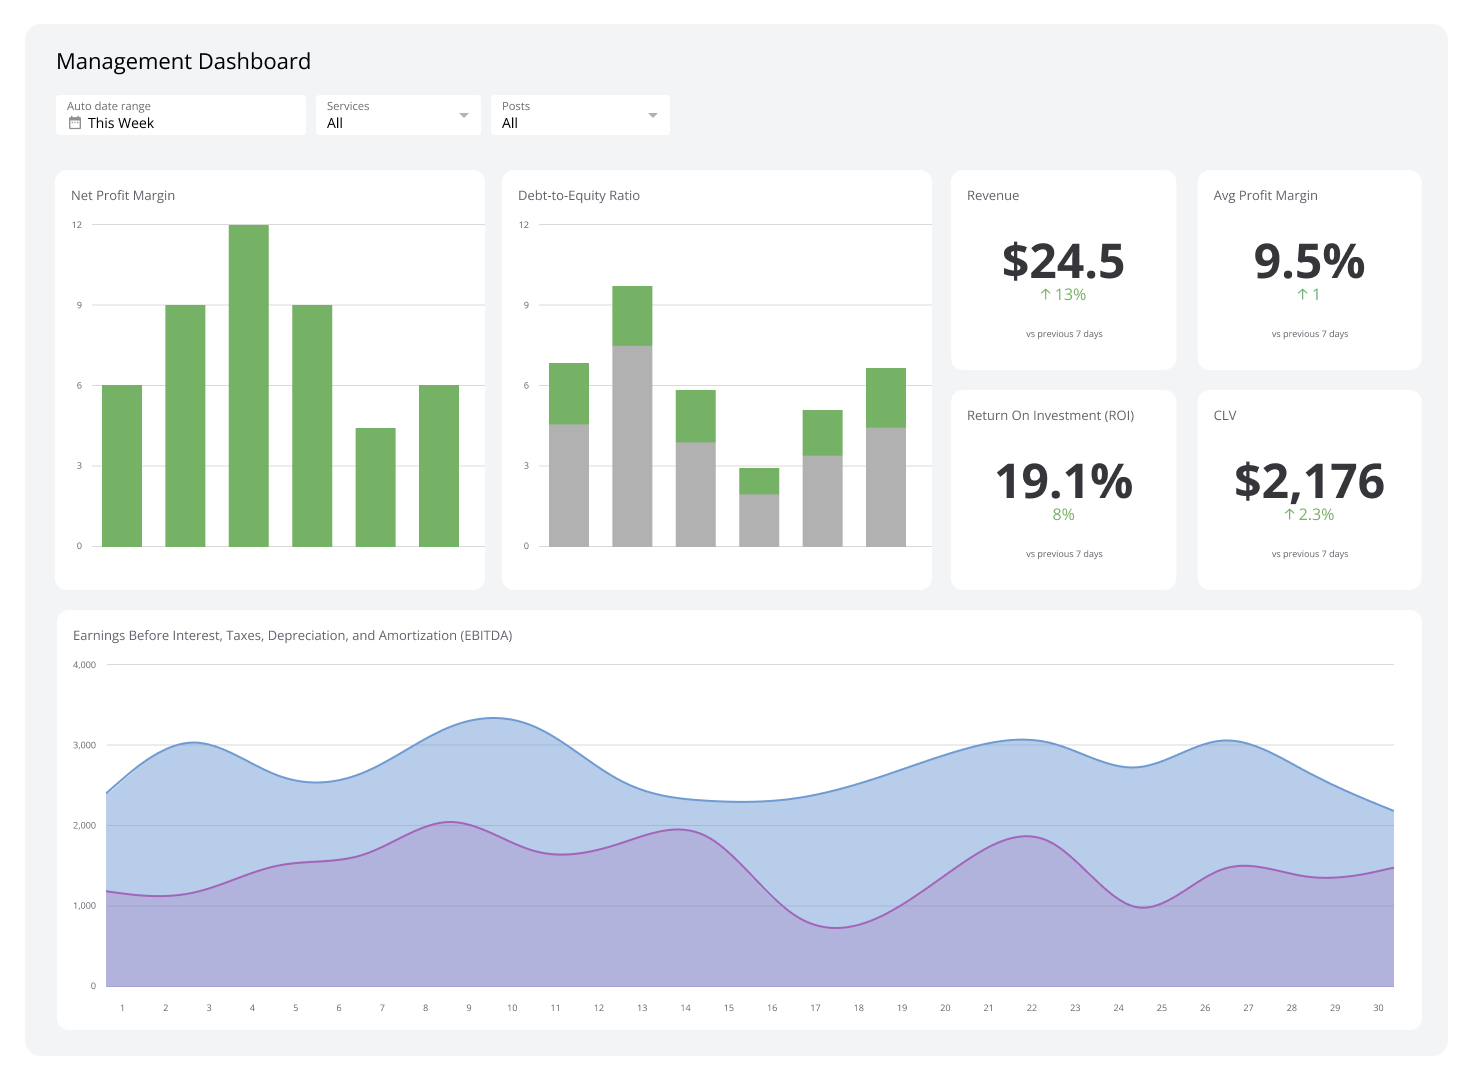
Management Dashboard
A management dashboard is a useful tool for managers to get real-time insights and pivot when needed.
Dashboard Example
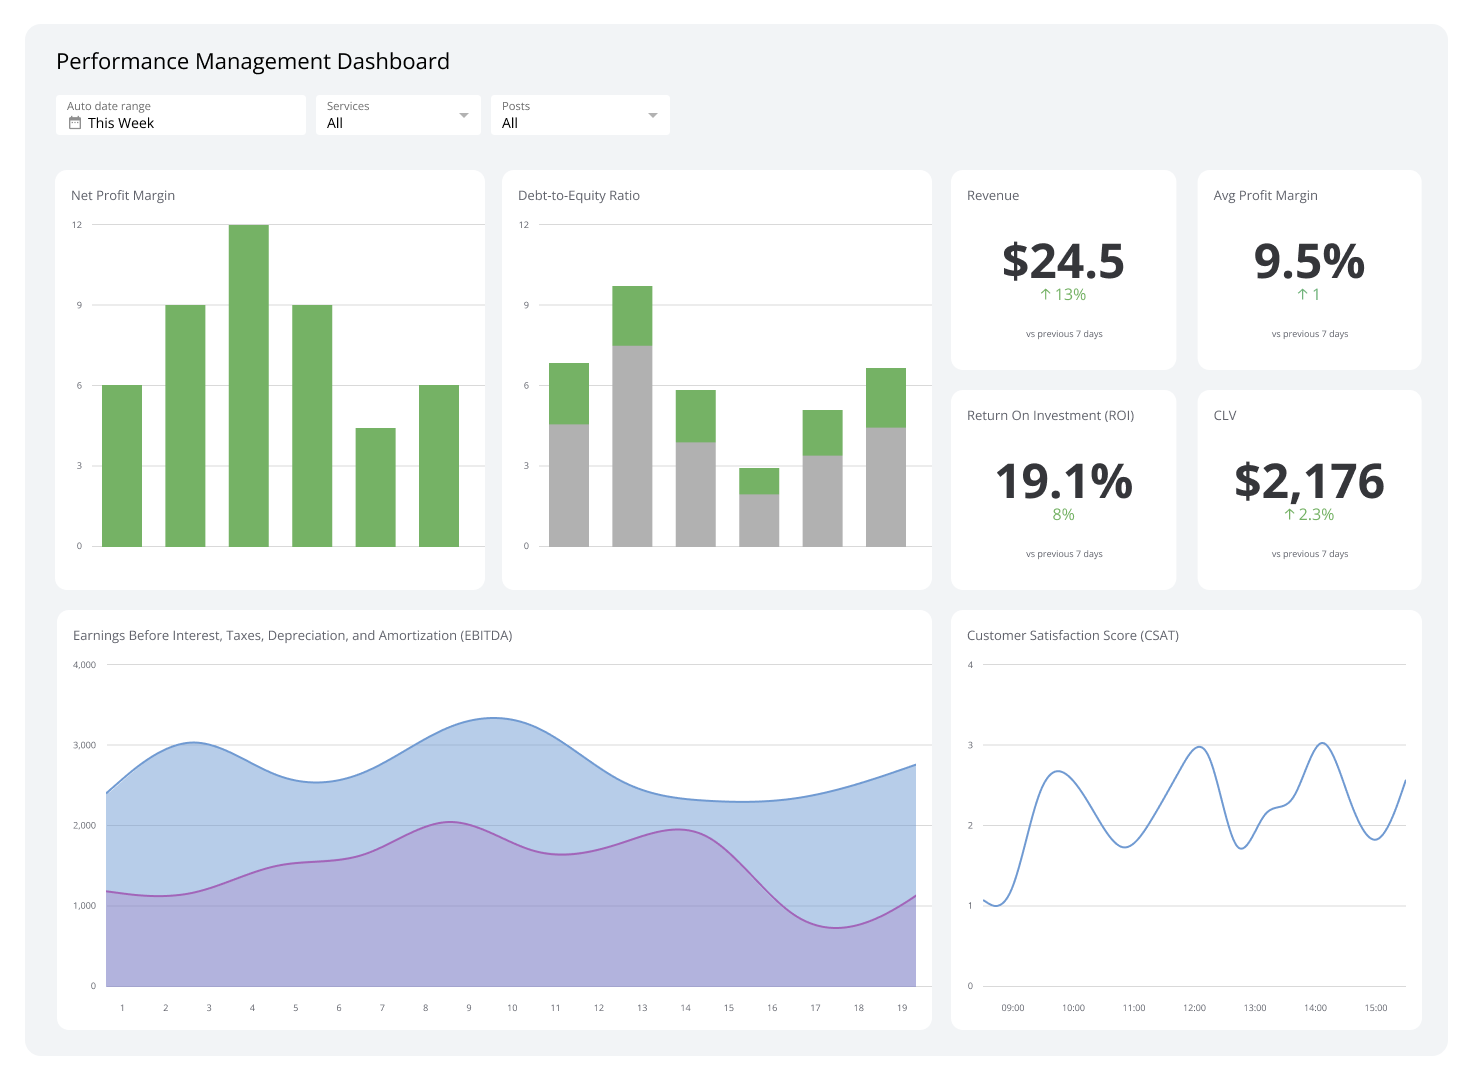
Performance Management Dashboard
Track team goals and productivity to highlight wins and fix gaps.
Dashboard Example
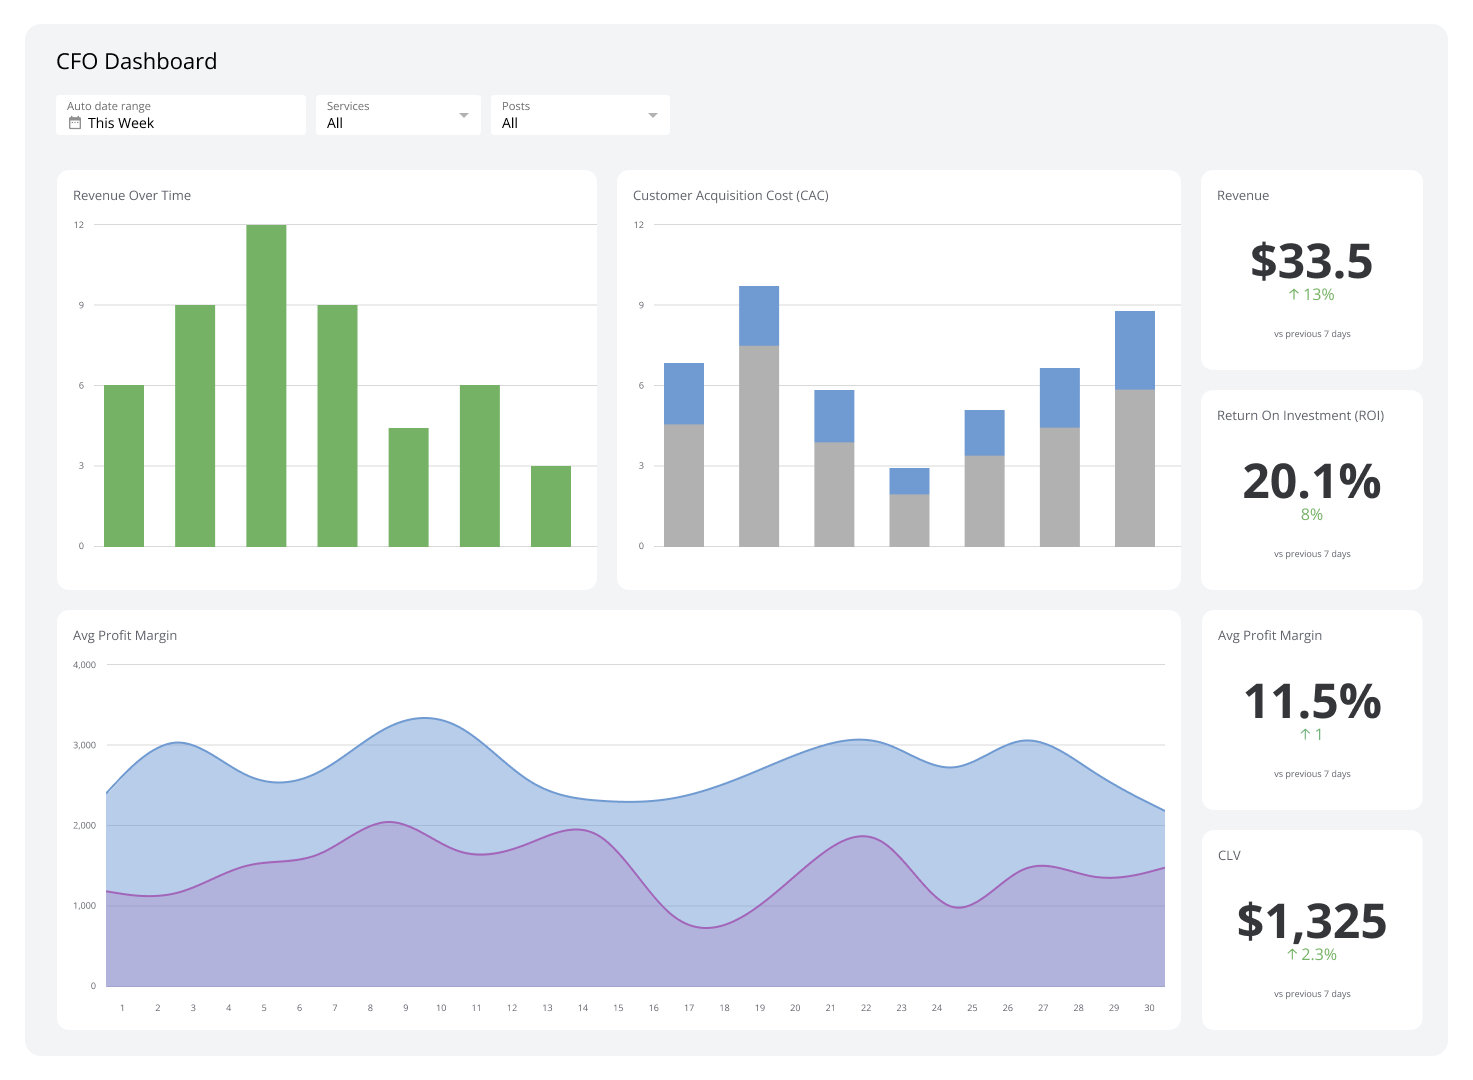
CFO Dashboard
See cash, margins, and runway at a glance to act faster.
Dashboard Example
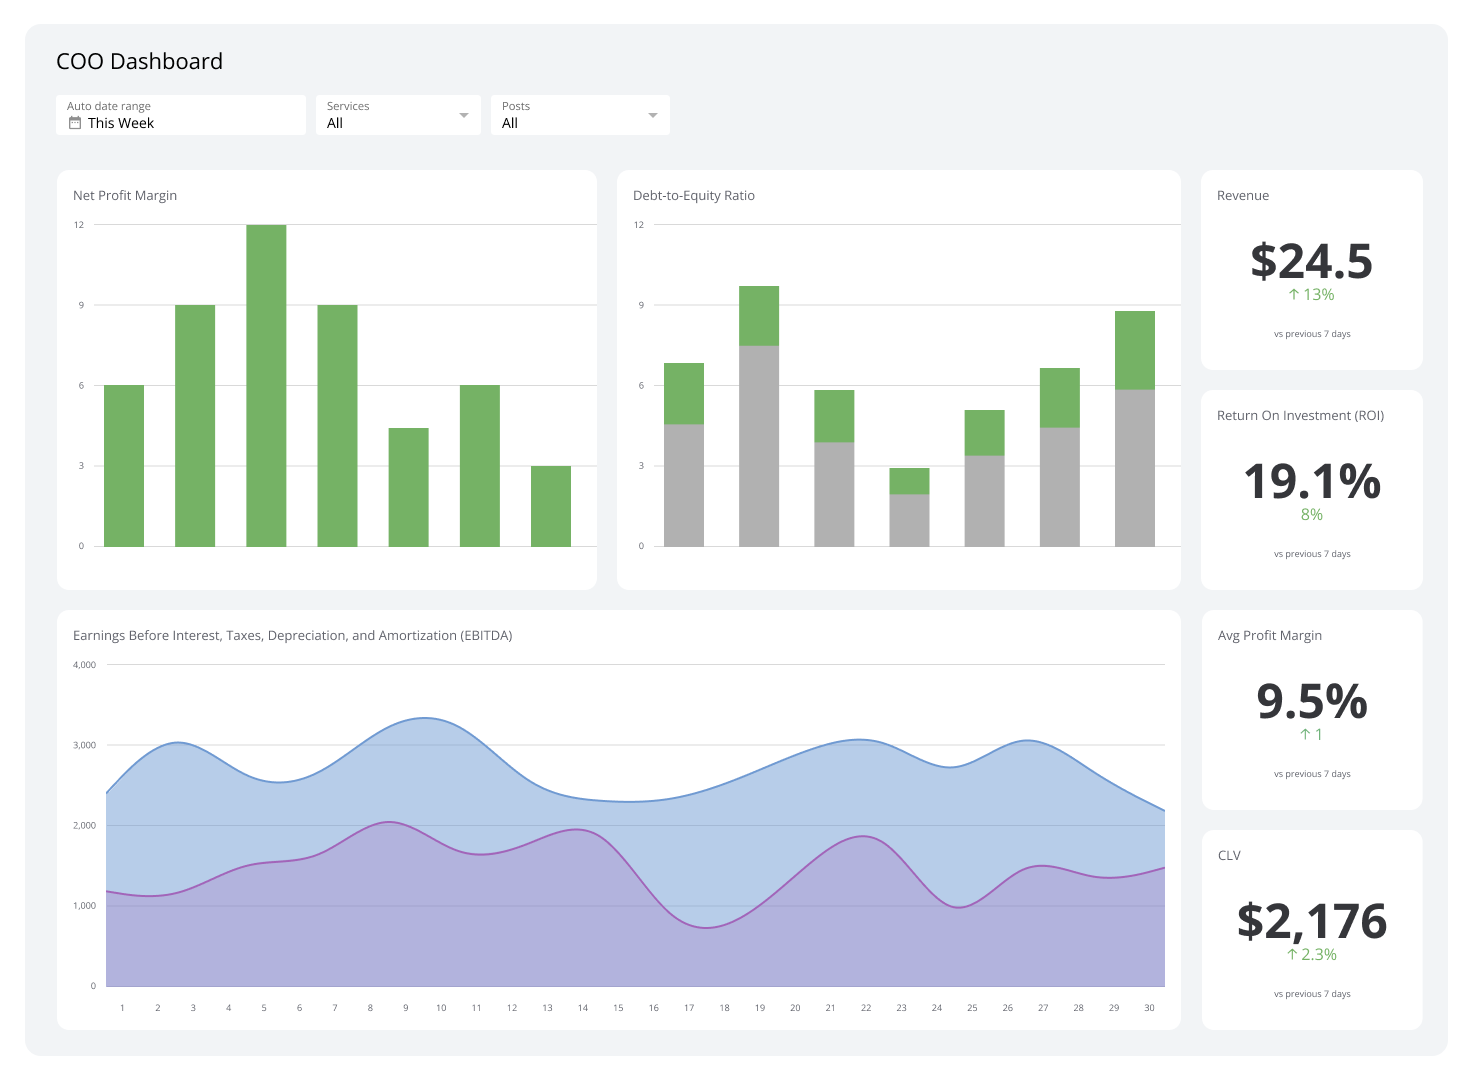
COO Dashboard
See throughput, quality, and cost in one view to act fast.
SaaS KPIs
SaaS Metrics & KPIs for modern teams
.png)
KPI Example
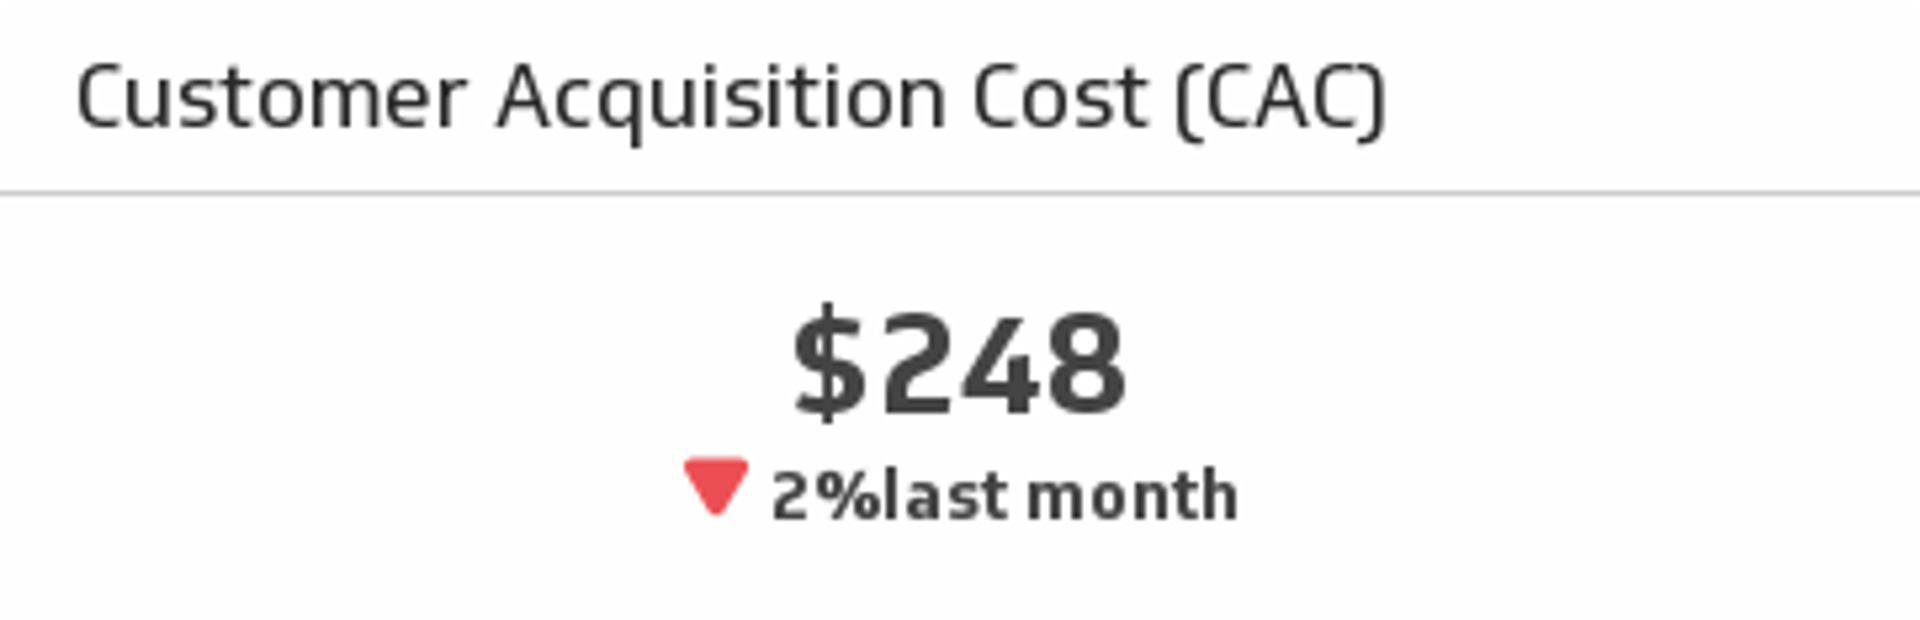
Customer Acquisition Cost
Measure Marketing and Sales Efficiency with the Customer Acquisition Cost (CAC) KPI
KPI Example
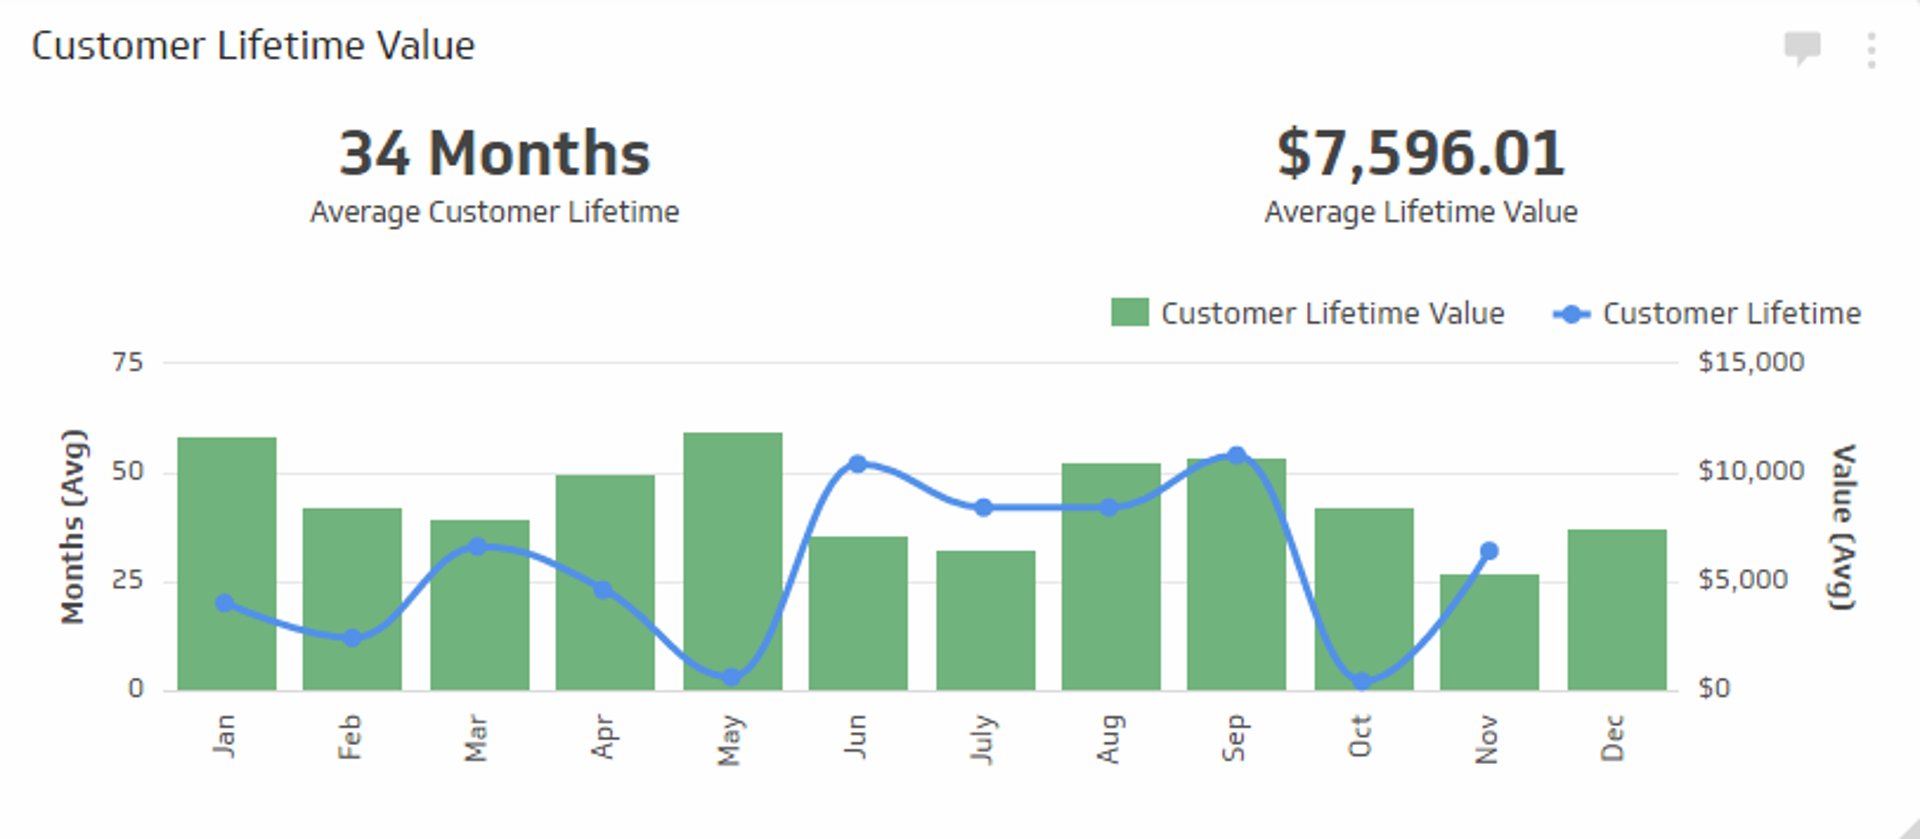
Customer Lifetime Value
Measure The Monetary Value of Each New Customer With The Customer Lifetime Value (CLV) KPI
KPI Example
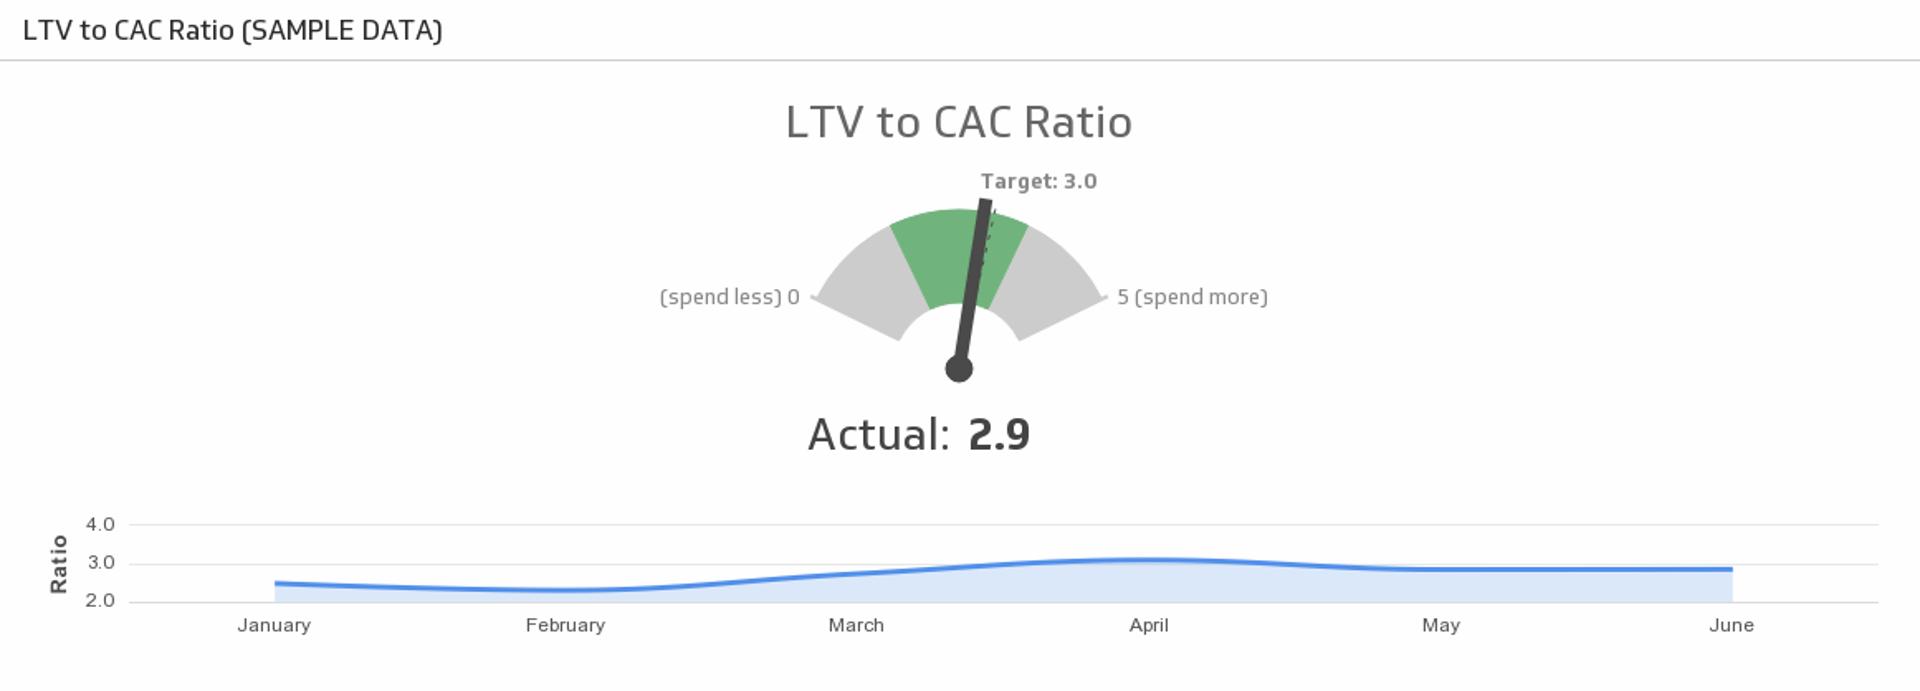
Customer Lifetime Value to Customer Acquisition Cost
Measure marketing and sales efficiency with the LTV:CAC Ratio KPI
.png)
KPI Example
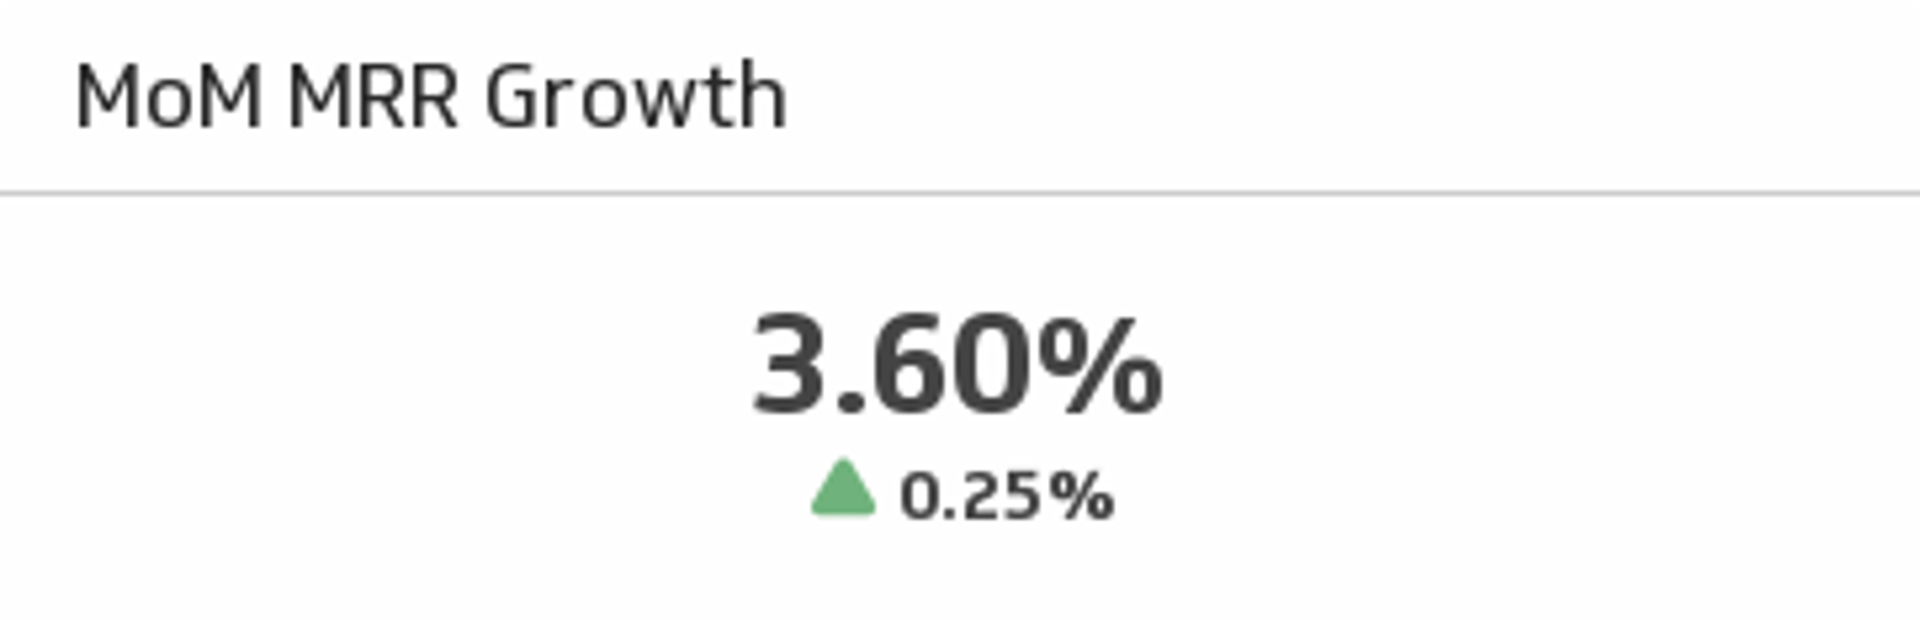
MoM MRR Growth
Your guide to calculating, tracking, and benchmarking the ultimate SaaS momentum metric.
Marketing Dashboards Dashboards
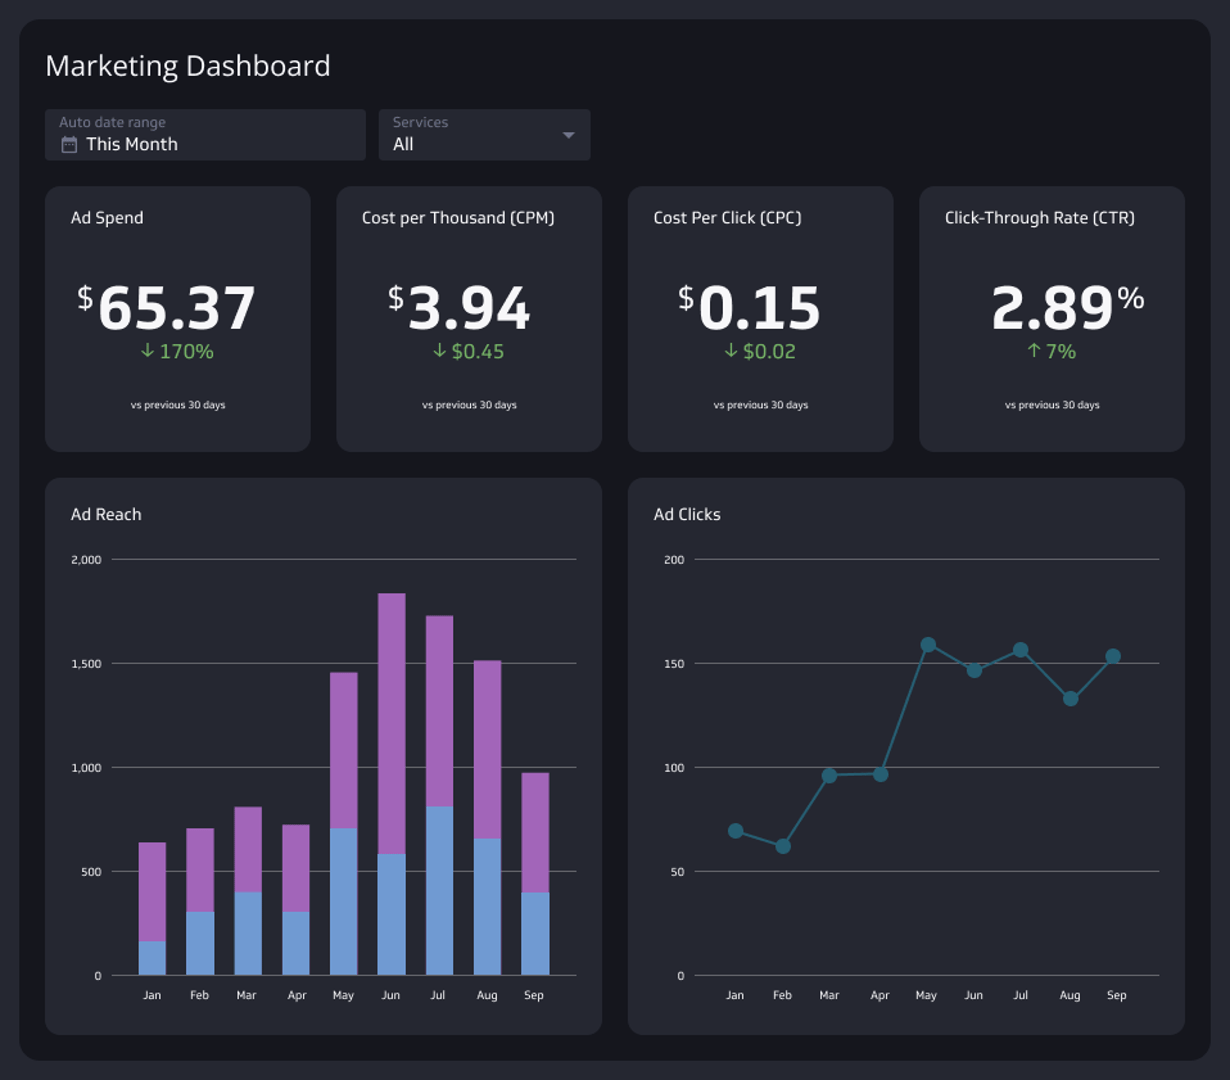
Build marketing dashboards and reports to strengthen your marketing strategy and make decisions with confidence.
Dashboard Example
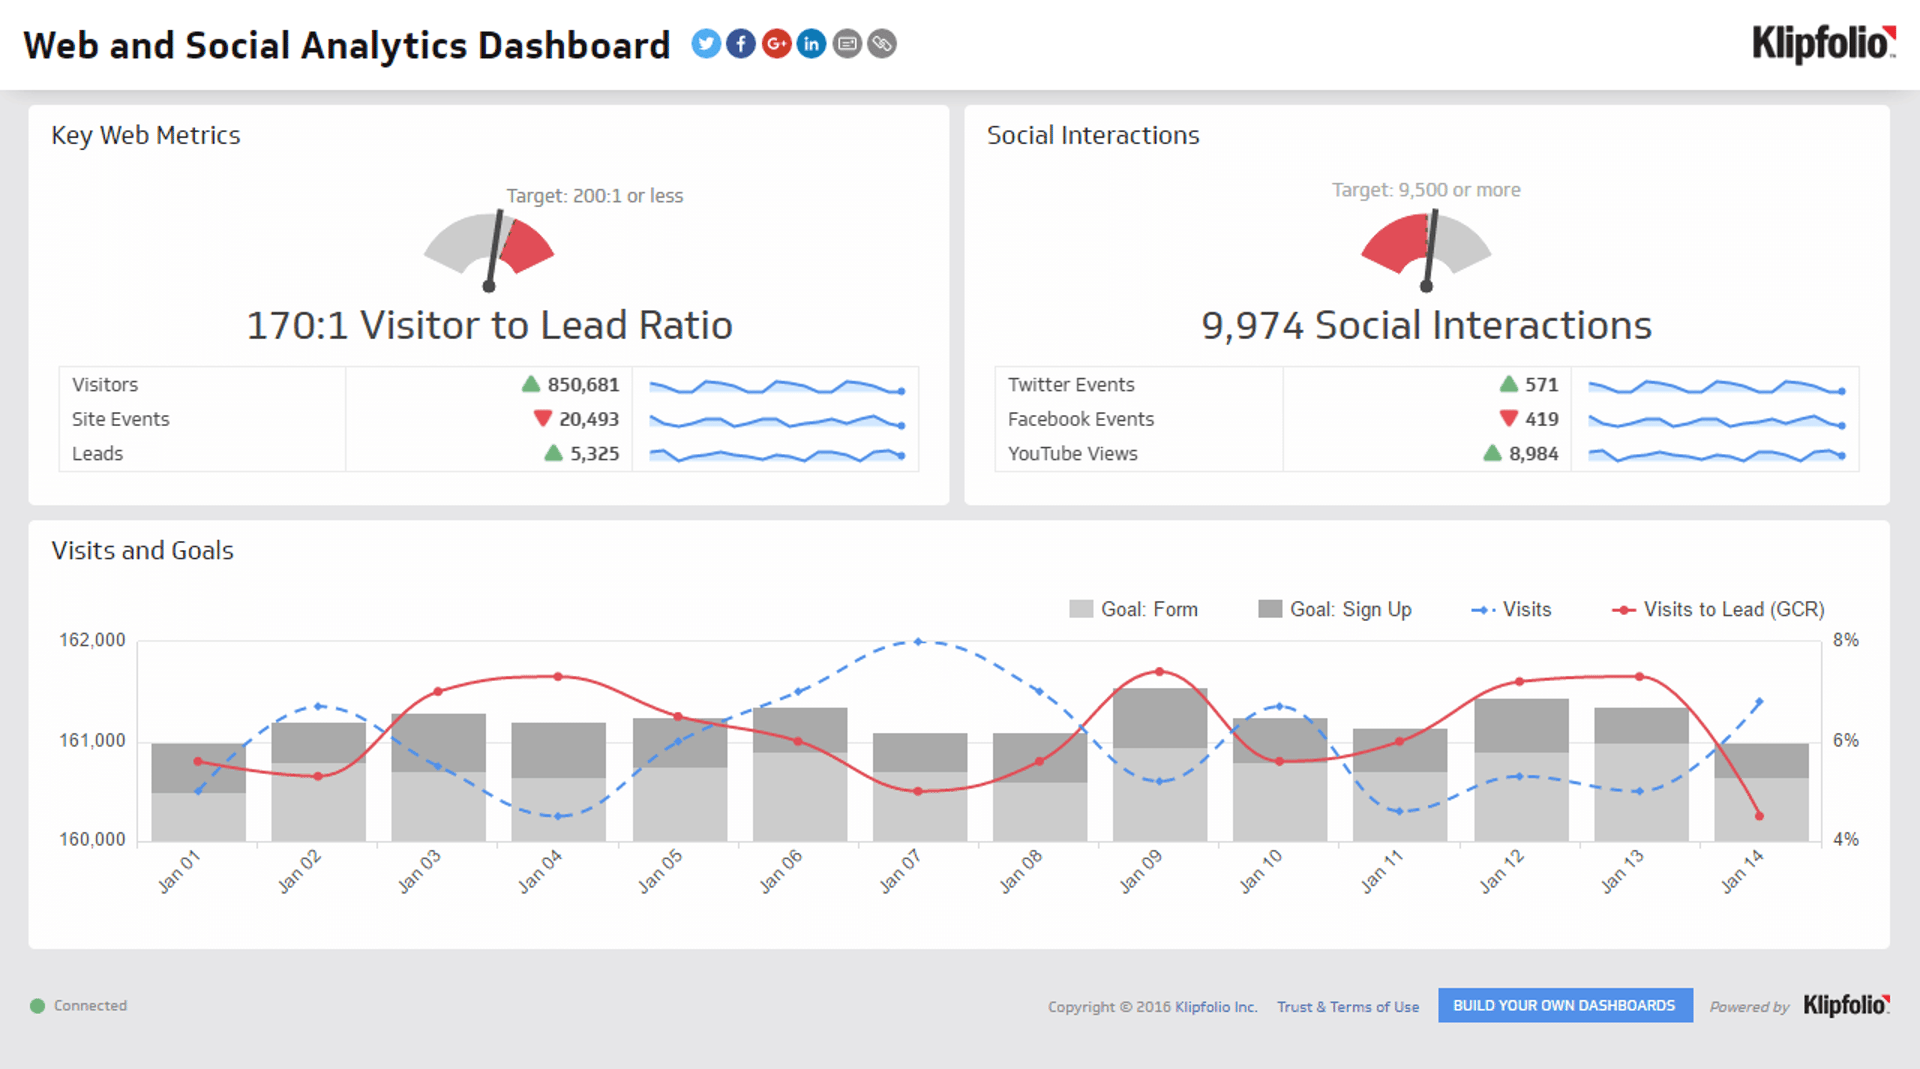
Web and Social Analytics Dashboard
Connect social media engagement to real business results.
Dashboard Example
Lead Generation Dashboard
Track the metrics that matter and turn insights into action.

Dashboard Example
Web Analytics Dashboard
A web analytics dashboard tracks website performance metrics to provide insights needed to optimize site performance, improve engagement, and identify online trends in real time.
Dashboard Example
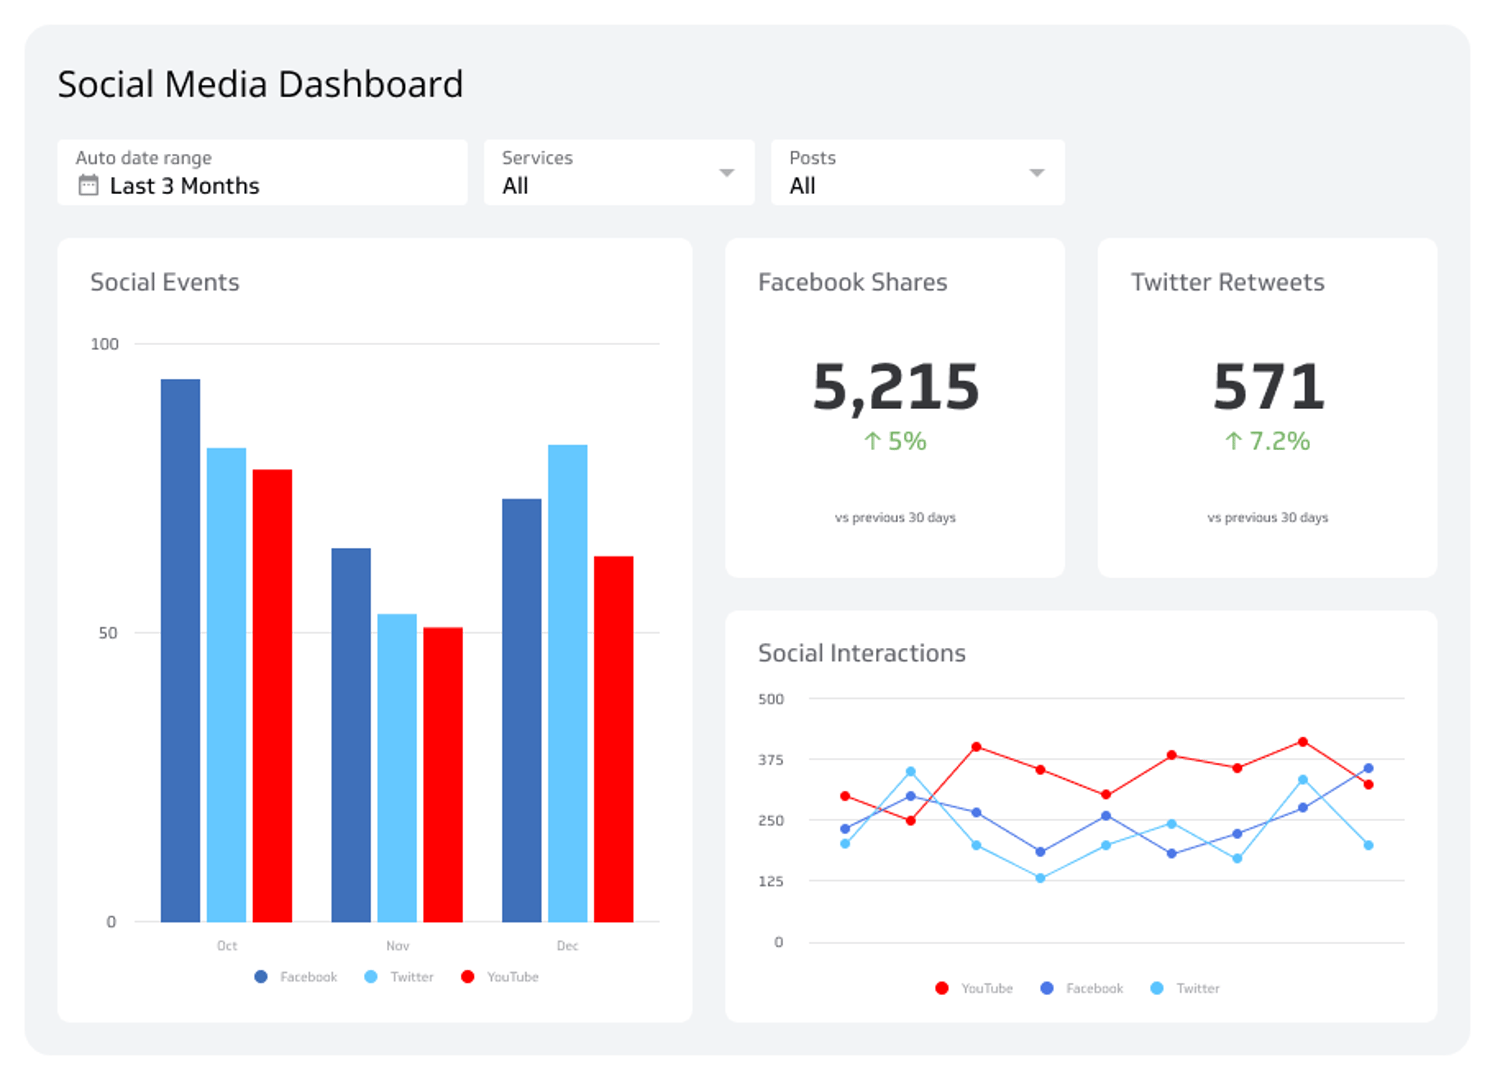
Social Media Dashboard
Use social media analytics to fuel your marketing efforts.
Digital Marketing KPIs
Metrics & KPIs for modern digital marketers
KPI Example
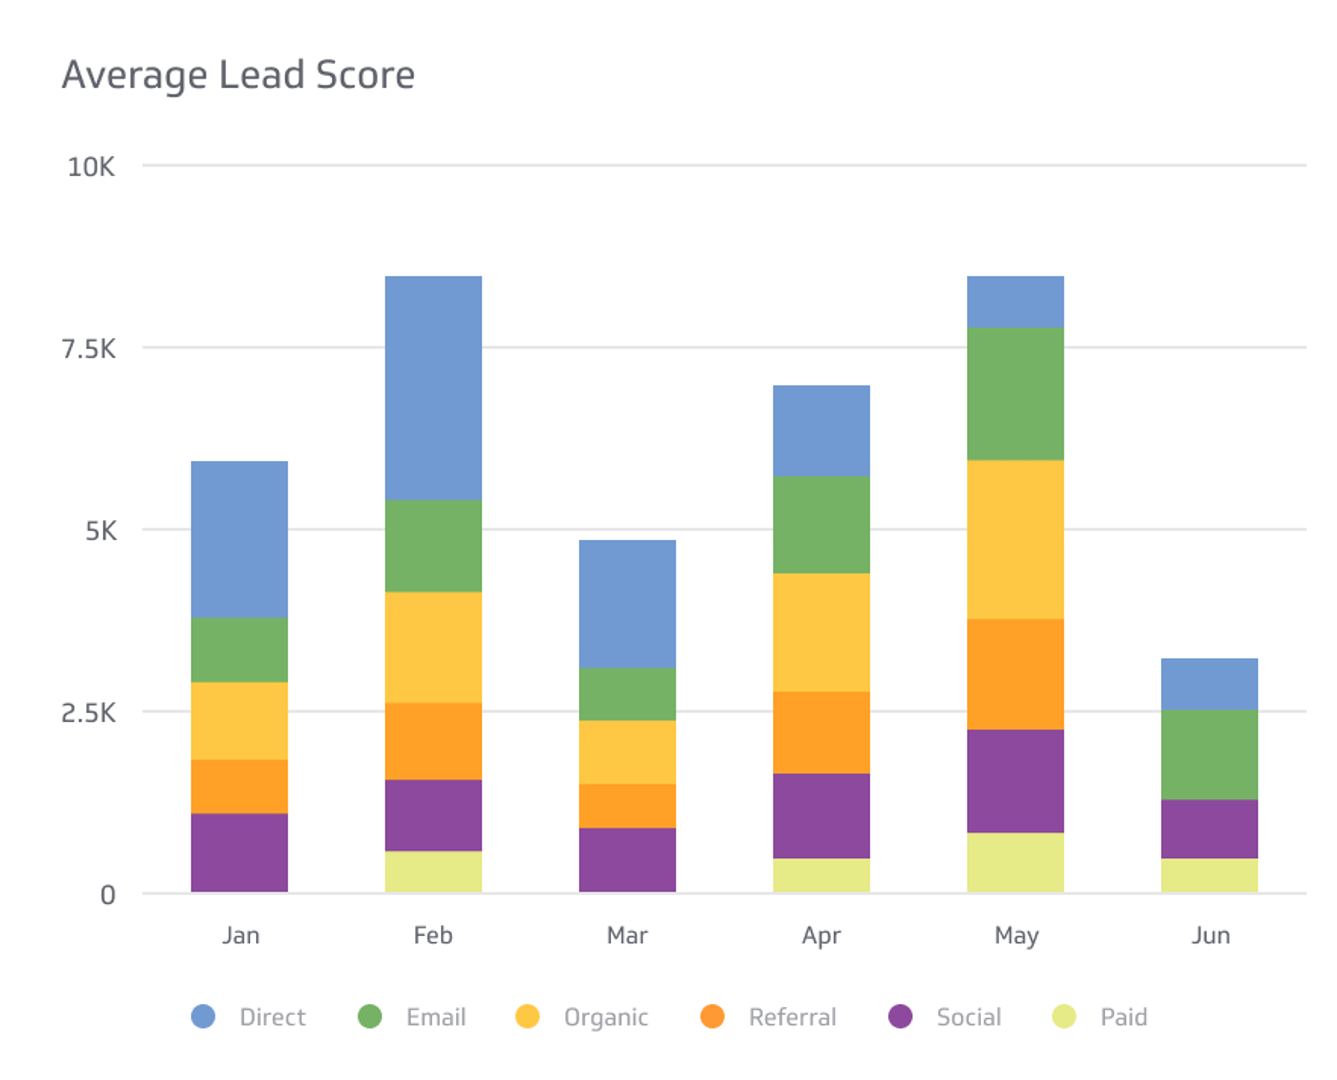
Average Lead Score
Focus on your best leads. It starts with this metric.
KPI Example
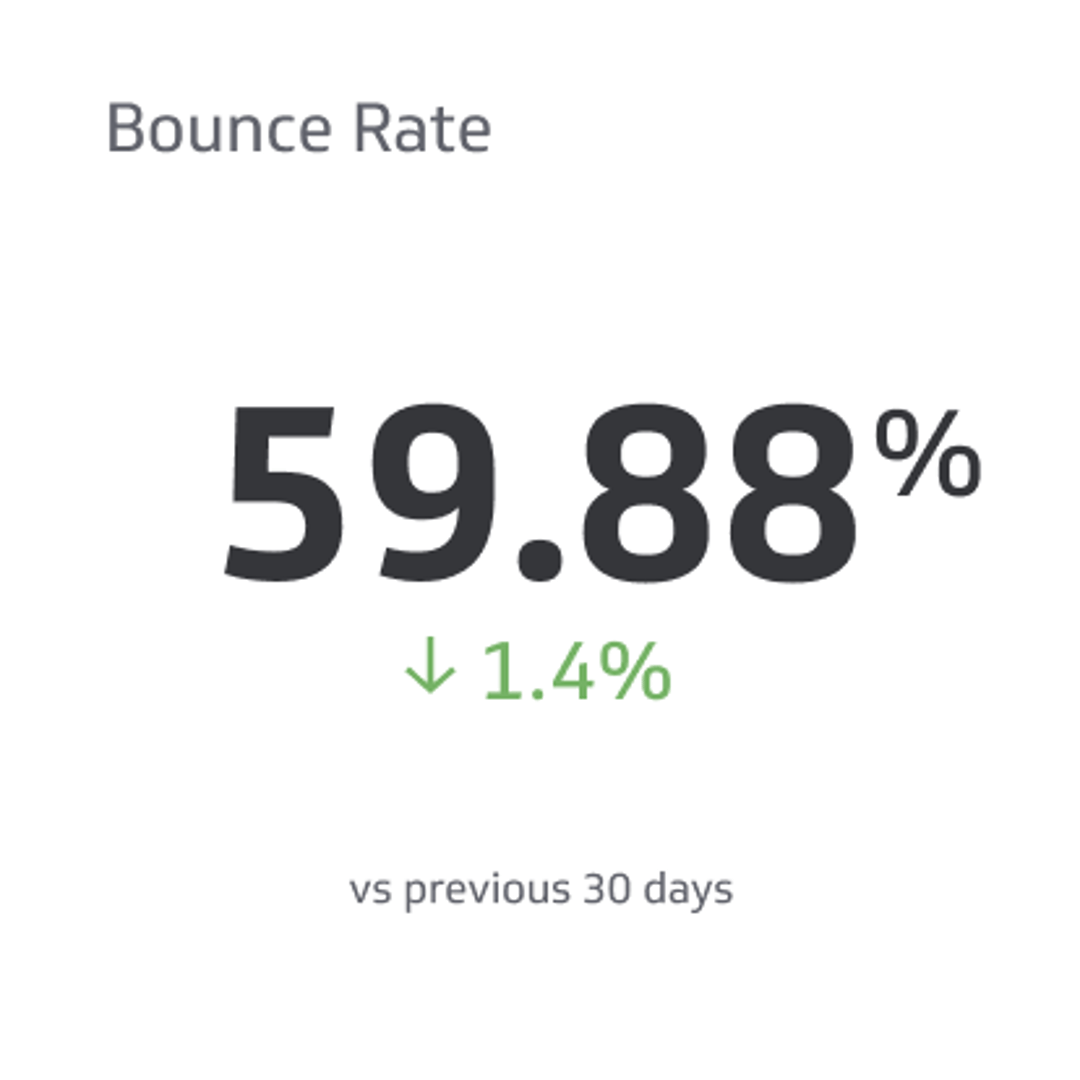
Bounce Rate
The percentage of visitors who leave your website after viewing only one page.
KPI Example
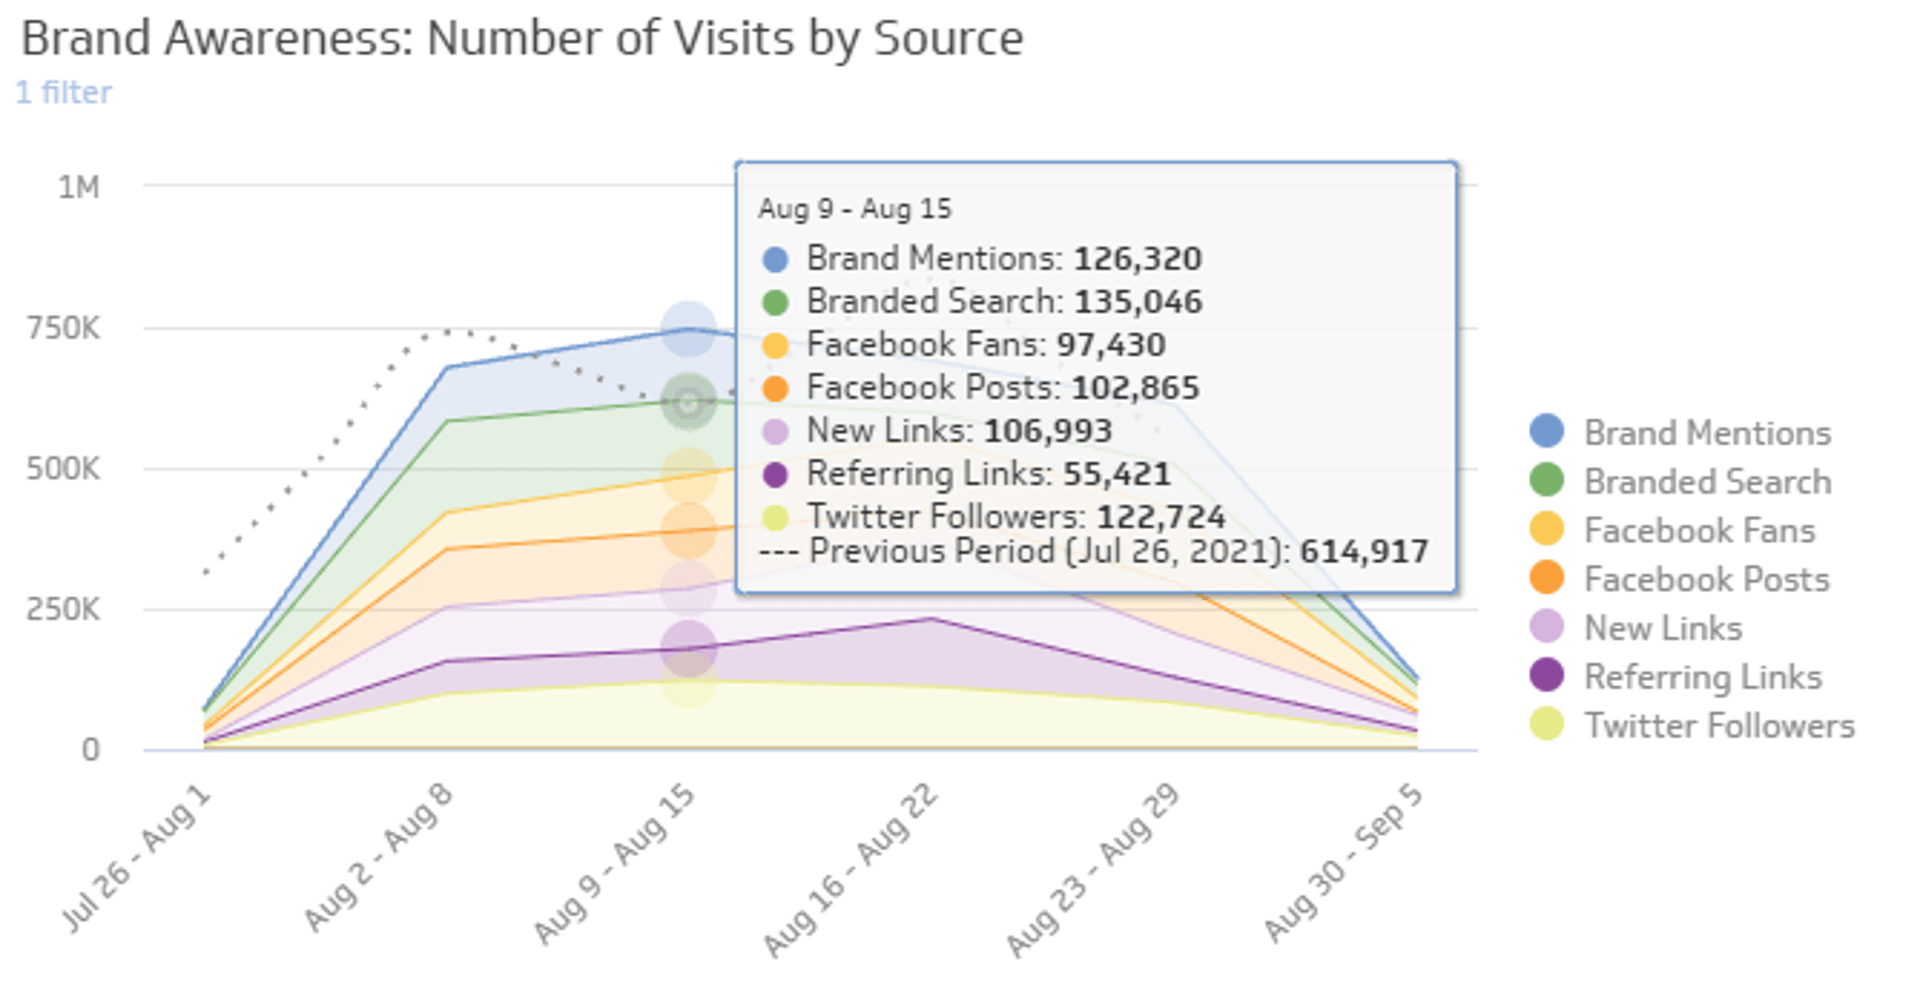
Brand Awareness
How are people hearing about and talking about your brand online?
KPI Example
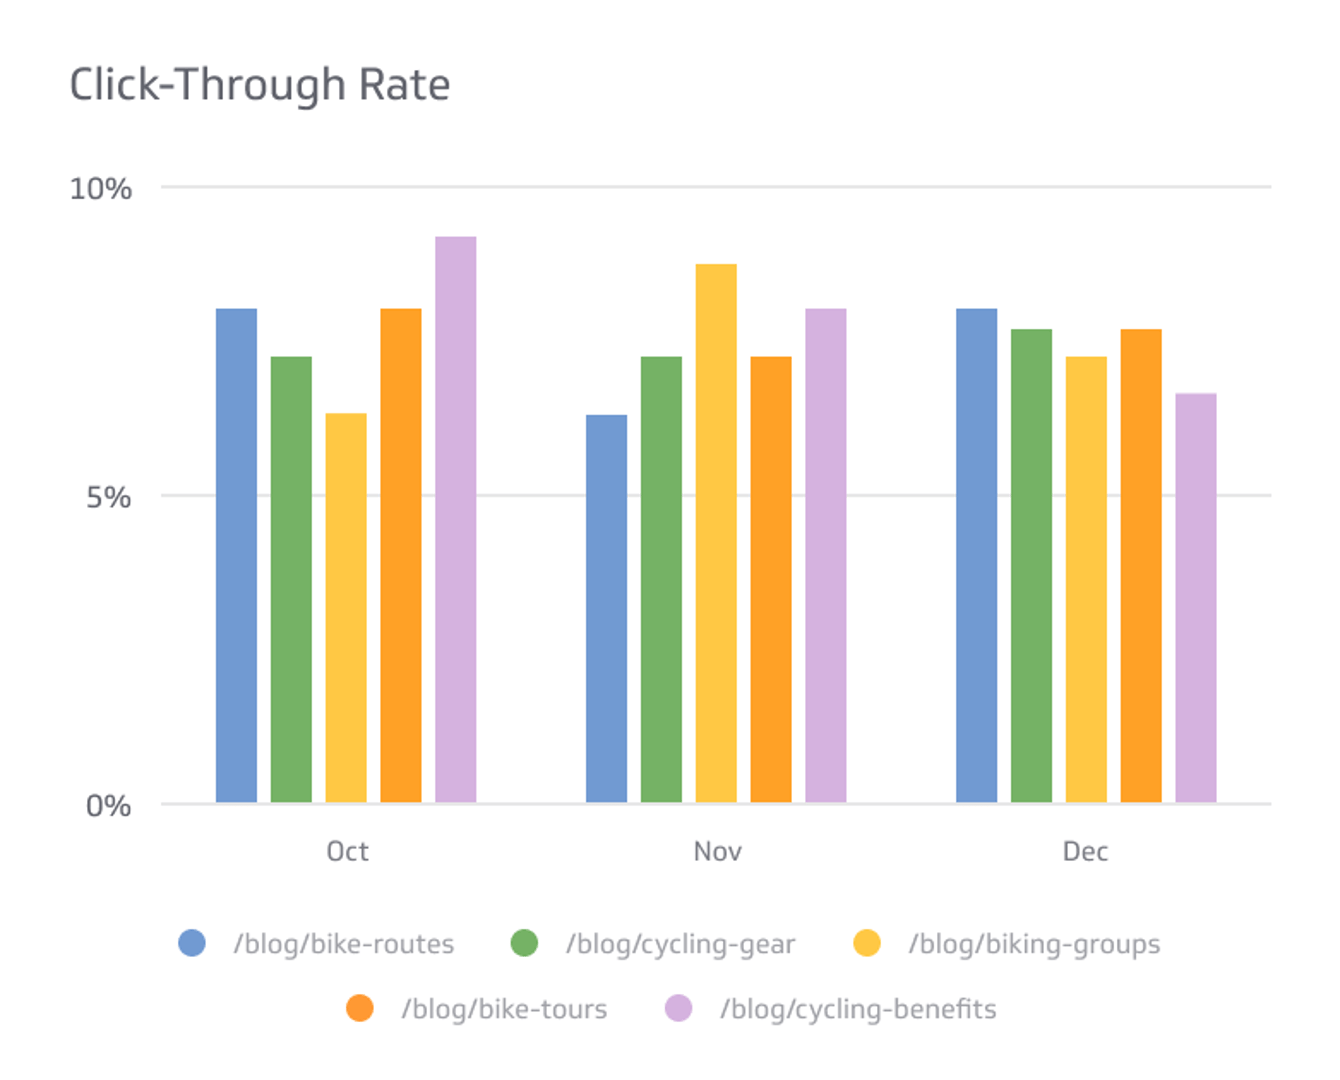
Click Through Rate
Measure how often your site on an SERP prompts users to click and navigate to your page.
Sales Dashboard Examples Dashboards
Sales dashboards show you how effectively your business generates revenue. Study KPIs to grow accounts, retain customers, and identify sales opportunities.
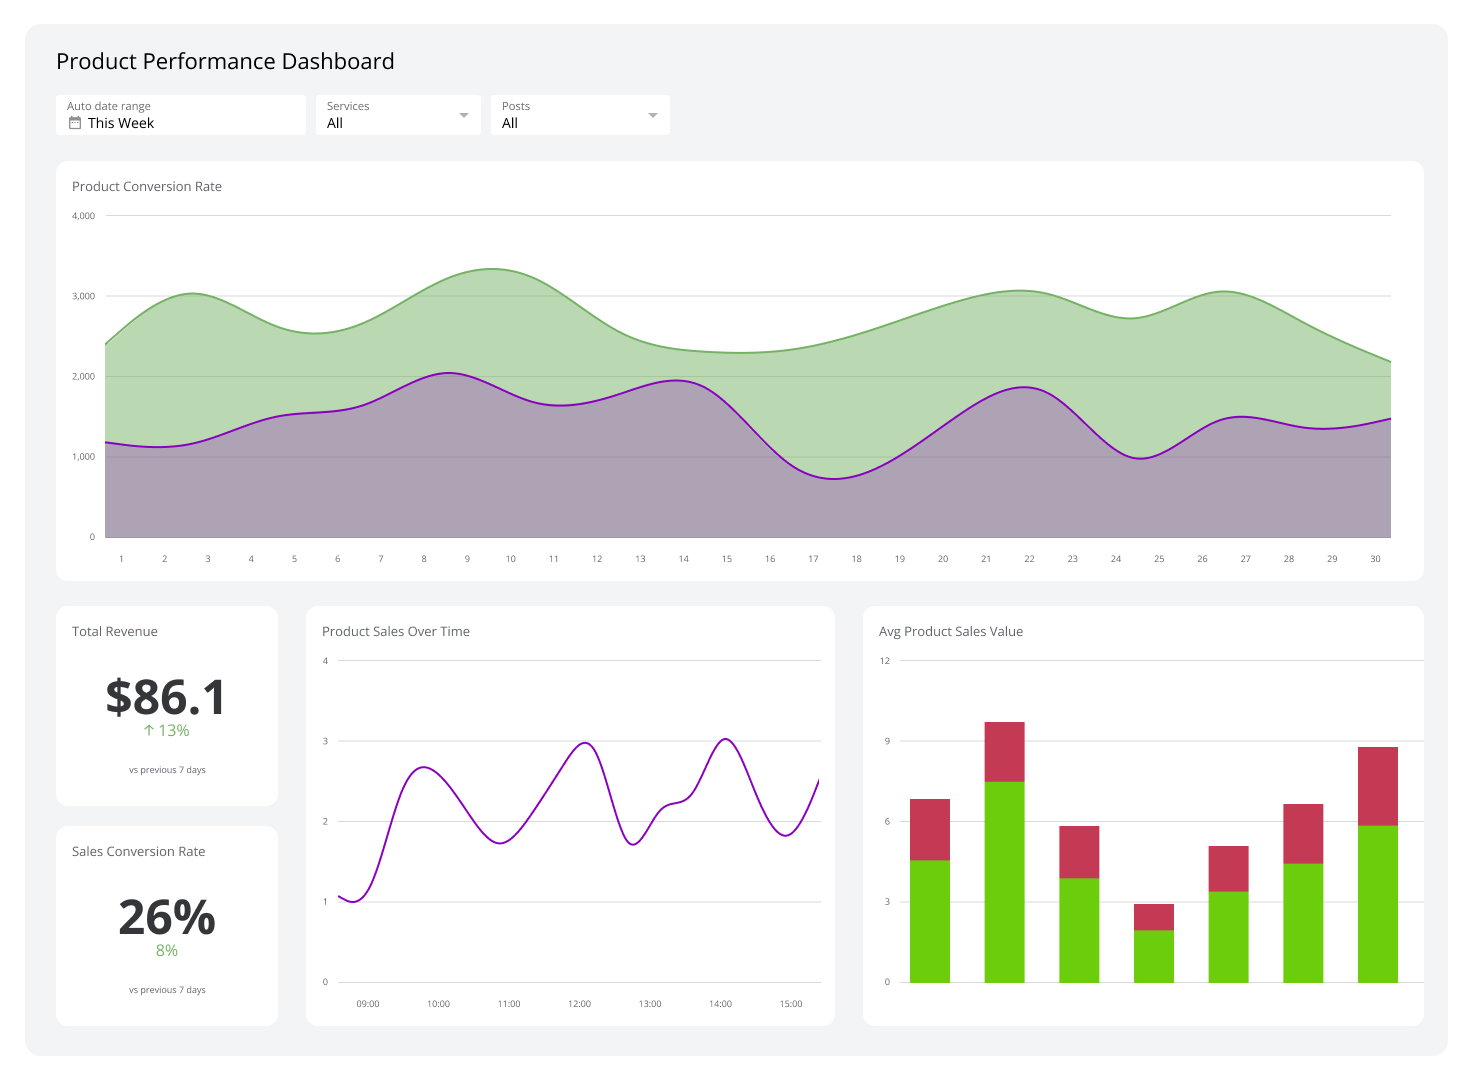
Dashboard Example
Product Performance Dashboard
See product KPIs in one view so you can make faster, smarter calls.

Dashboard Example
Sales KPI Dashboard
Sales KPI dashboards provide a detailed view of your company’s revenue performance through critical KPIs. Their deep insights allow you to diversify your revenue and maximize profitability.
Dashboard Example
Sales Activity Dashboard
Track daily sales tasks, improve productivity, and move more deals through the pipeline.
Dashboard Example
Sales Manager Dashboard
Track pipeline, productivity, and forecast accuracy in one place.
Sales KPIs
Metrics & KPIs for modern sales teams.
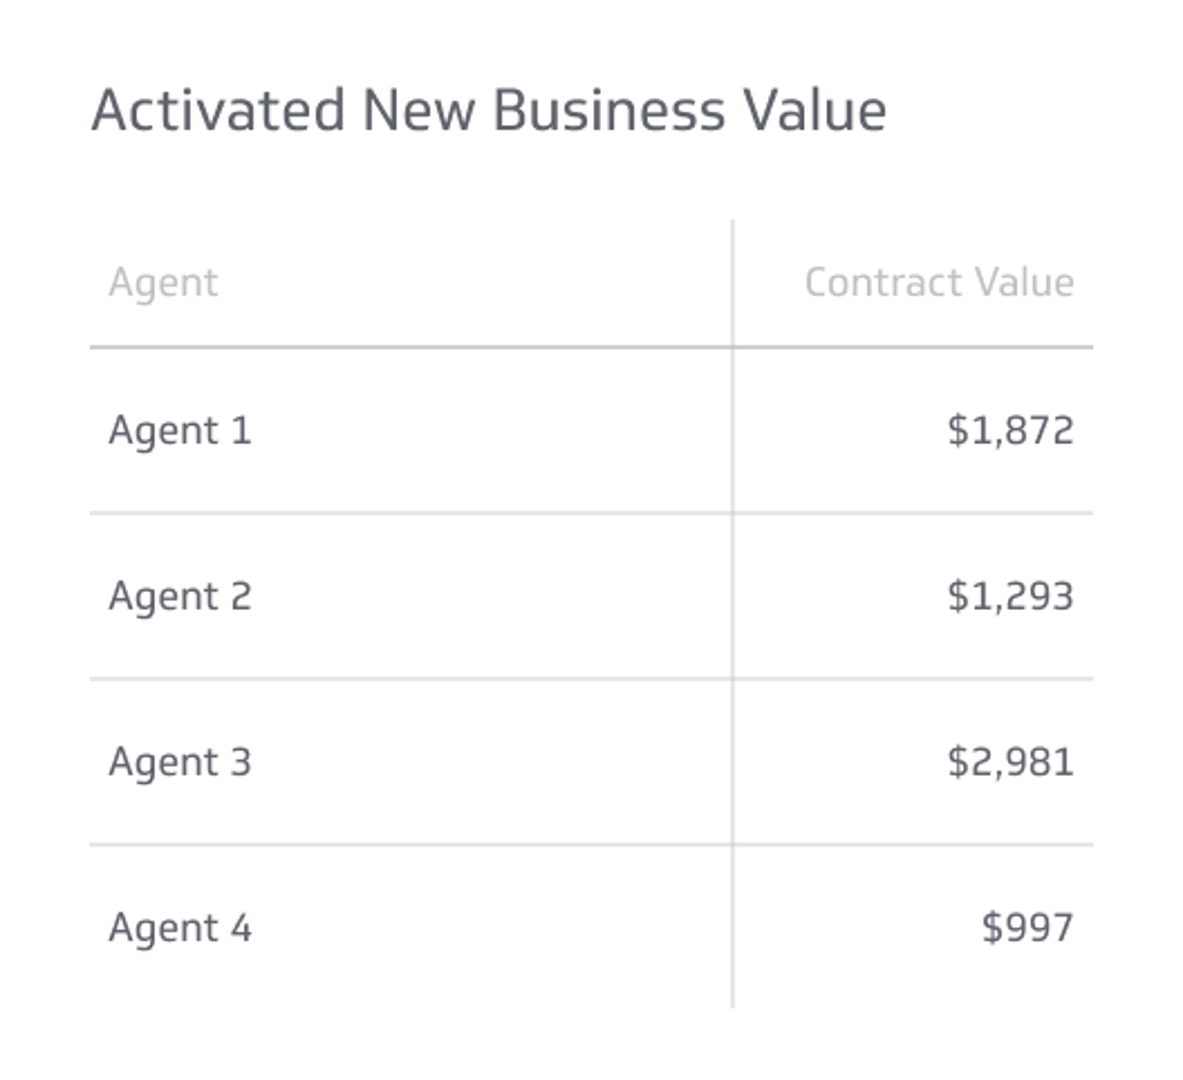
KPI Example
Activated New Business Value
Measure the value of all new business contracts within a specified period of time.
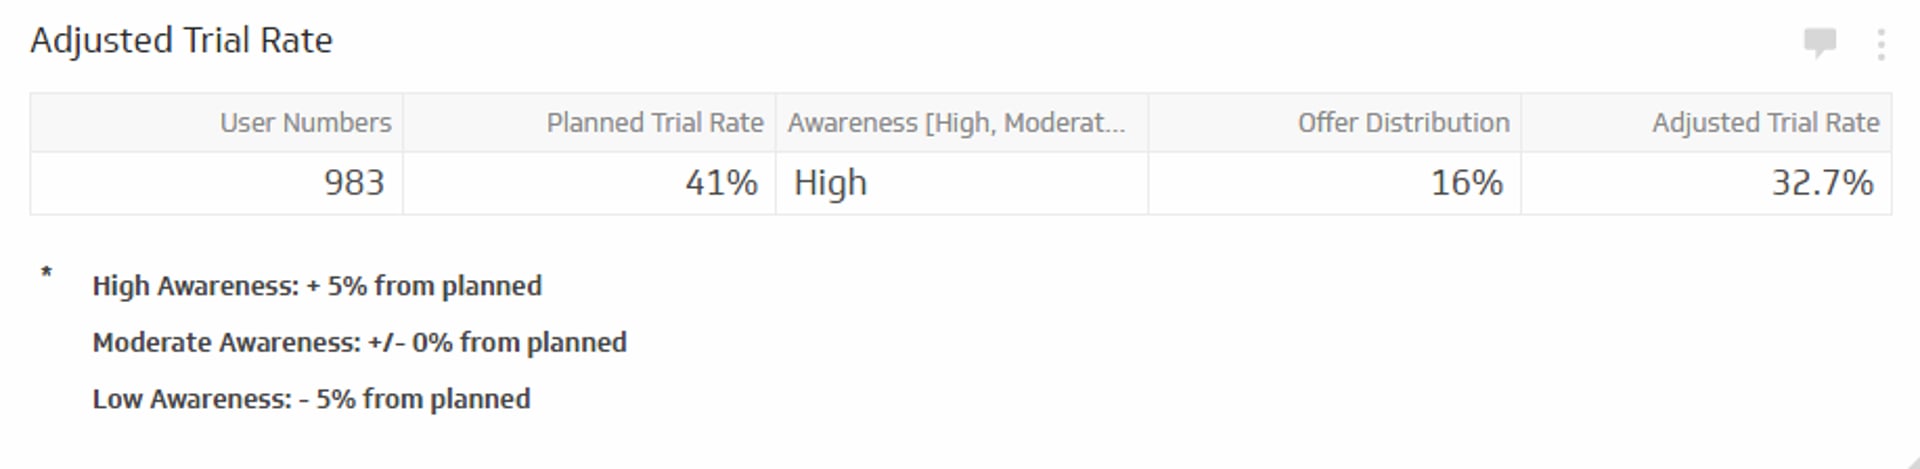
KPI Example
Adjusted Trial Rate
Measure and adjust the initial estimated trial rates to take into account company awareness and the total product distribution.
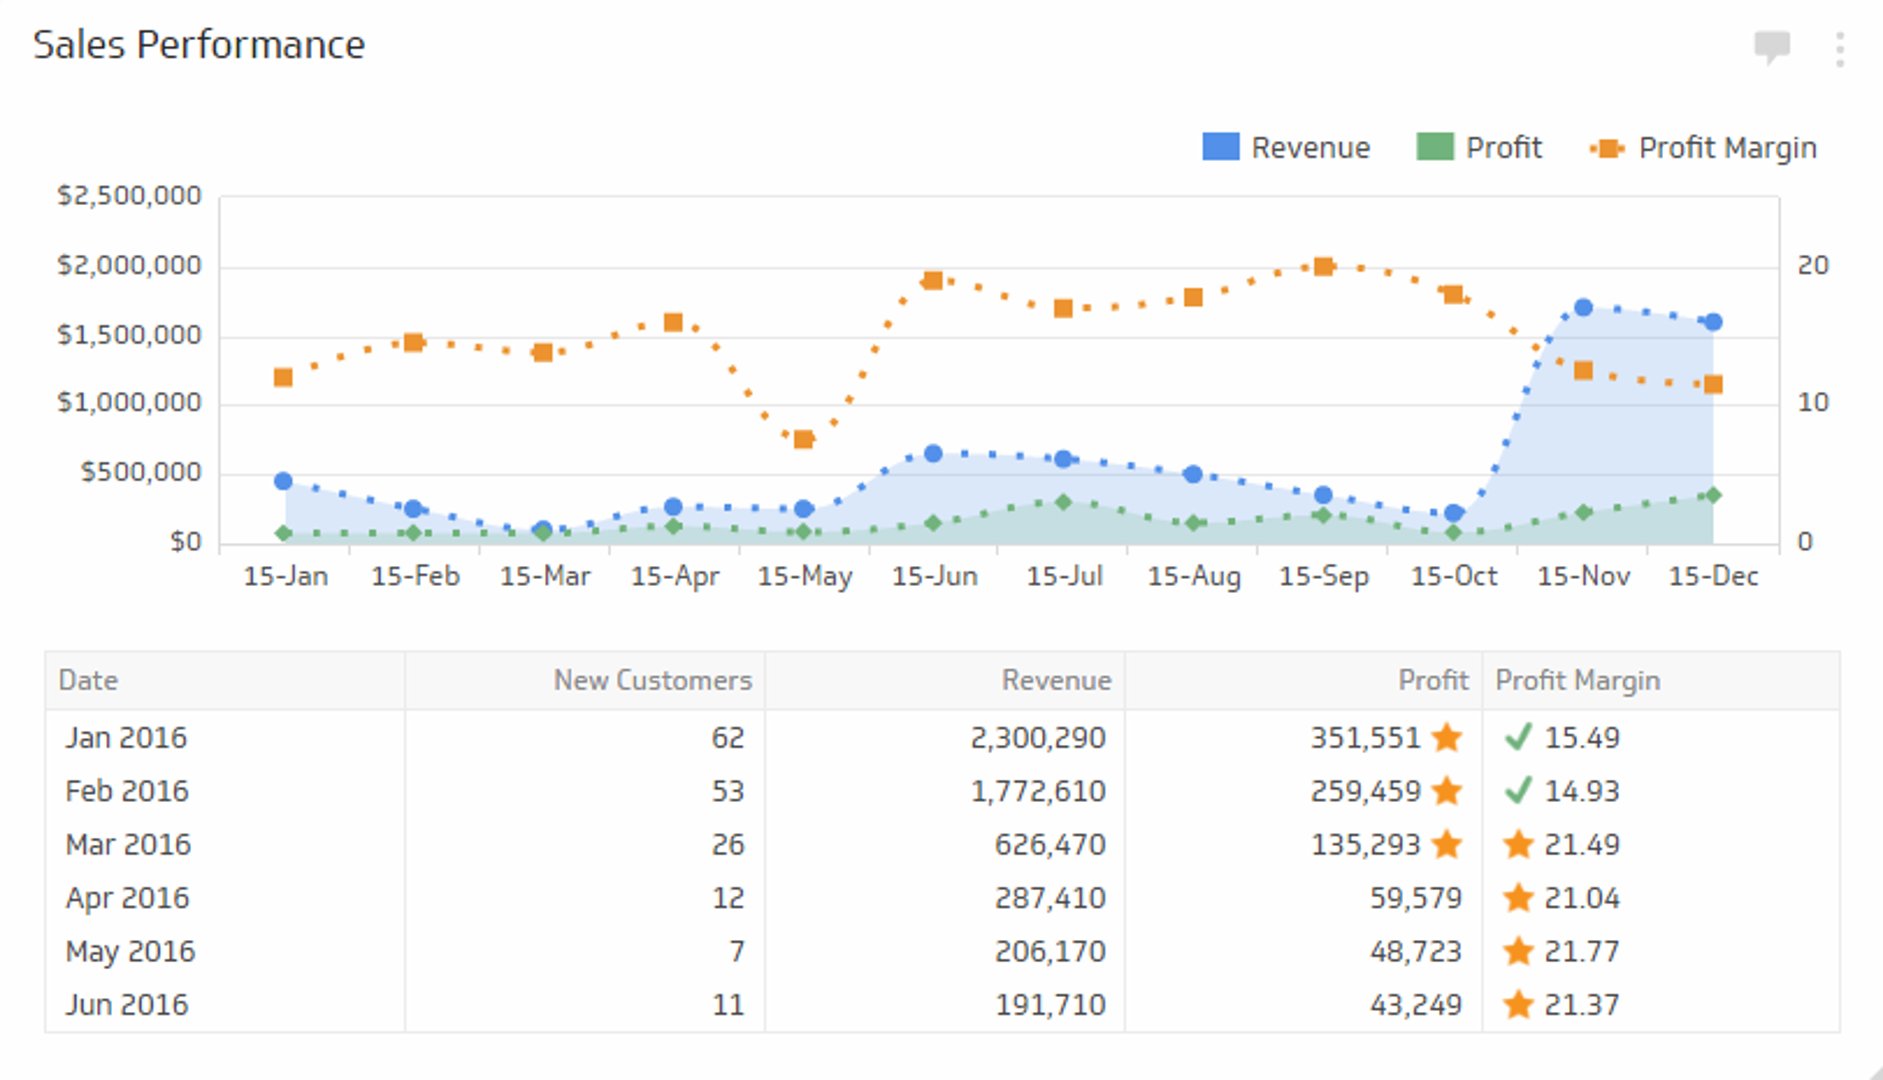
KPI Example
Average Profit Margin
Measures the average profit generated from the sale of a specific service, product or product/service category.
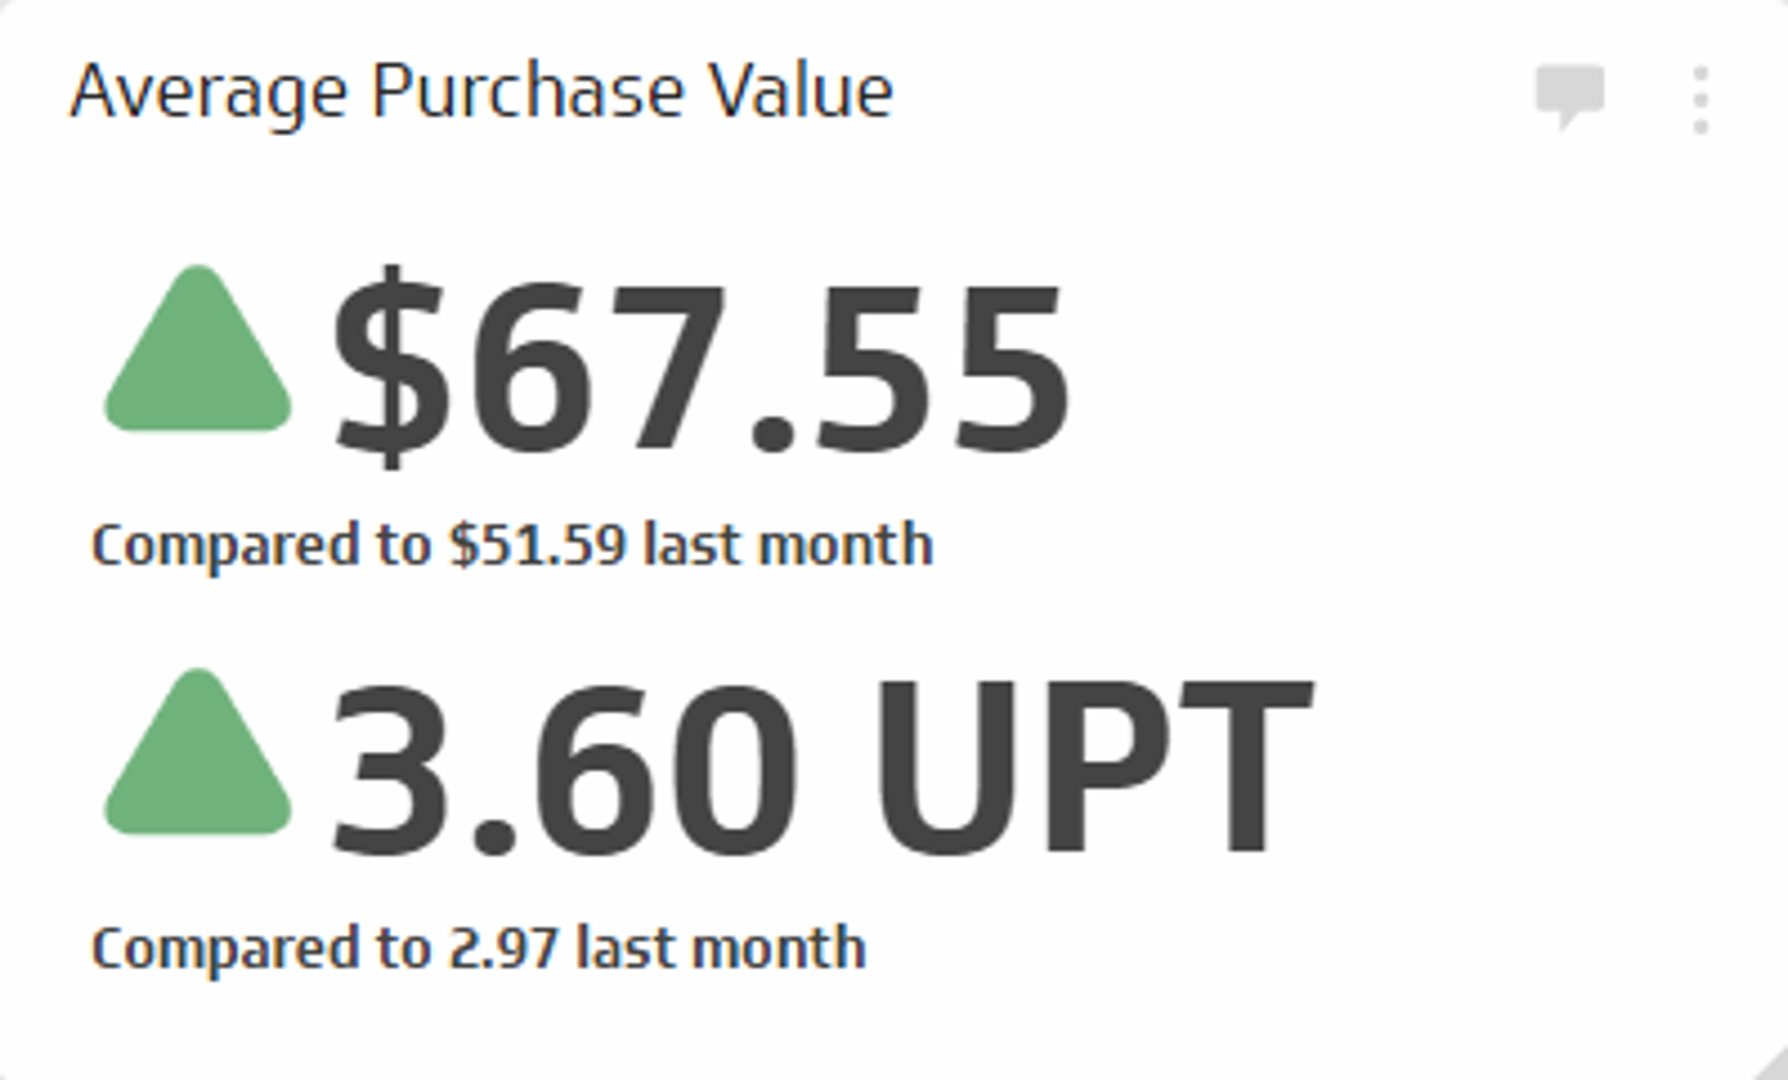
KPI Example
Average Purchase Value
Measure the average sales value of each transaction using this sales metric.