Pingdom Check History Metrics Metric
Track the history of your website's performance and up-time with the Pingdom check history metrics
Track all your DevOps KPIs in one place
Sign up for a 14-day free trial and start making decisions for your business with confidence.
Overview
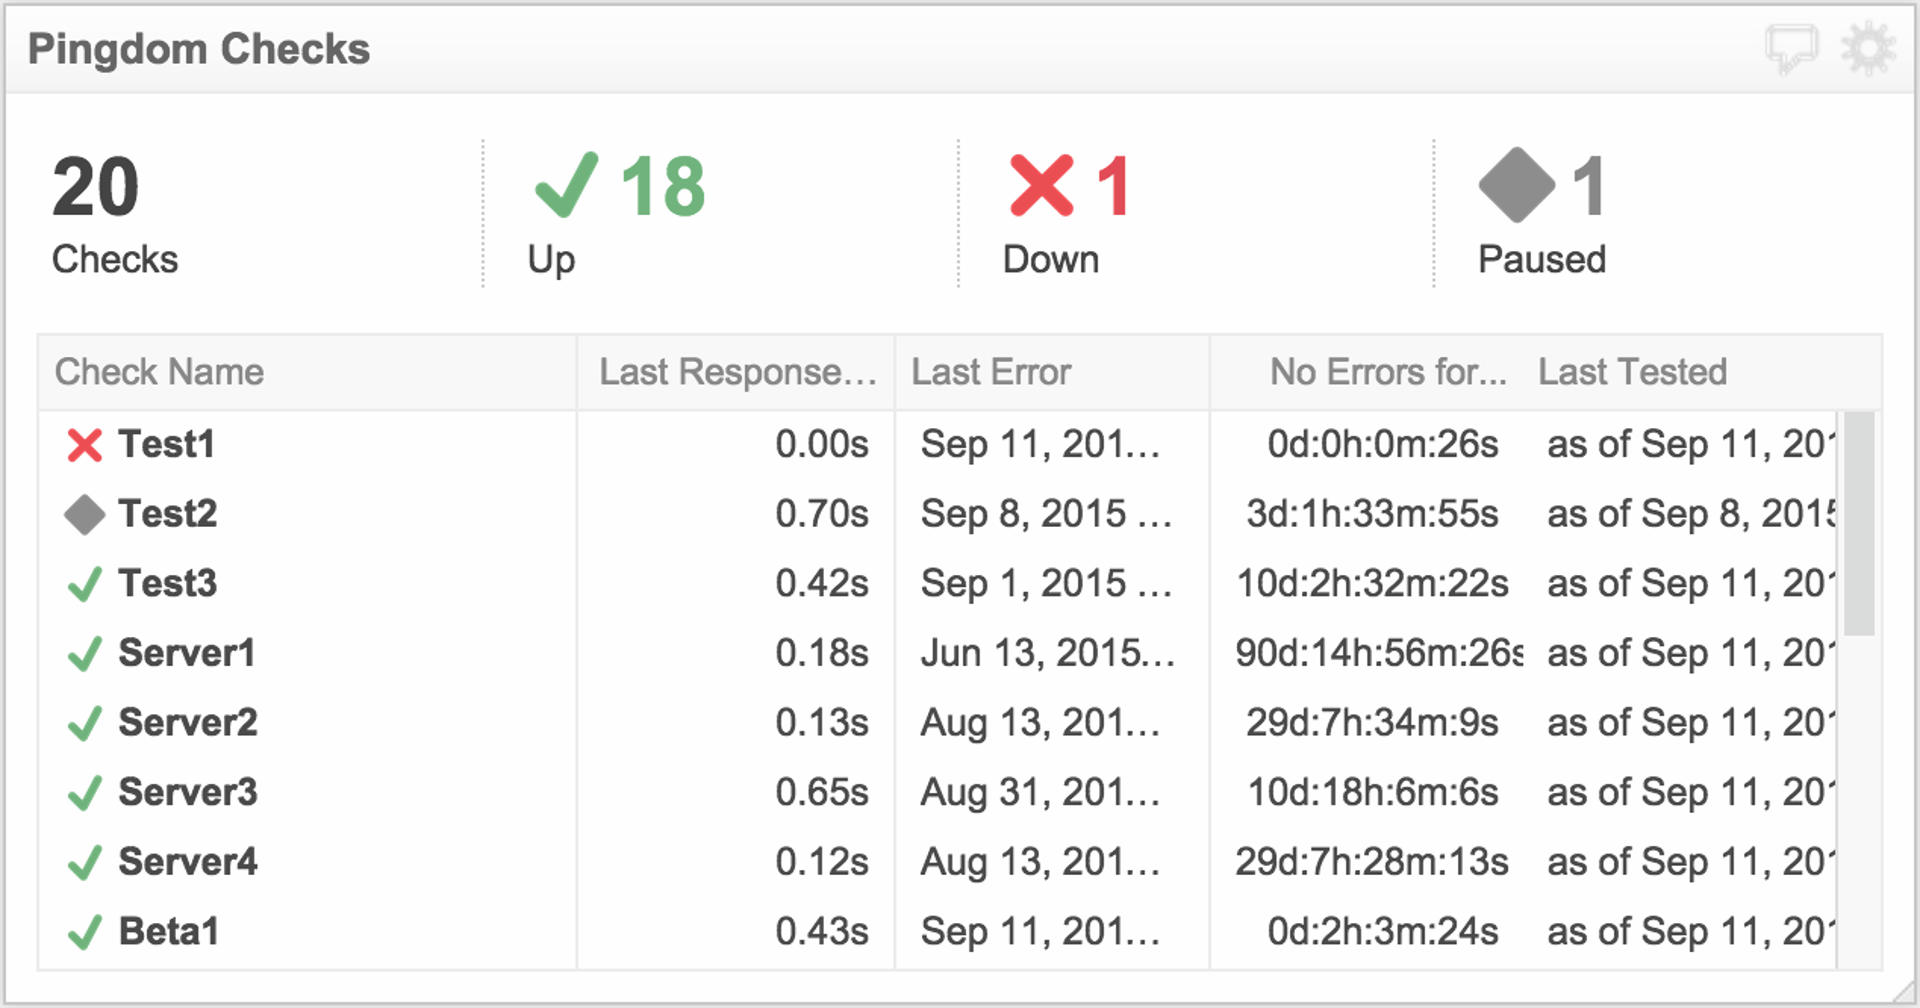
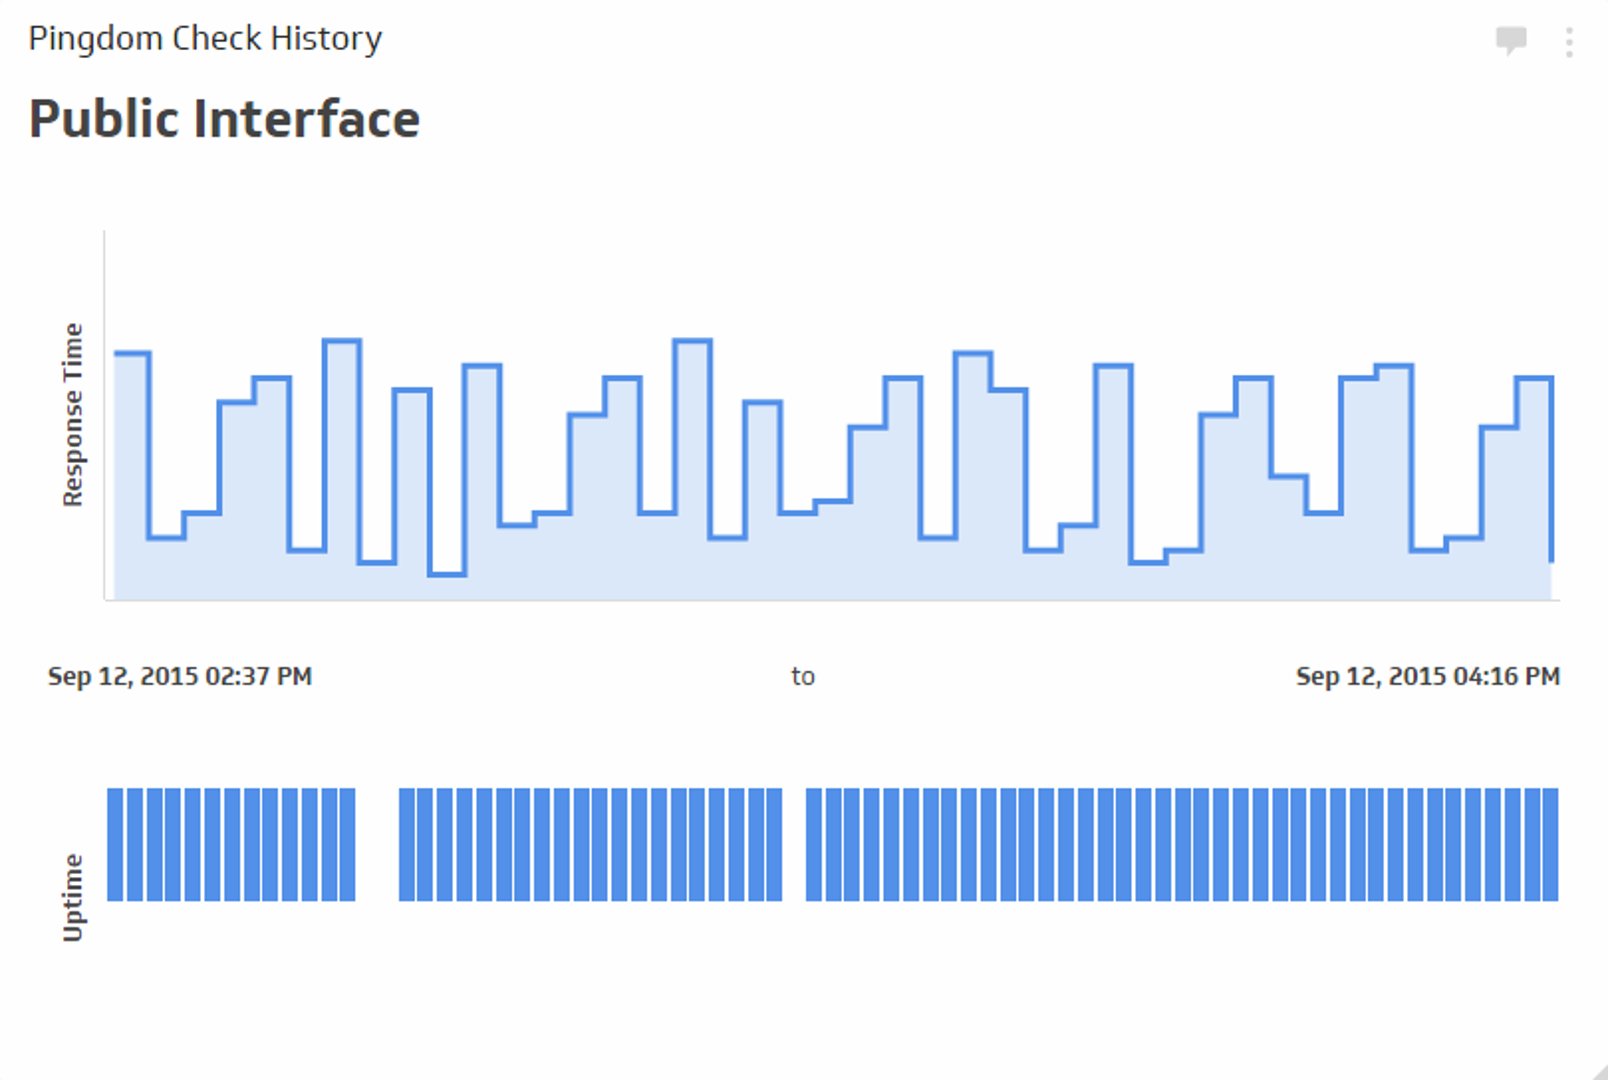
The Pingdom Check History metric displays a historical glance of uptime and response time for your website. The Pingdom check history metric gives the DevOps team and the organization a real-time view of website performance over the past few hours. With this metric, you can keep a close eye on the trend in response time and uptime to improve user experience.
Key terms
- Response Tme: The time it takes for your website and webpages to load for users
- Uptime: The time in which your website is operational
Success indicators
- Quick response times show a fast and user friendly website
- Consistent uptime which indicates a smooth website experience with no downtime for users
Monitoring DevOps KPIs on a Dashboard
Once you have established benchmarks and targets for Pingdom Check History, you’ll want to establish processes for monitoring this and other DevOps KPIs. Dashboards can be critical in this regard. Read more
Related Metrics & KPIs