Pingdom Checks Metrics Metric
Measure the performance and up-time of your website with the Pingdom checks metrics
Track all your DevOps KPIs in one place
Sign up for a 14-day free trial and start making decisions for your business with confidence.
Overview
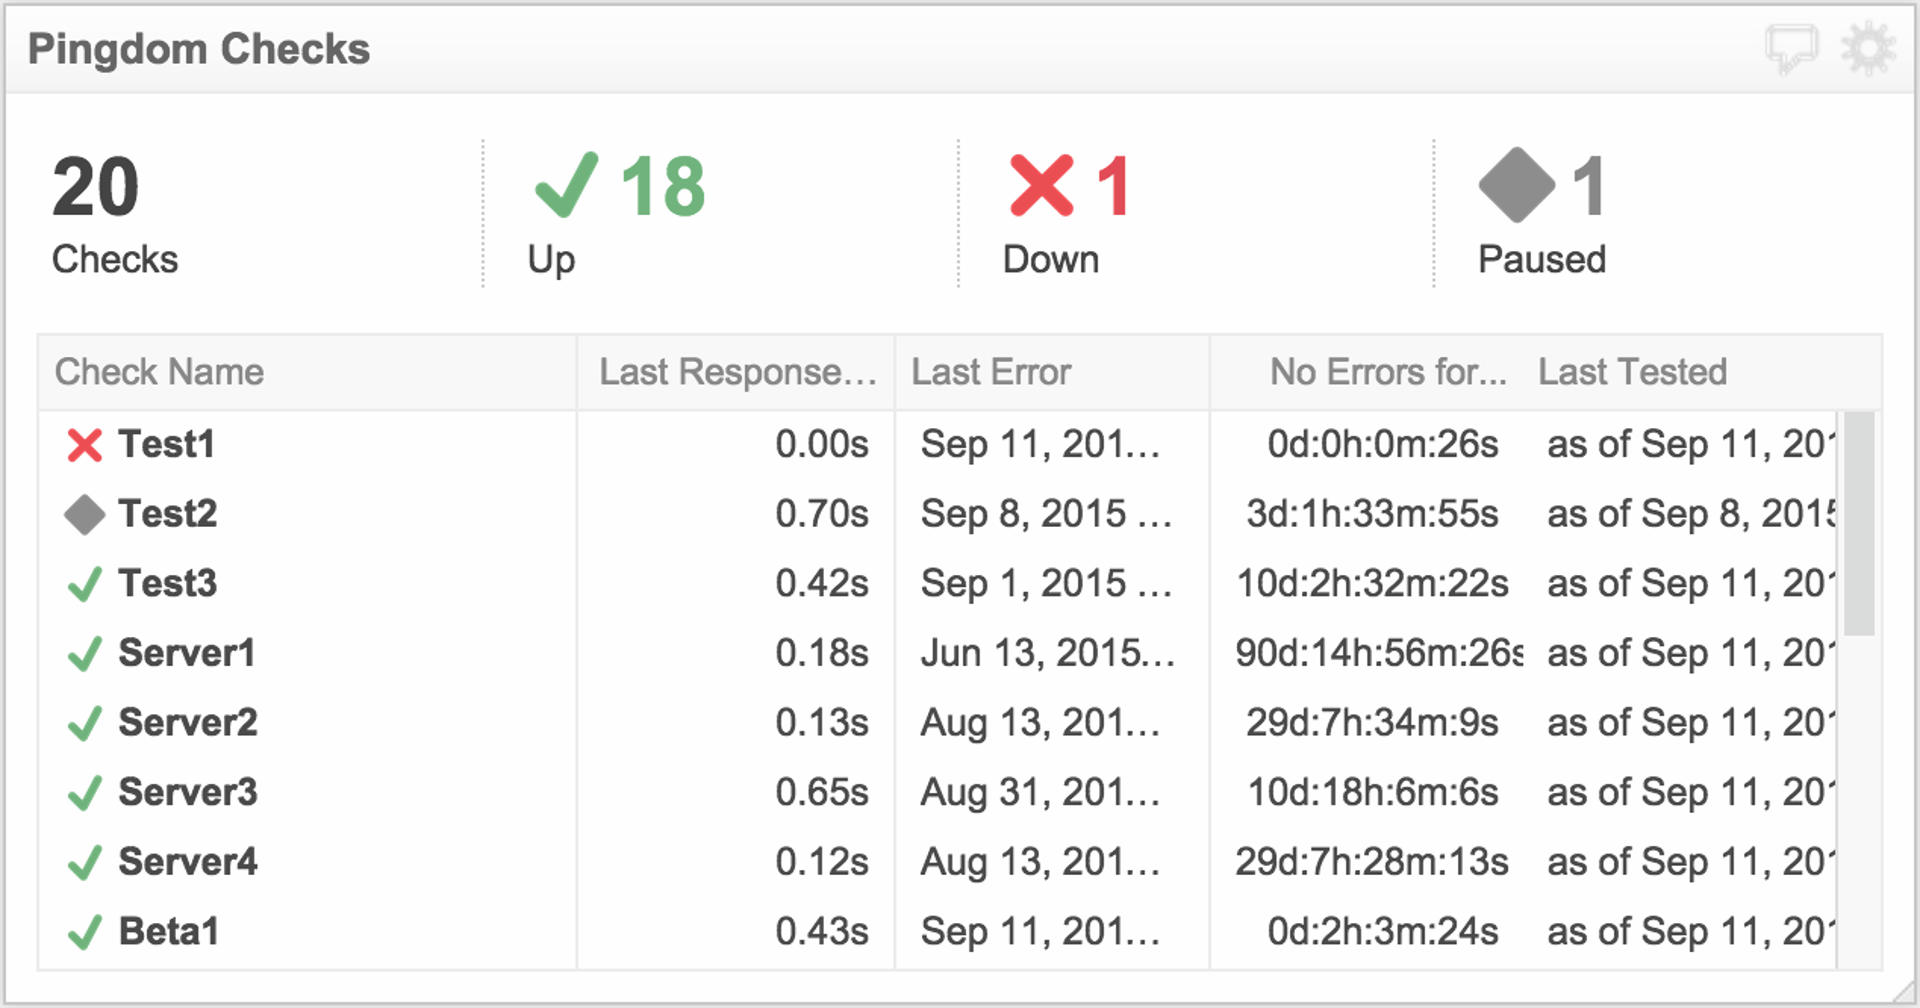
The Pingdom Checks metric displays the number of server checks that have occurred and shows how many of those server checks are up, down, and paused. The Pingdom checks metric gives the DevOps team and the organization a real-time view of website performance. With this metric, you can easily measure the performance of your servers and ensure users have quick website response times.
Key terms
- Checks: The total number of server checks
- Up: The number of servers that have gone through the check and are working properly
- Down: The number of servers that have been tested and are not working properly
- Paused: The number of servers that have been tested and have been paused.
Success indicators
- The number of checks and number of servers up are the same
Monitoring DevOps KPIs on a Dashboard
Once you have established benchmarks and targets for Pingdom Checks, you’ll want to establish processes for monitoring this and other DevOps KPIs. Dashboards can be critical in this regard. Read more
Related Metrics & KPIs