Pingdom Last Error Metric Metric
Measure the performance of your website with the Pingdom last error metrics
Track all your DevOps KPIs in one place
Sign up for a 14-day free trial and start making decisions for your business with confidence.
Sign up with Google
or
Sign up with your emailFree for 14 days ● No credit card required
Overview
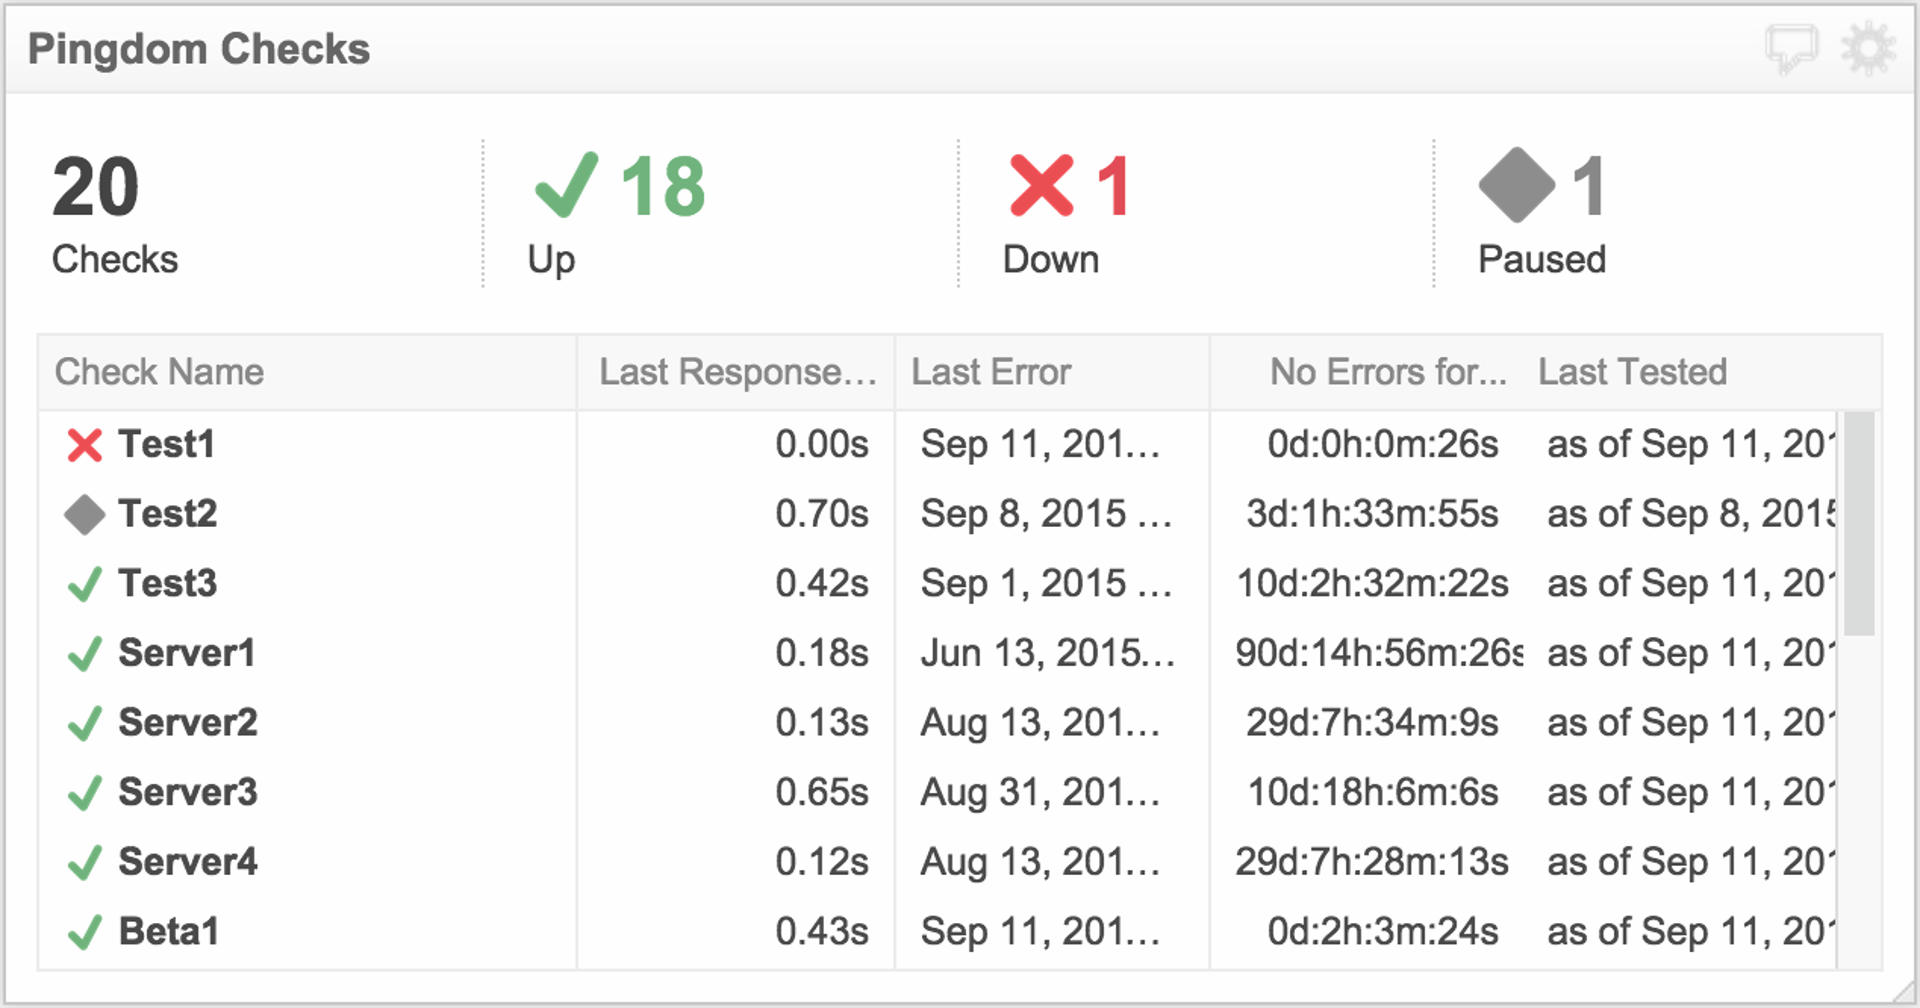
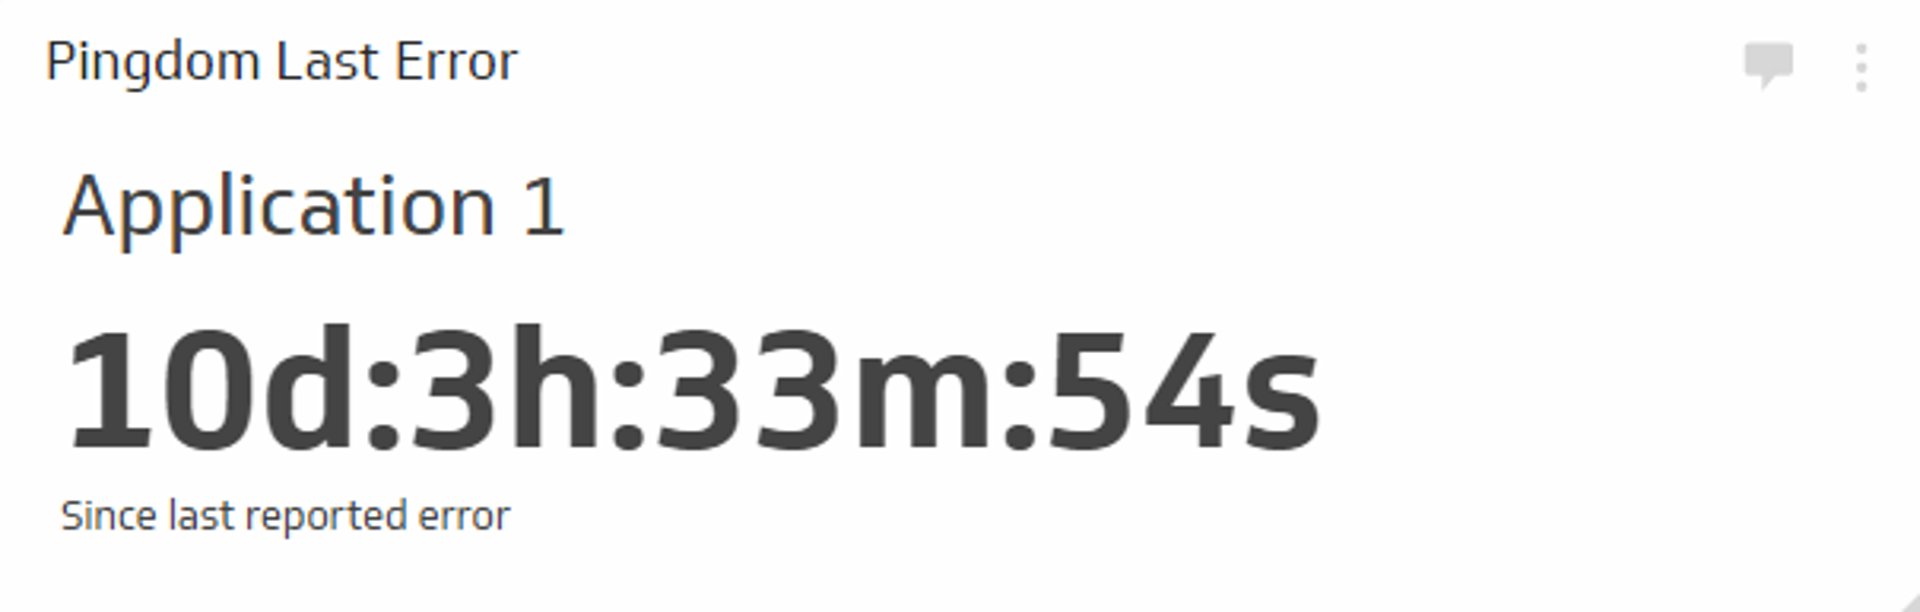
The Pingdom Last Error metric displays the time that has passed since your last recorded Pingdom error. This metric will keep both your DevOps and company fully informed of your website performance and how your servers have been testing in Pingdom. Keep track of your Pingdom last error and ensure your application is fully performing.
Key terms
- Error: Server went down and was flagged by Pingdom
Success indicators
- The more time since your last Pingdom error will represent a well-performing website with no down-time for users.
Monitoring DevOps KPIs on a Dashboard
Once you have established benchmarks and targets for your Last Pingdom Error, you’ll want to establish processes for monitoring this and other DevOps KPIs. Dashboards can be critical in this regard. Read more
Related Metrics & KPIs