Inventory Turnover Ratio Metric
Measures how often you are able to sell off your in-stock inventory in a given year.
Track all your Financial KPIs in one place
Sign up for a 14-day free trial and start making decisions for your business with confidence.
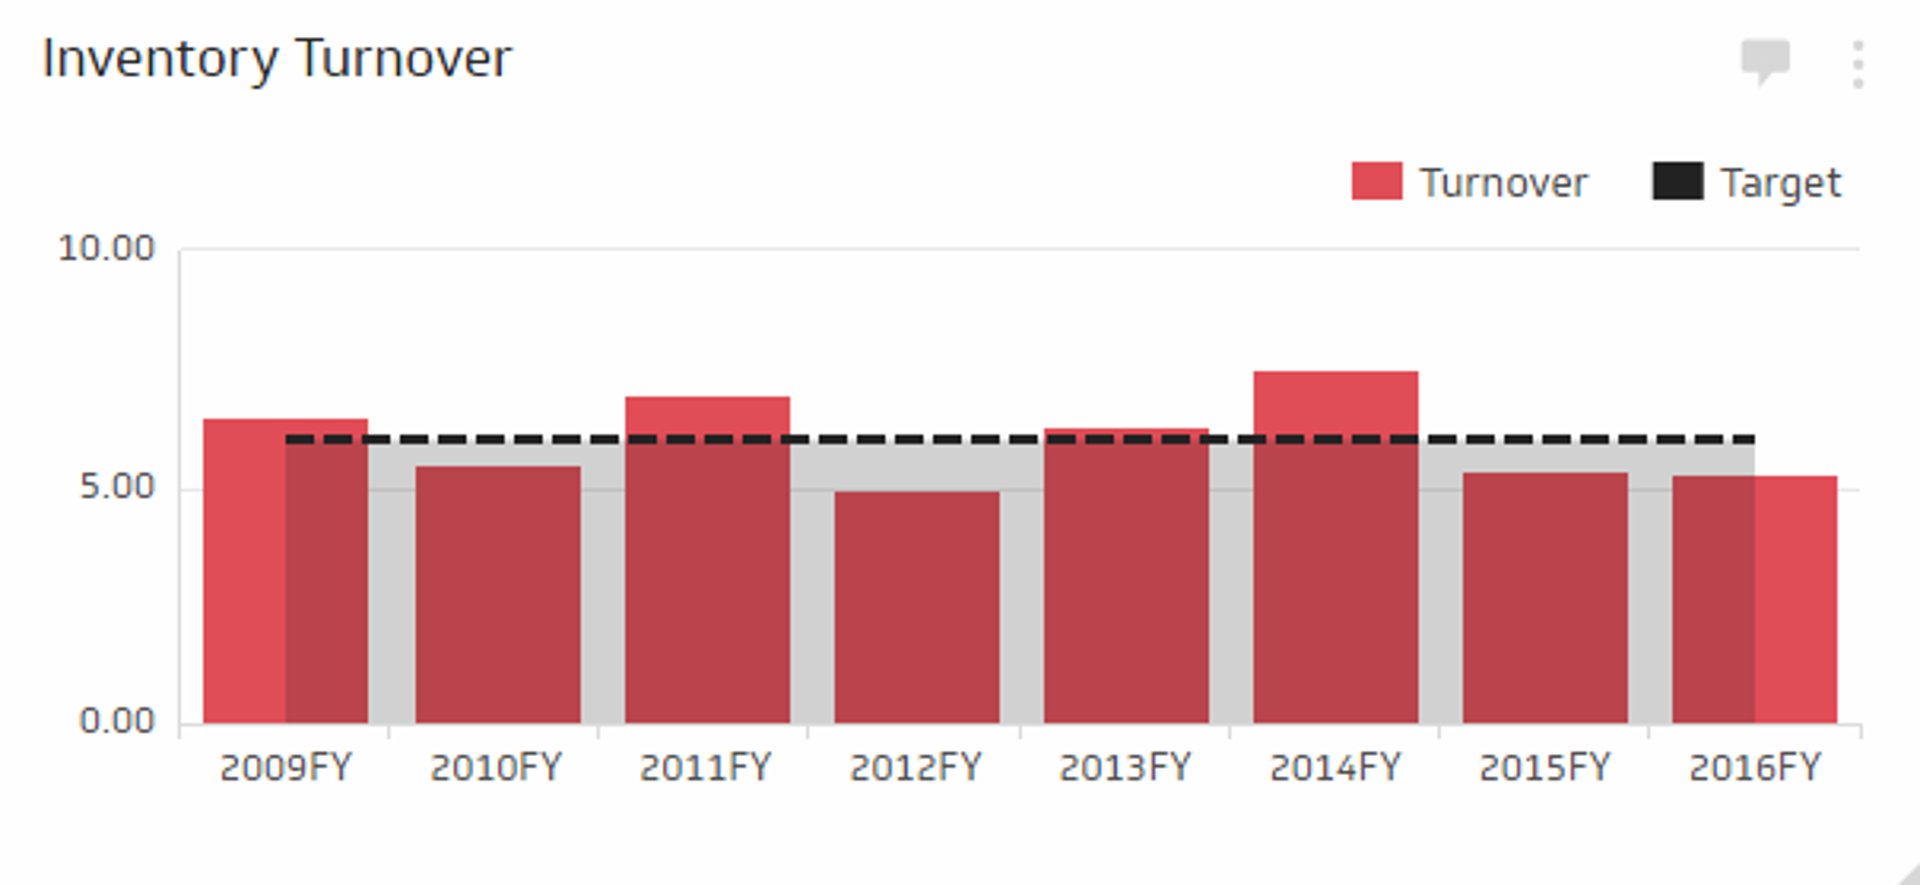
The Inventory Turnover is a KPI that measures how often, in a given time-period, your organization is able to sell its entire inventory. Inventory Turnover is an important efficiency metric and is helpful in analyzing pricing, product demand, and, of course, inventory purchase and costs. It is also a critical tool when selling perishable goods, where the potential for waste is high. Generally speaking, a higher Inventory Turnover rate is better, while a lower Inventory Turnover rate suggests inefficiency and difficulty turning stock into revenue. Each type of industry will have different benchmarks and norms.
Formula
Inventory turnover ratio = (Cost of Goods Sold) / ((Beginning Inventory Value + Ending Inventory Value) / 2)
Note: The COGS amount is found on the Income Statement and the Inventory Value on the Balance Sheet.
Example of Inventory Turnover Ratio
If a clothing retailer generates $1M in sales each month, with $400K in Costs of Goods Sold (COGS), and the start of the month inventory was valued at $45K and closed at $55K:
- Using the Sales method, Inventory Turnover = $1M / (( $45K + $55K ) / 2 ) = 20X per month
- Using the COGS method, Inventory Turnover = $400 / (( $45K + $55K ) / 2 ) = 8X per month
Related Metrics & KPIs