5 things you’ve always wanted to do in Klipfolio but didn’t know you could

Published 2016-07-27, updated 2023-02-01
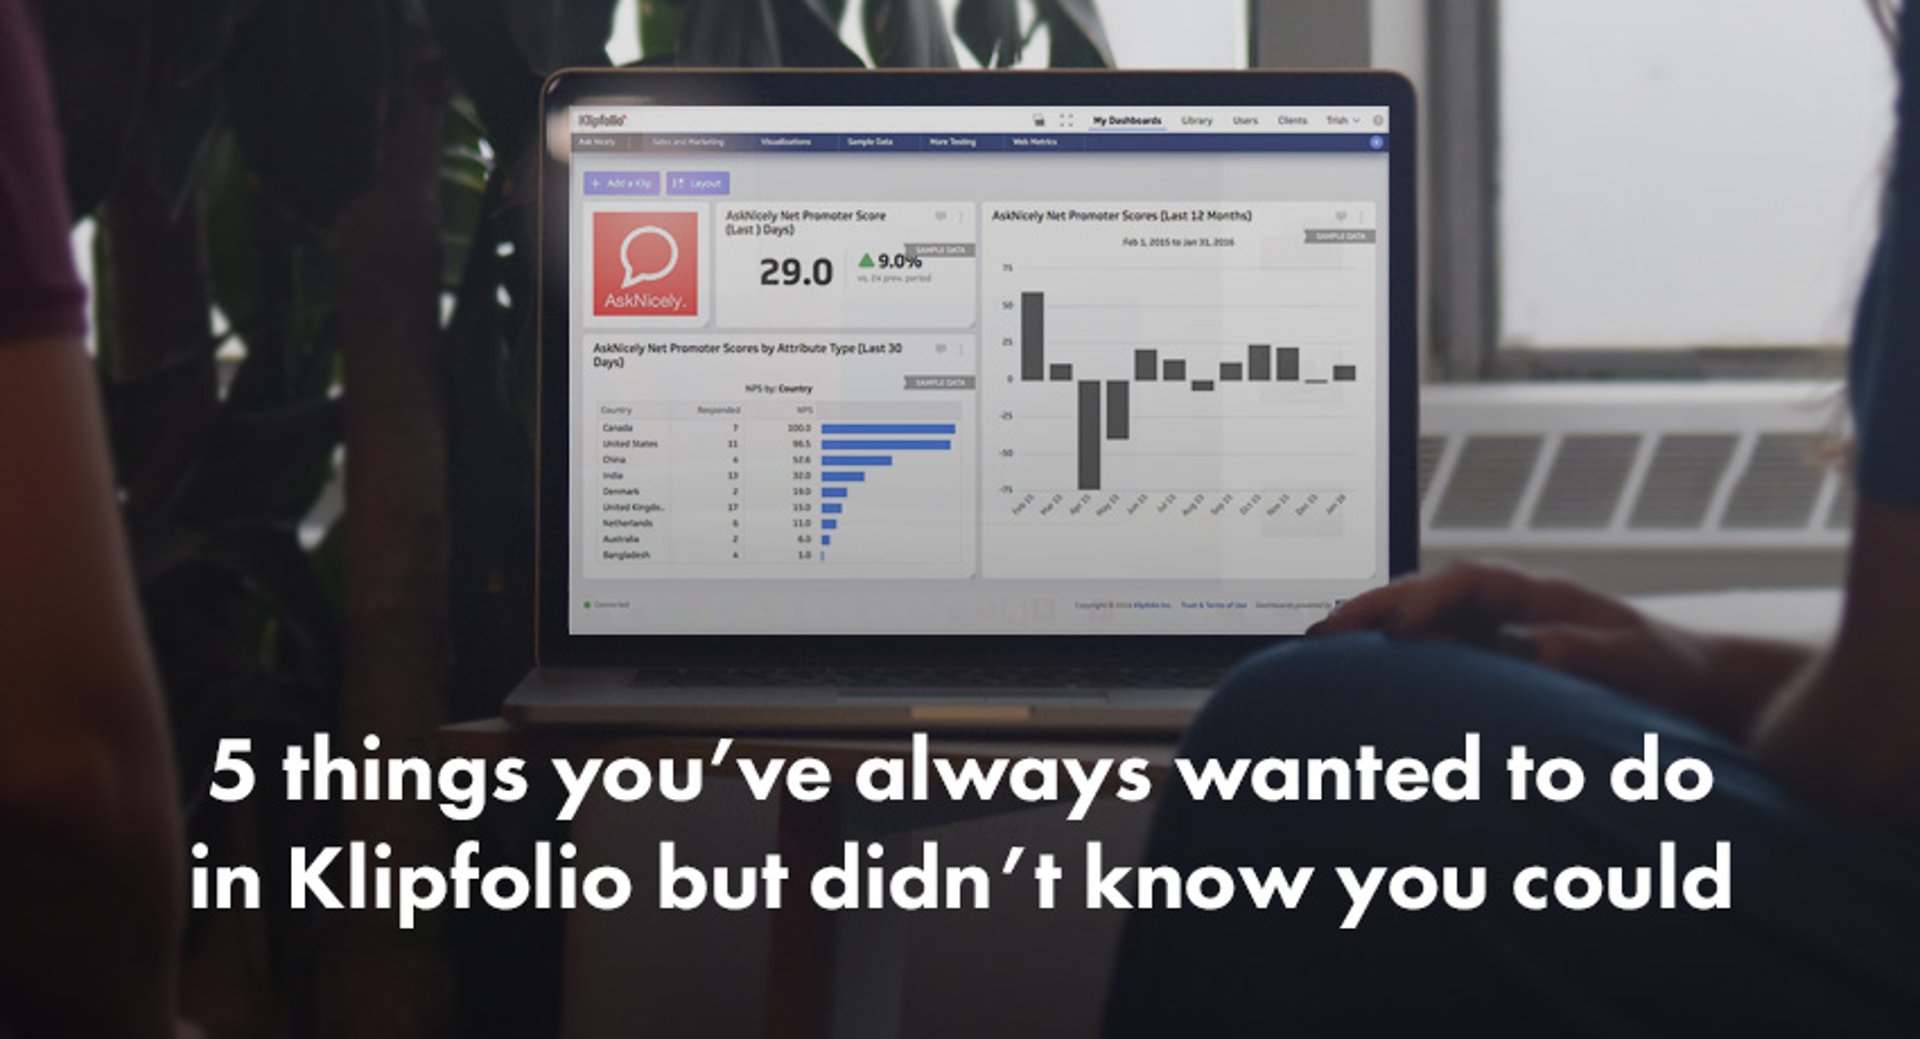
Summary - Get the 5 top tips to help you achieve your goals and build an insightful Klipfolio dashboard to help you succeed with data.
Whether you’re a new Klipfolio user or you’ve been building dashboards for years, here are five things that you should know to help you build some amazing dashboards.
1. Customize your Klip colors
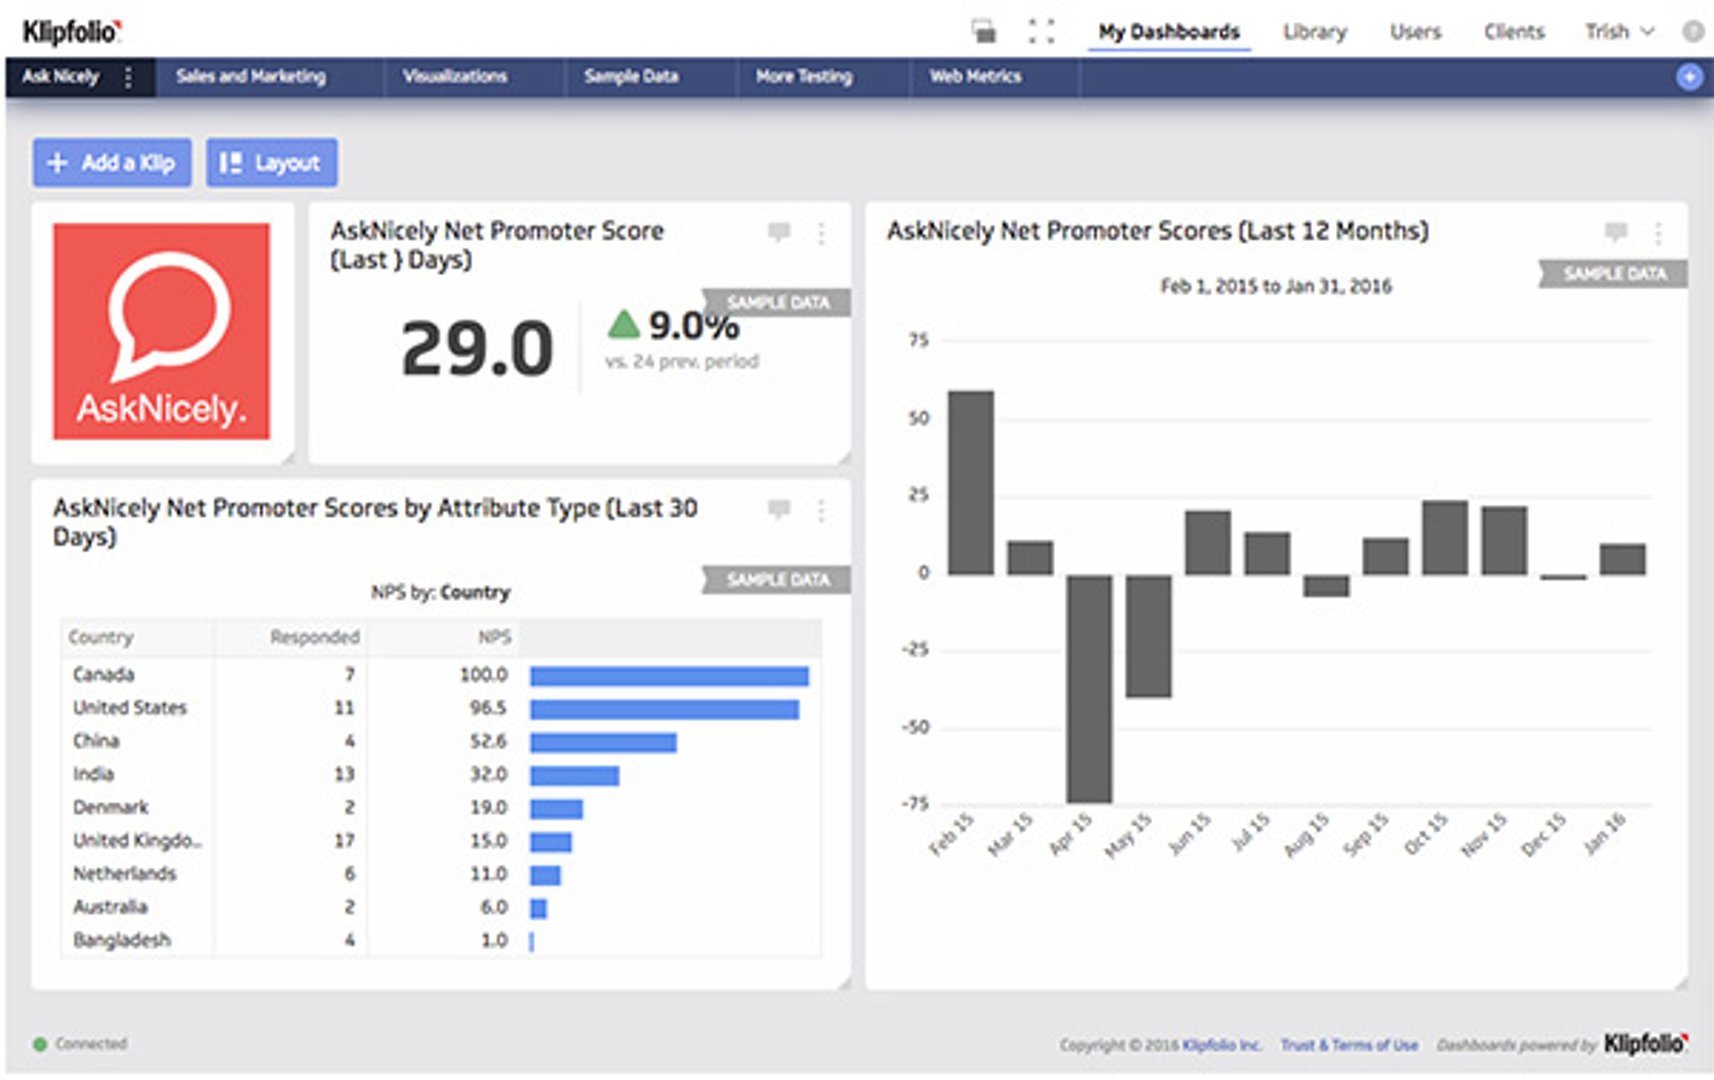
There’s nothing quite so impressive as presenting a dashboard to your boss and coworkers with all their relevant and up-to-date data. But one more simple step can polish your dashboard and bring it to new heights. You can customize the colors of the components in your dashboard and even use your own company colours.
Go from this:
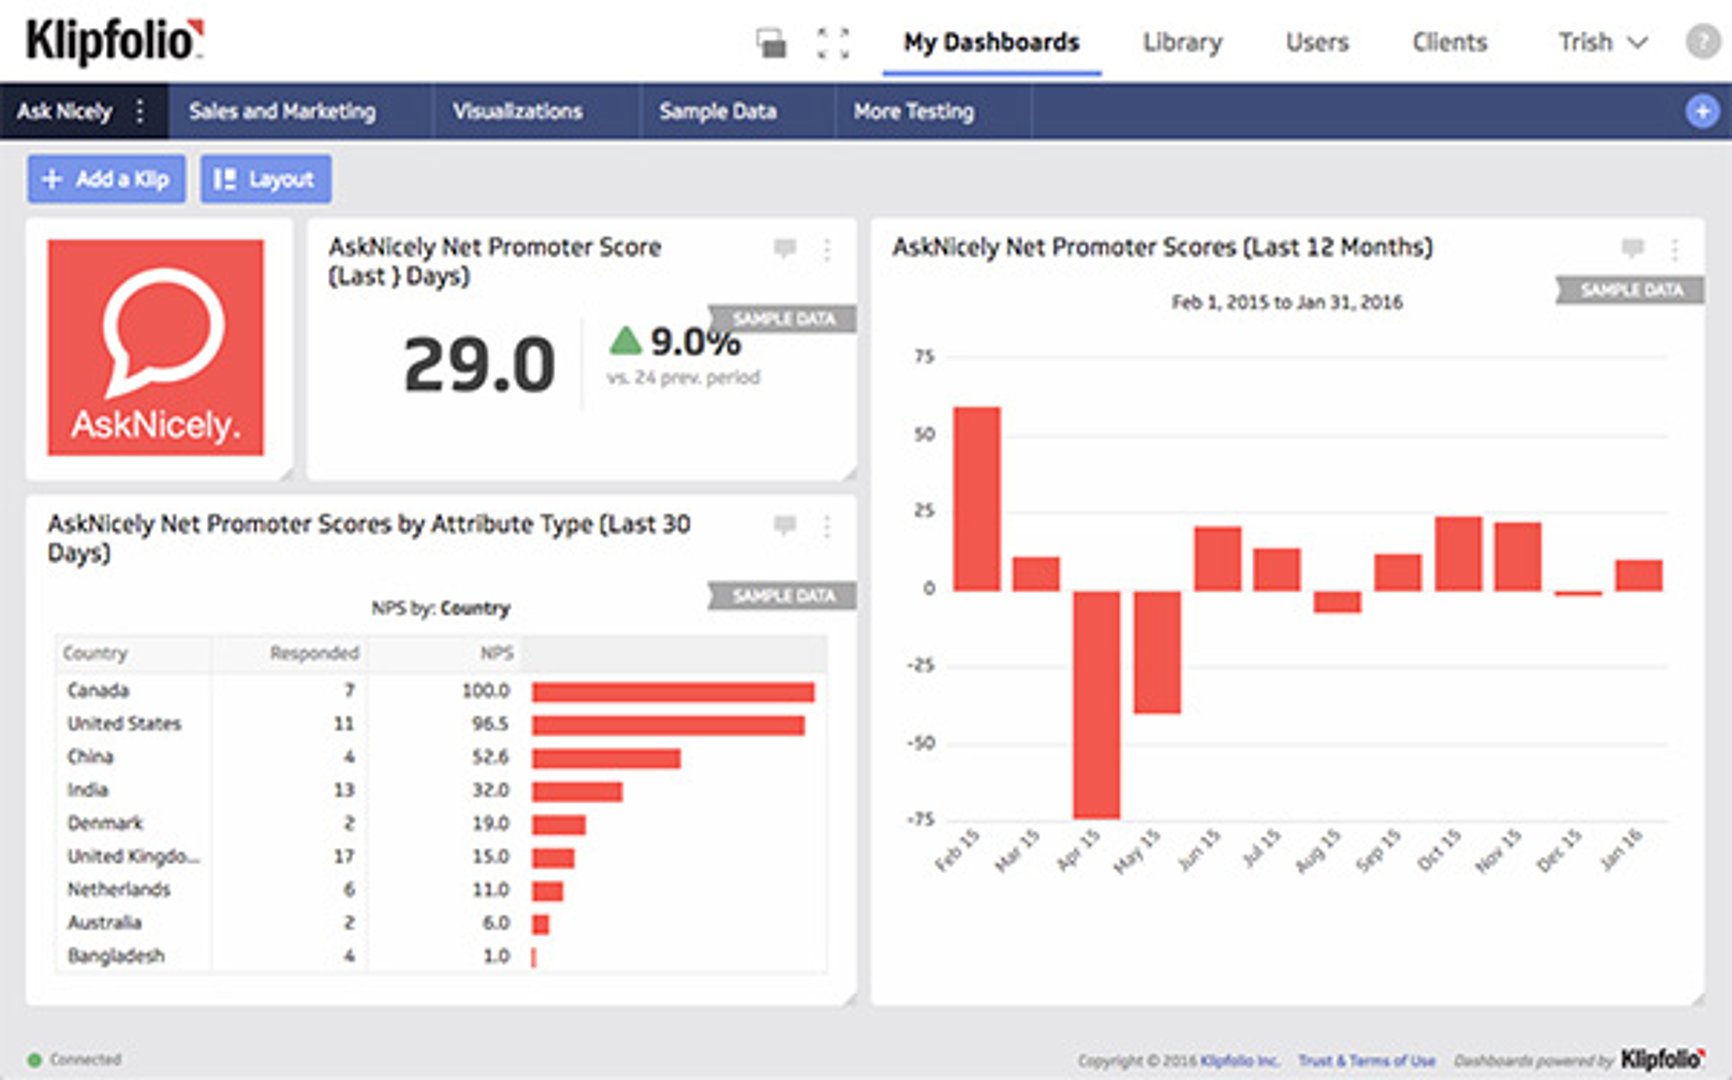
To this:
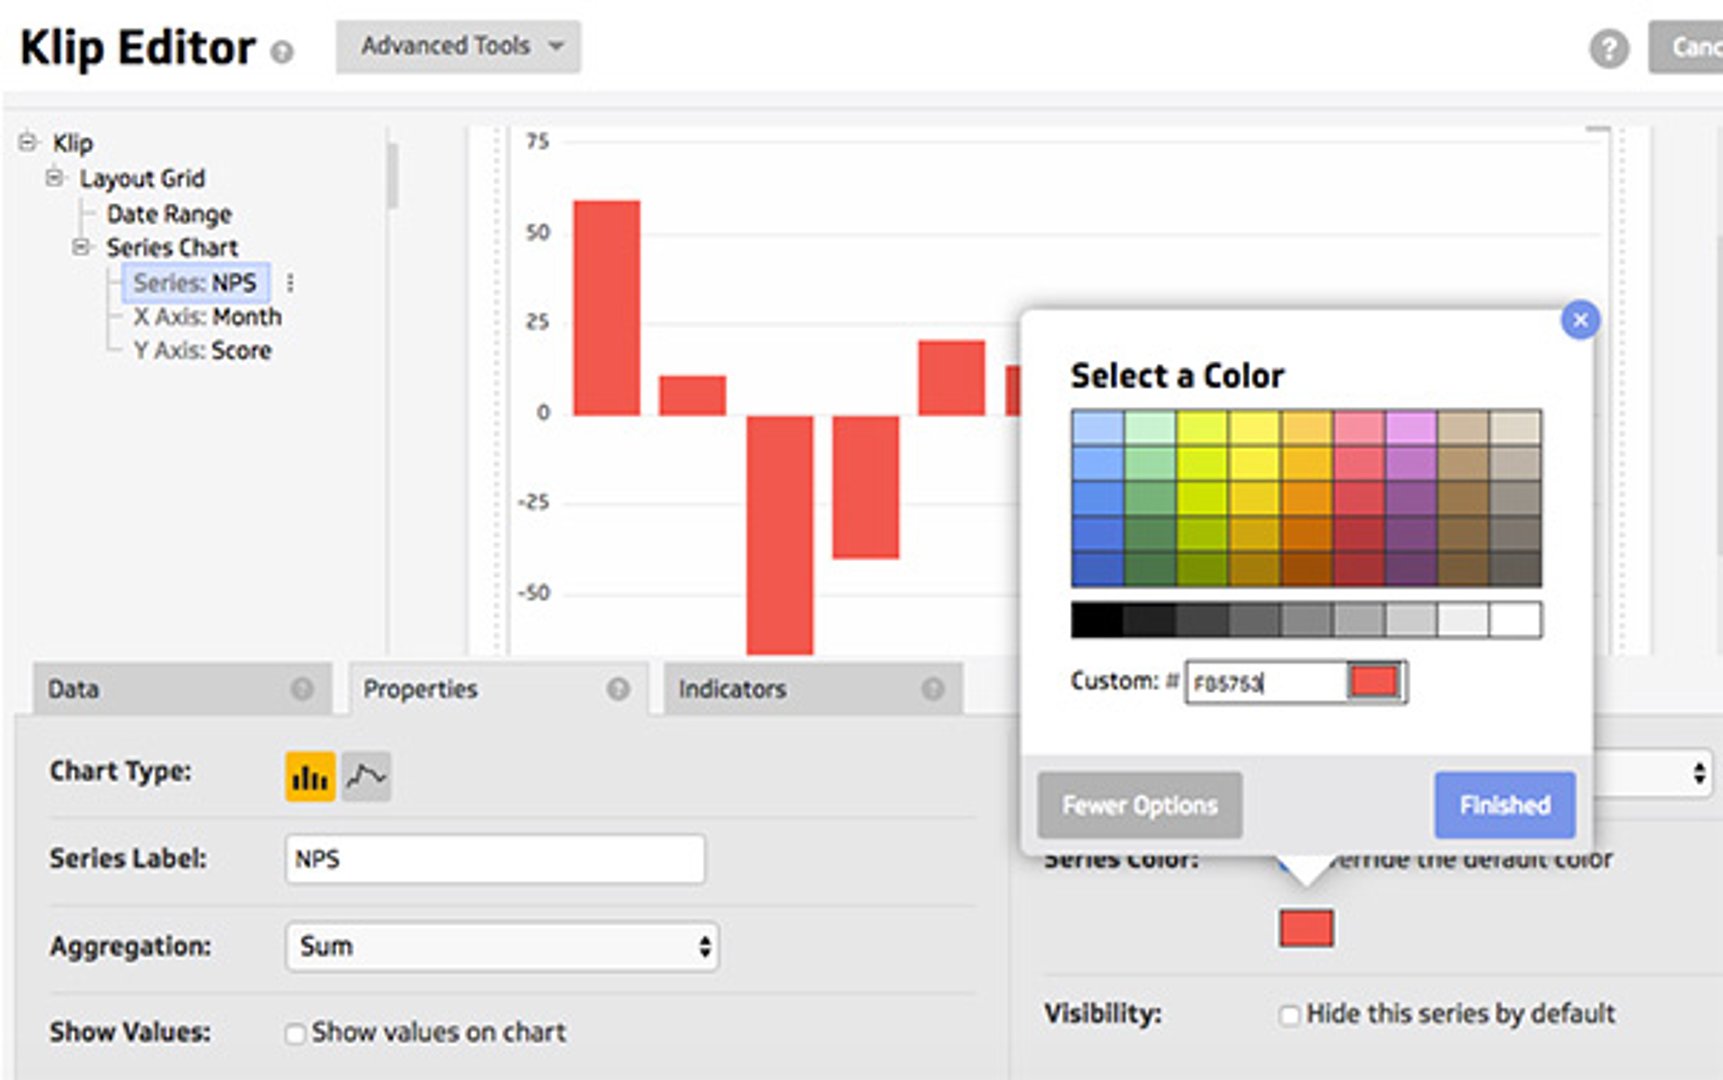
How to do it:
1. Edit your Klip
2. Go to the Properties panel for the component
3. Choose override default color, choose more options, enter your custom color code
2. Copy all the things!
Want to copy something in Klipfolio and not sure how? Here’s a short primer to save yourself loads of time!
1. Formulas: Use Control+C to copy, Control+V to paste. Or Command+C and Command+V for the mac users out there.
2. Klip Components: Right-click on the blue component menu and choose Copy. Navigate to another Klip and right click in the preview window and choose Paste.
3. Copy a Klip: In the dropdown next to Save and Exit choose “Save as copy...”
4. Duplicate a Data Source: In the data source, choose the blue “Duplicate” button
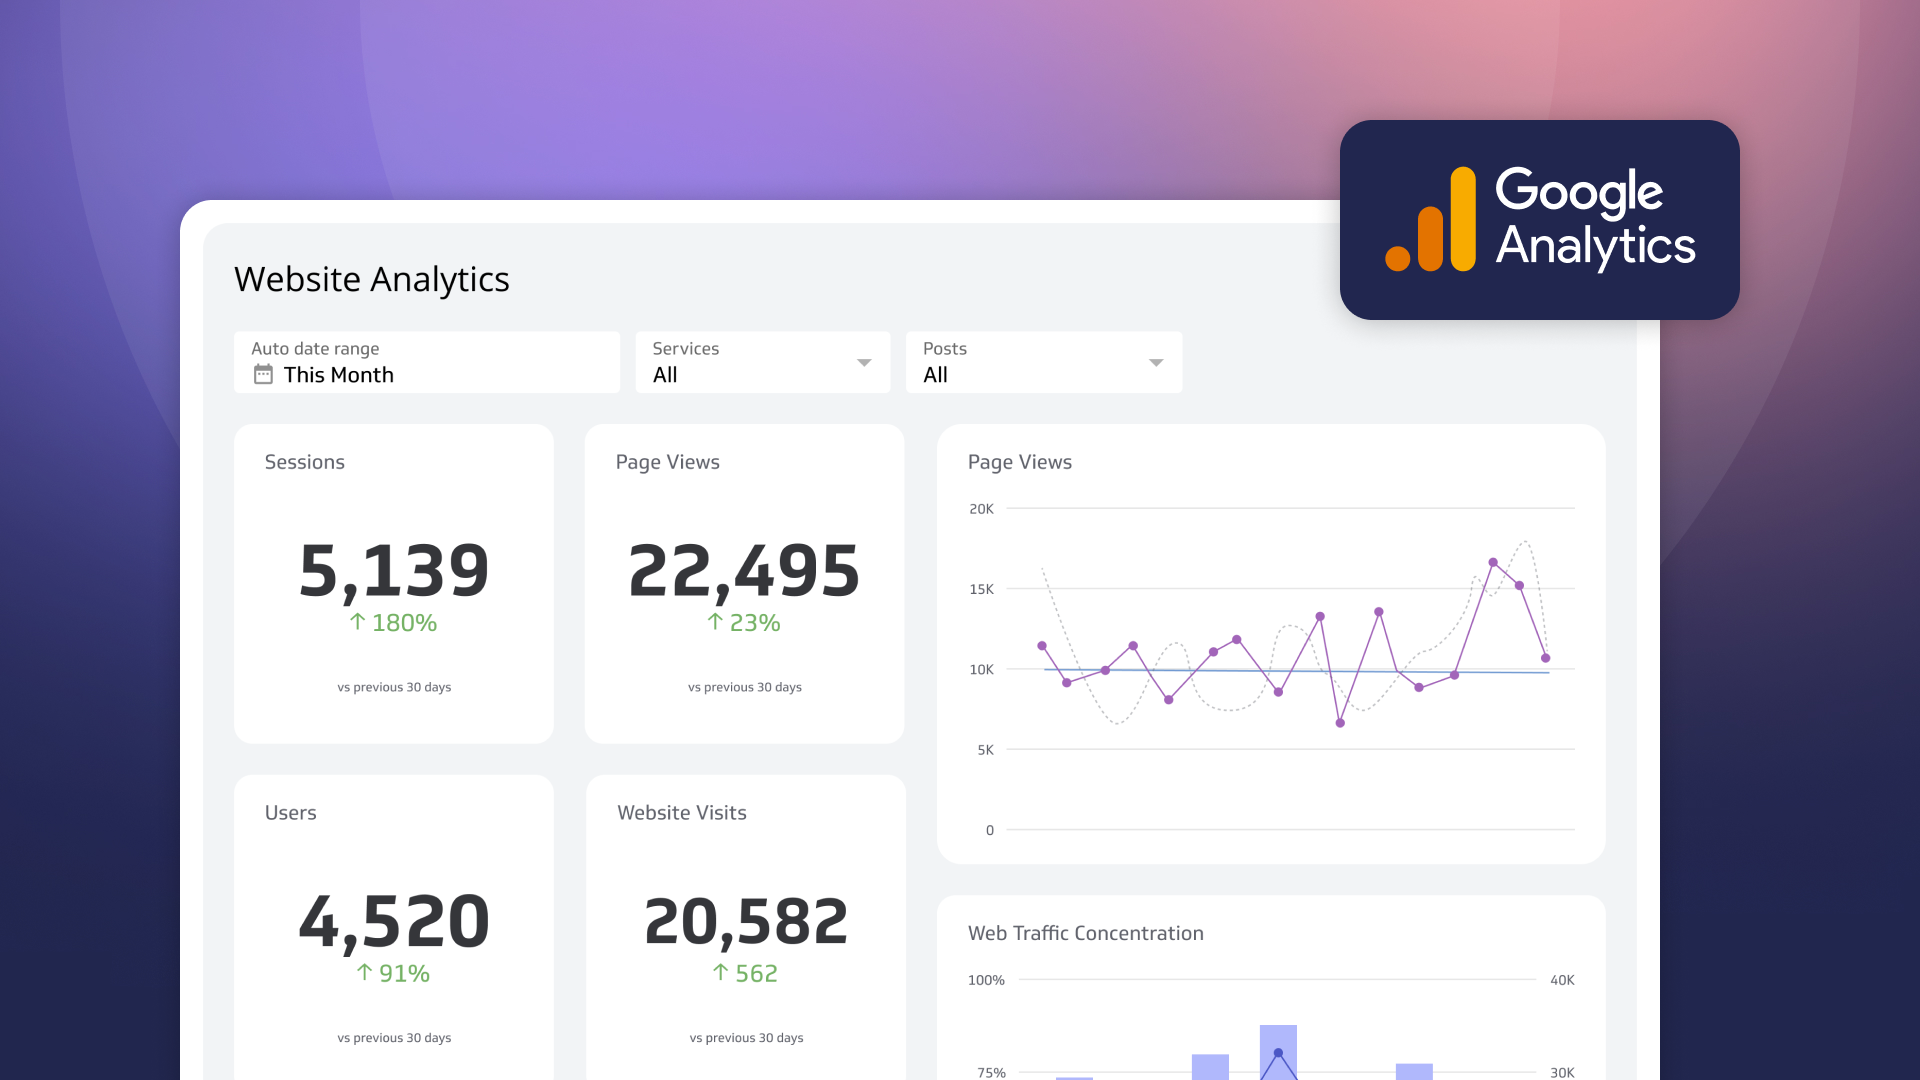
3. Changing the date range for a Klip from the Klip Gallery
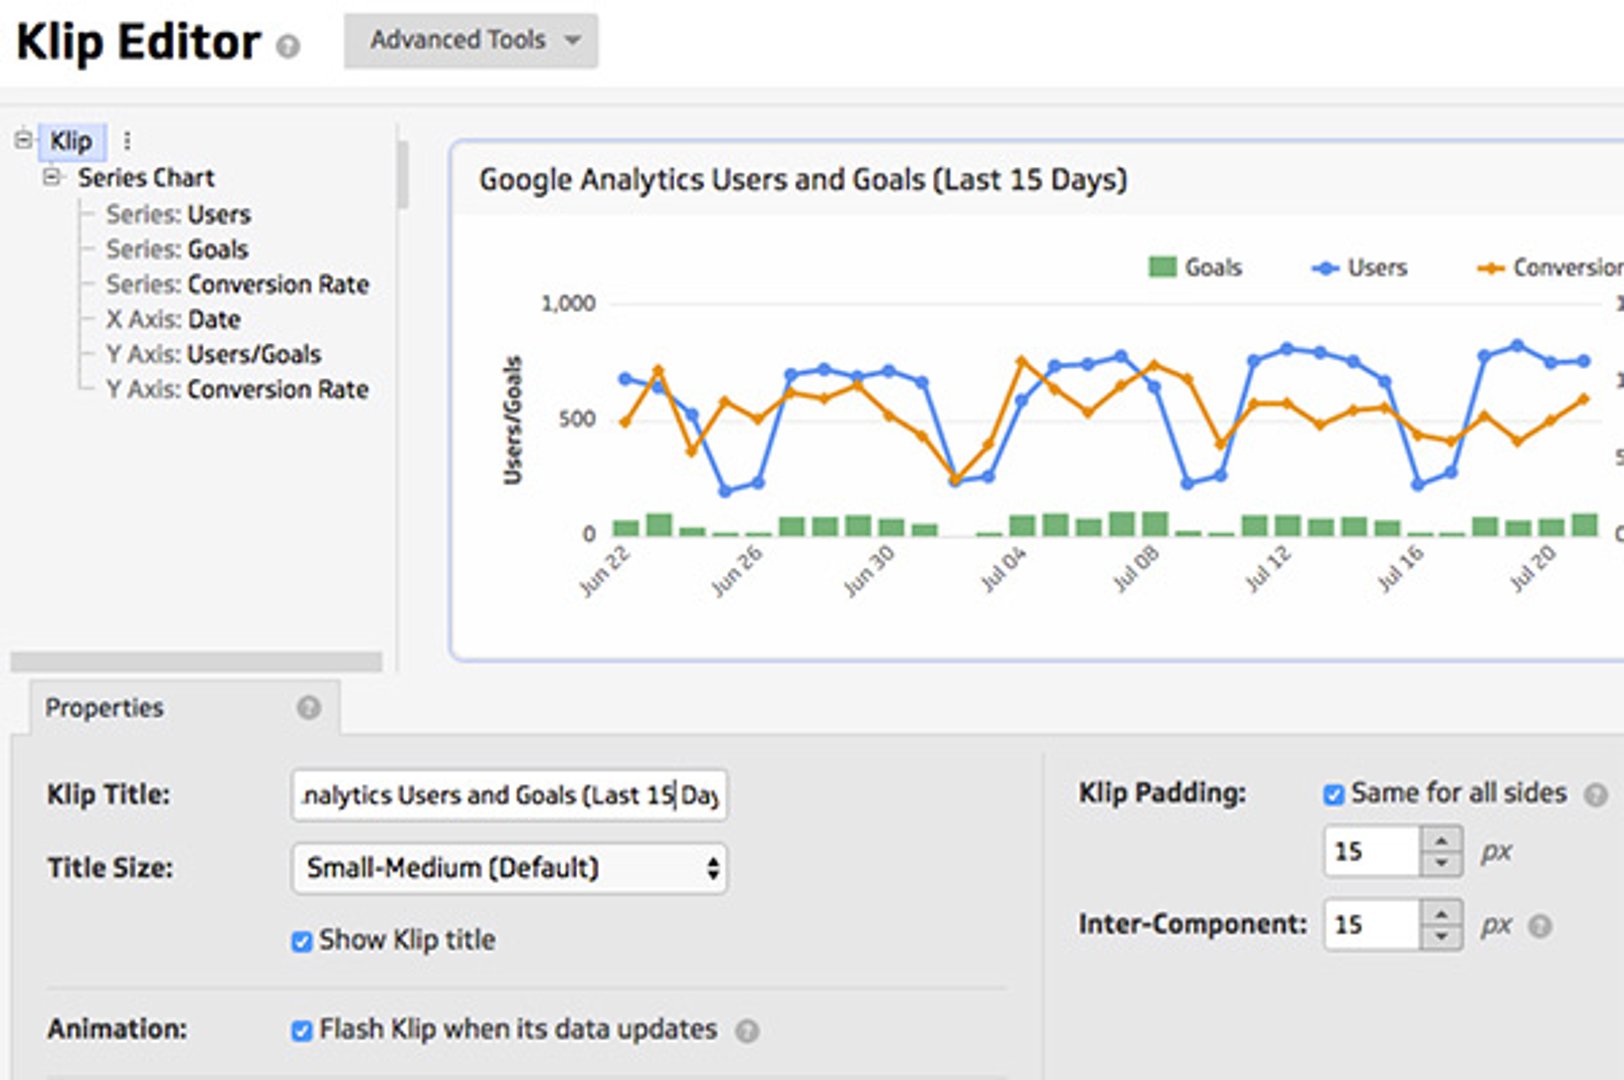
Have you ever looked at one of our Klips from the Klip Gallery and said “Yes! That’s exactly what I need. But I just want to make one small change - the timeframe”. Guess what? You can! You’ll need to get under the hood of Klipfolio and change a data source, but this is a great lesson on learning how Klipfolio gathers data and how to change your data sources. Let’s walk through the steps of how we can change the start date date for a Google Analytics Klip from the gallery:
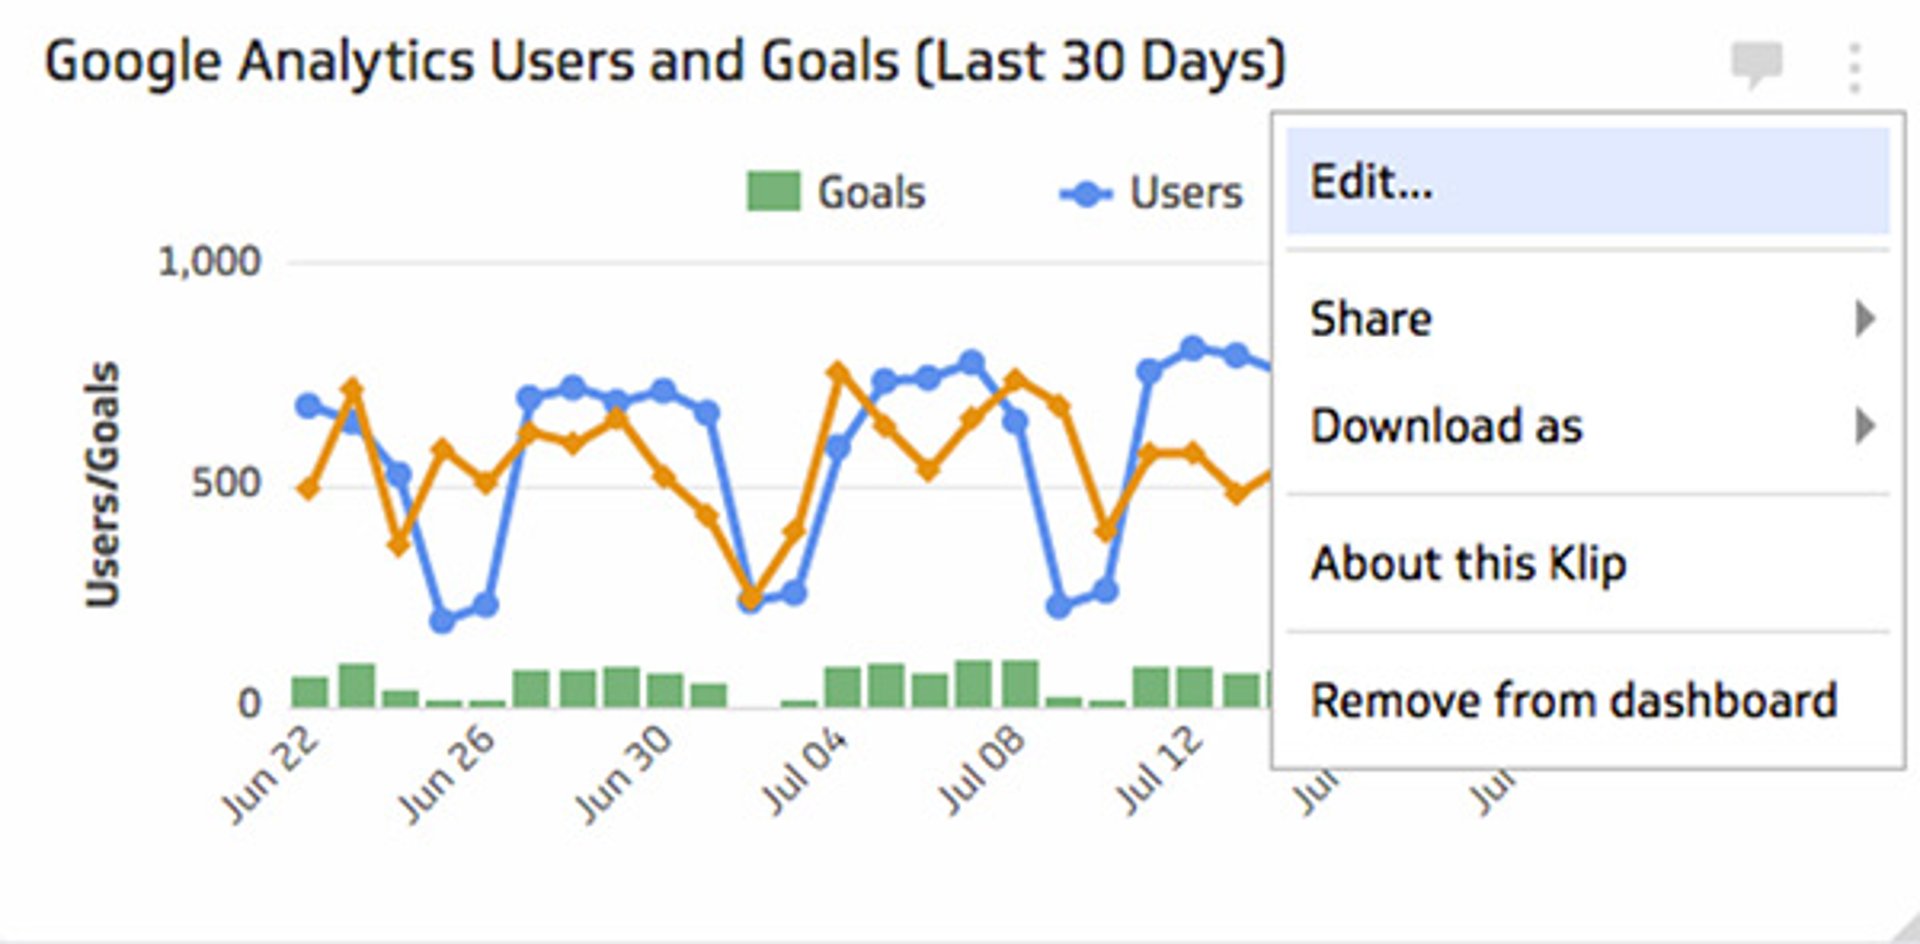
1. Select the Klip menu at the top right of your Klip and hit press Edit
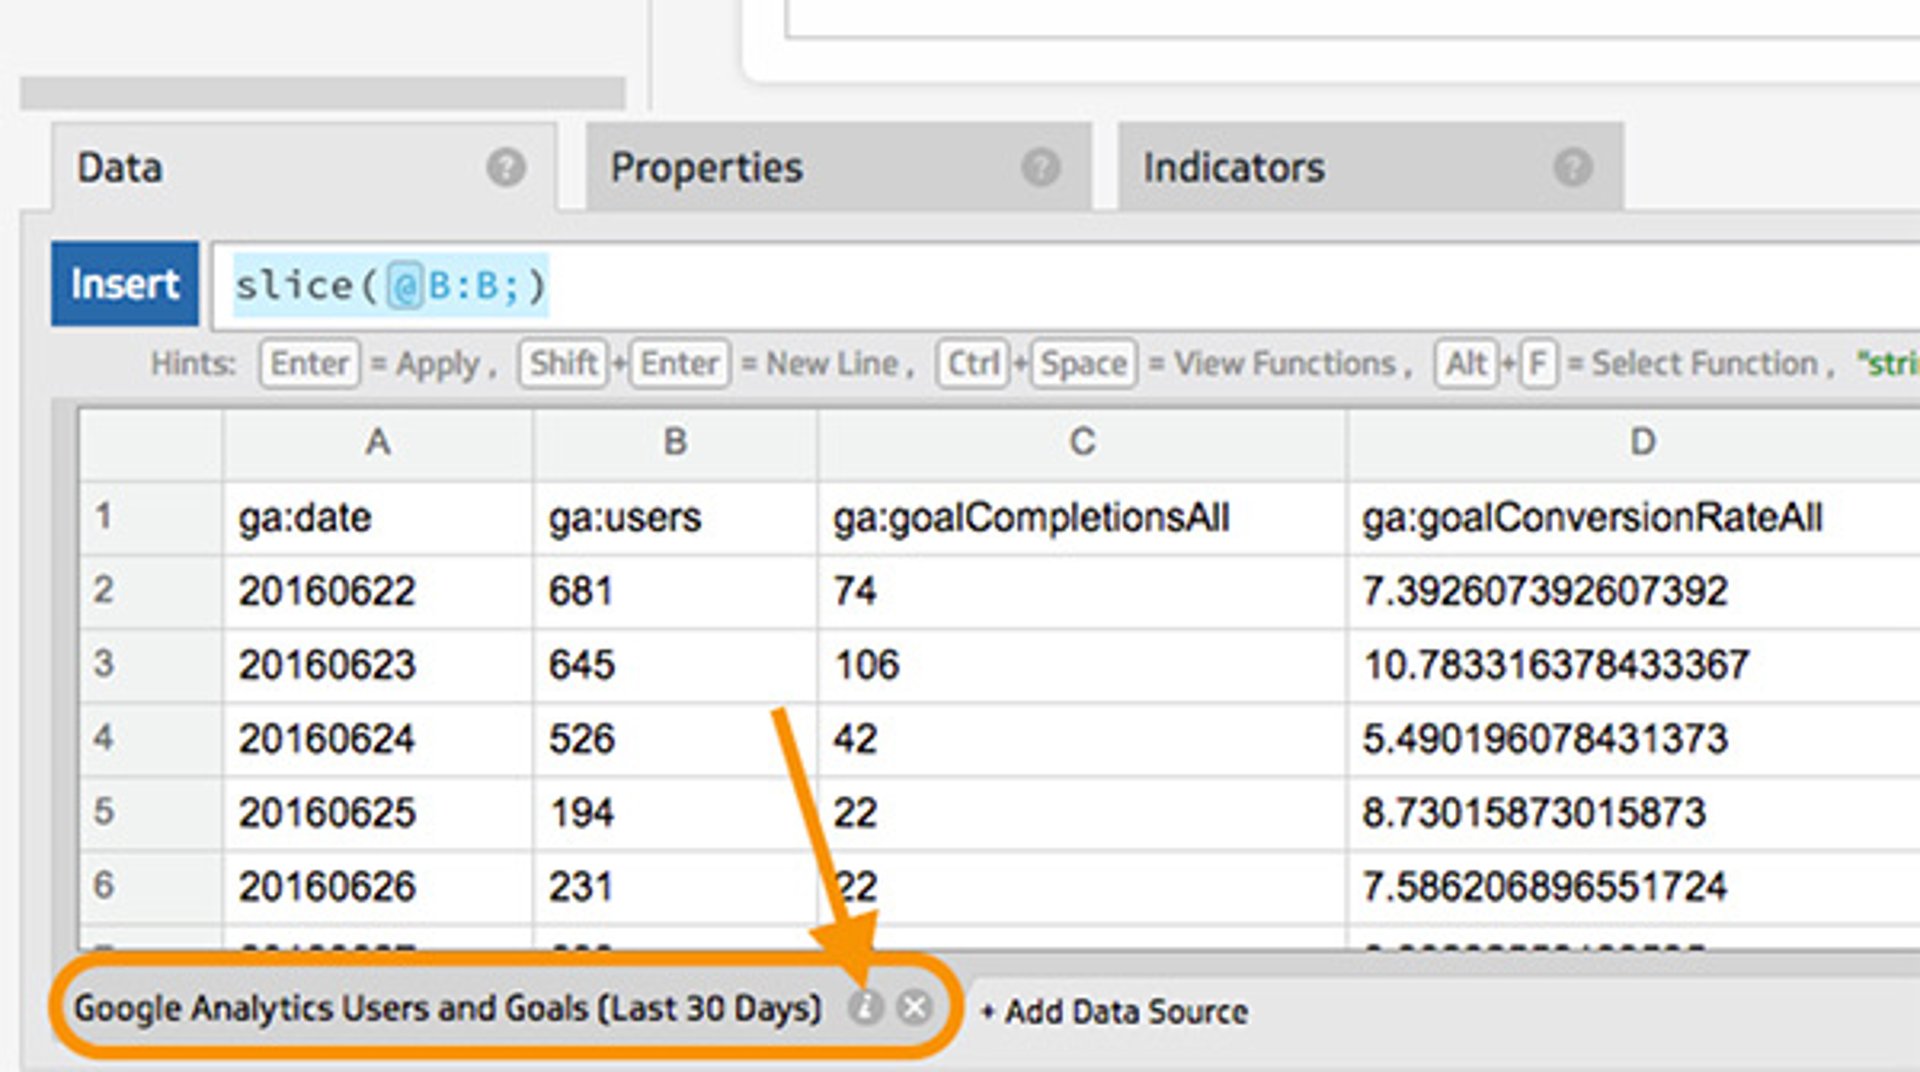
2. Find the data source (from the Klip Editor). This is the data source that is being used to drive the visualization in the Klip. Clicking the “i” icon next to the data source name will open the data source in a new tab.
3. Reconfigure the data source. This lets us modify the query in the data source that specifies the data we’re getting from Google Analytics and, most importantly for this case, the time frame for the data.
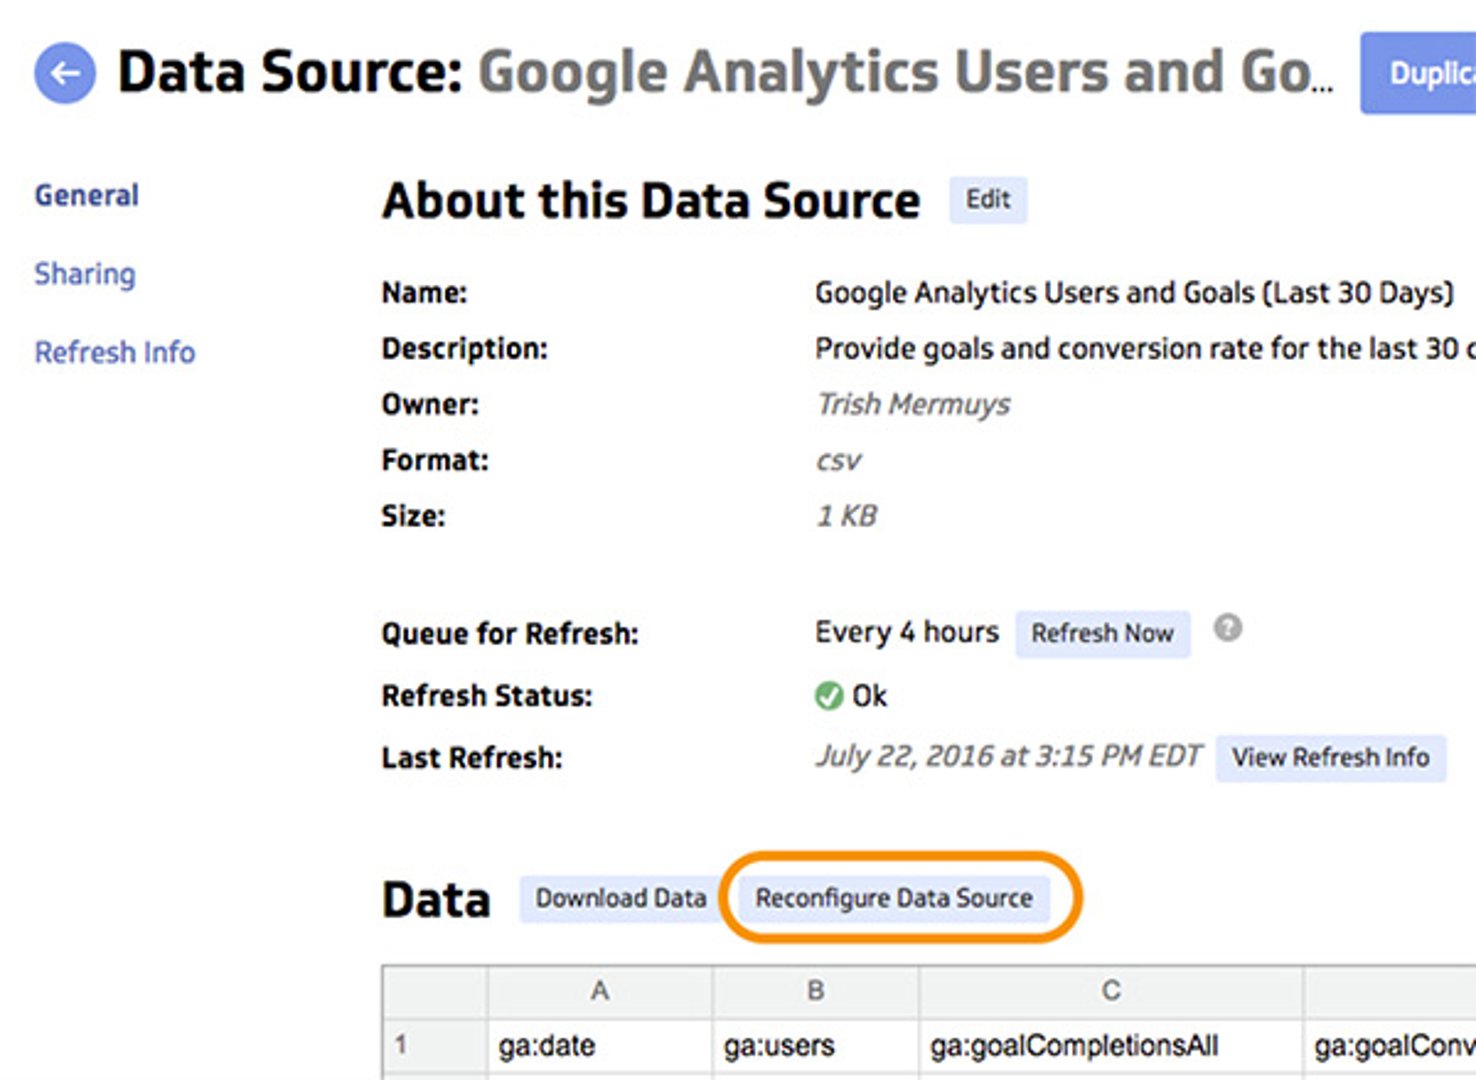
We may prompt you for authentication for the data source at this point. Click “Next” if we do.
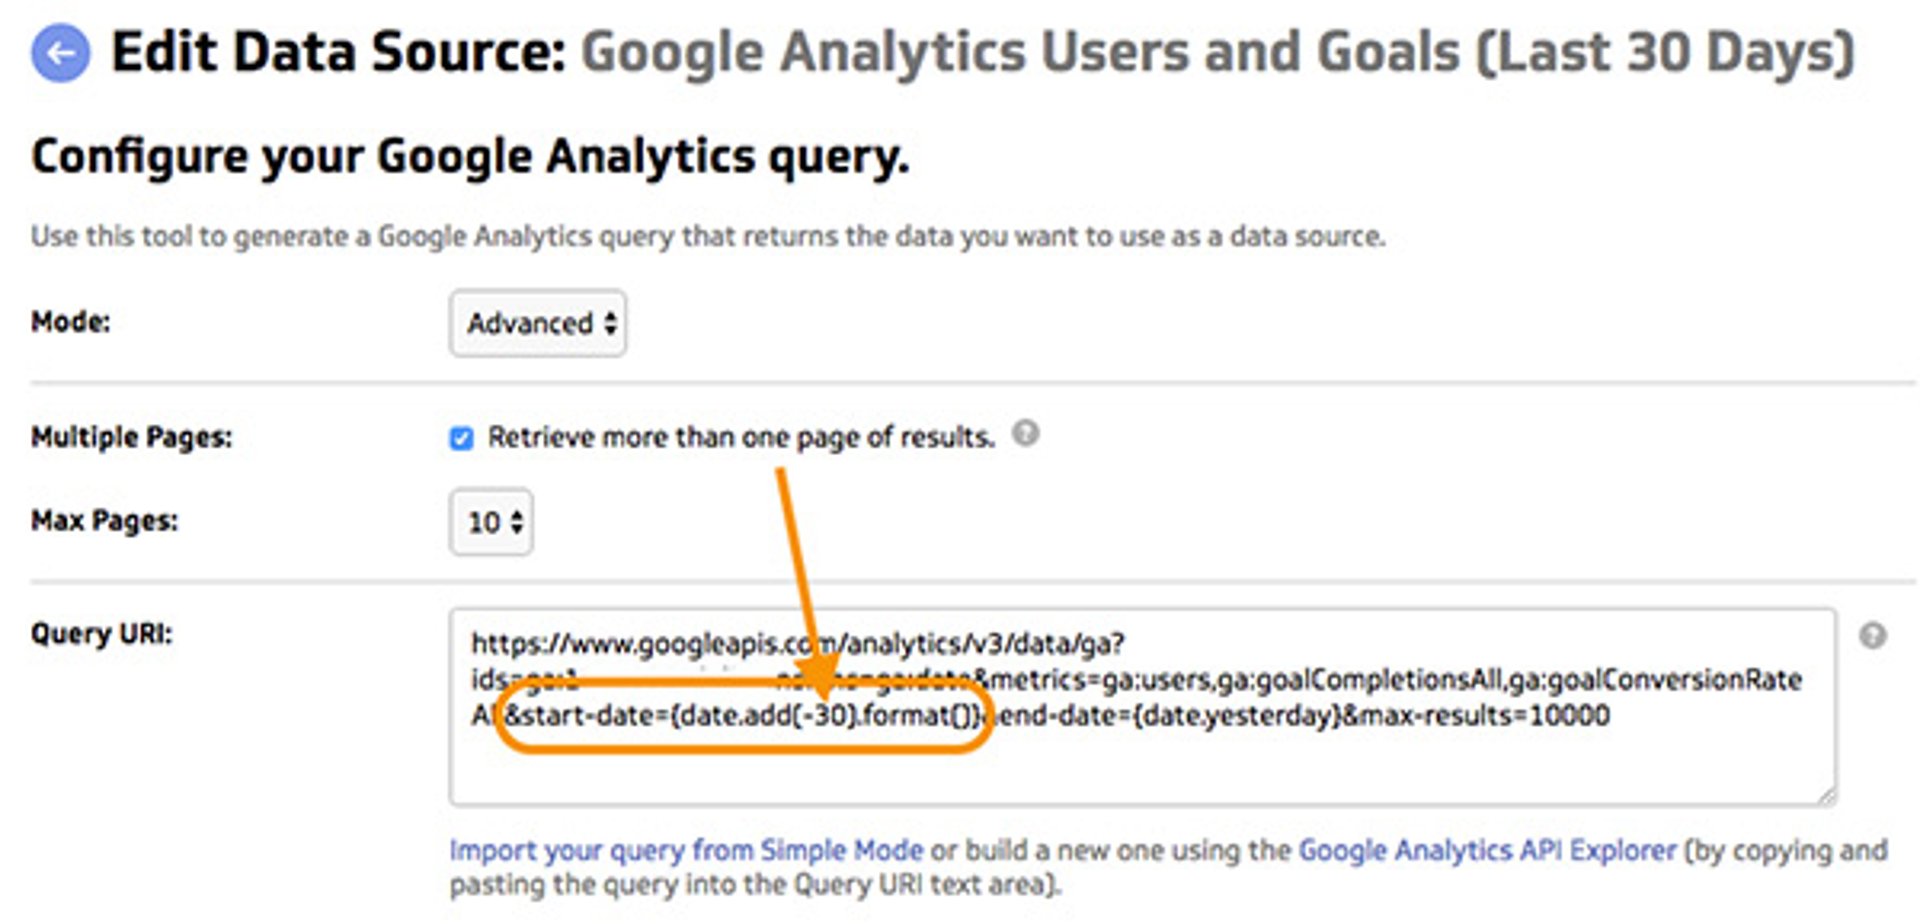
4. Modify the data source query to change the date range. Google Analytics uses start-date and end-date parameters in their queries. In this case we’re going to change the start date to 15 days ago (-15 instead of -30). Once you’ve change the date range, choose “Get Data” and save the data source.
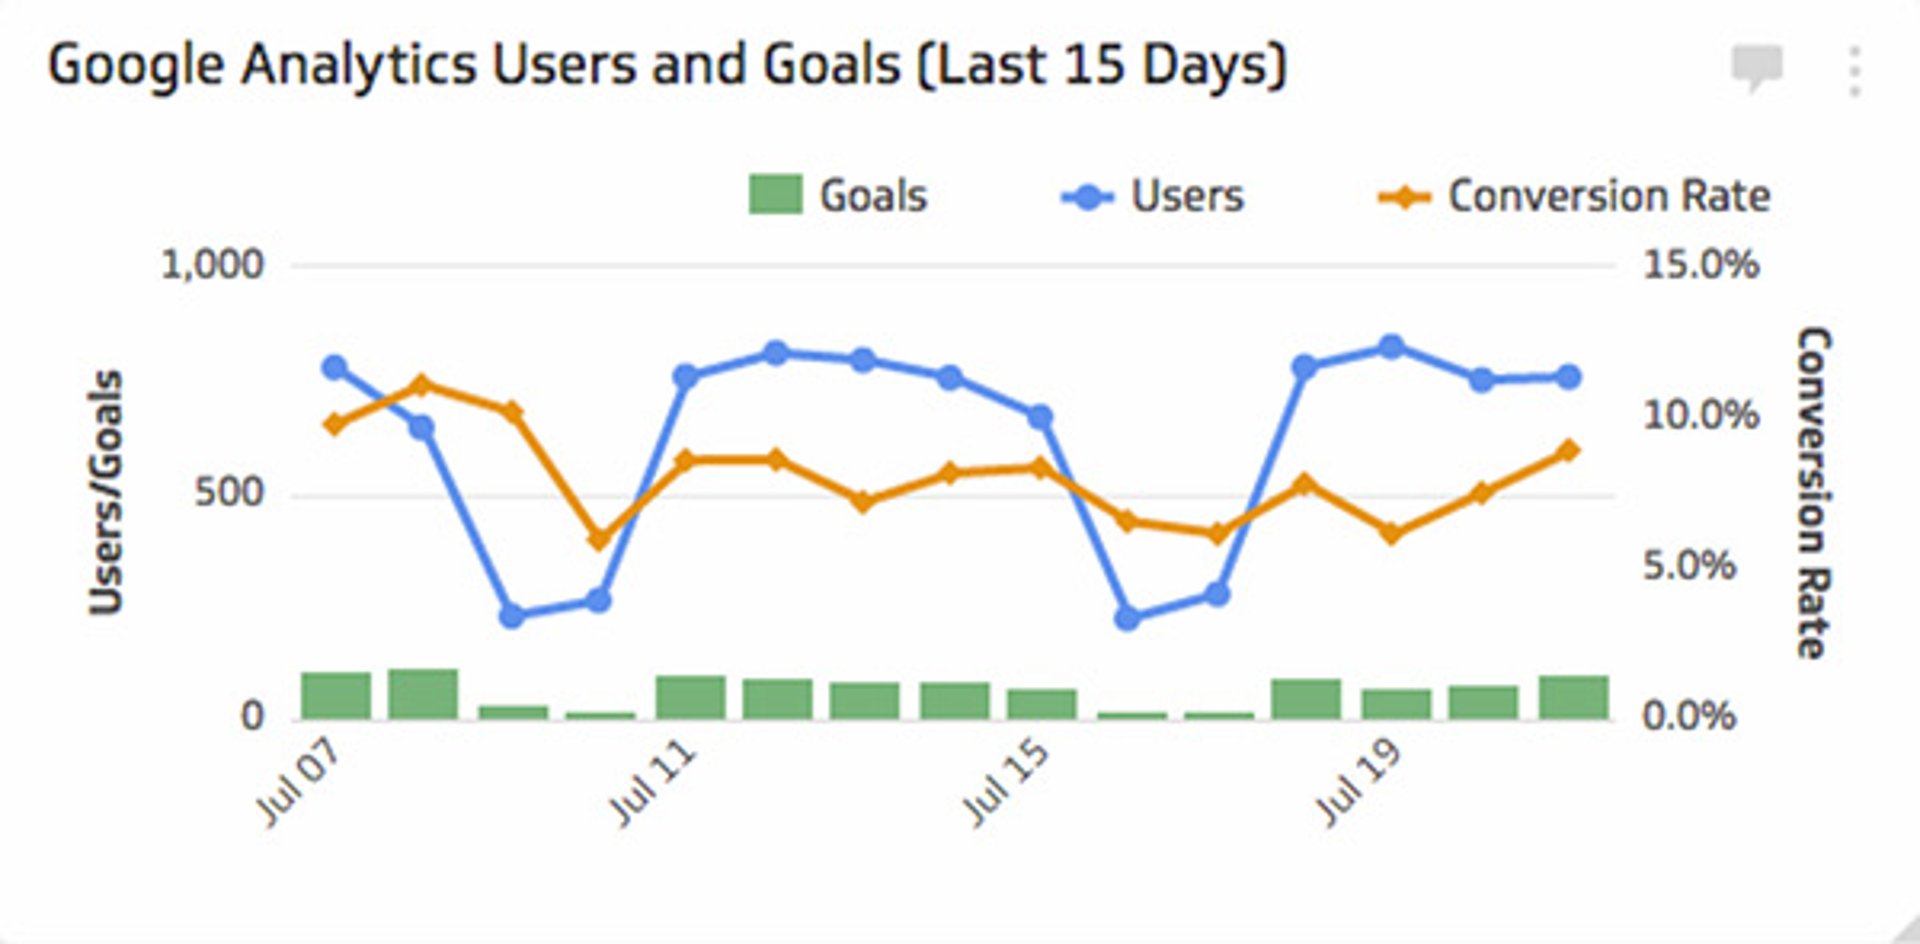
5. Update your Klip title. Go back to your first tab where you have the Klip Editor open. Make sure you update your Klip title to reflect the new date range. Save and Exit from your Klip (don’t worry if the preview doesn’t show you an updated date range yet).
And Voila! Back on your dashboard you’ve changed the date range!
Note: All data sources are different so your ability to do this depends on the Klip and the data source. Check the documentation for your data source to understand how to modify the dates and if there are any limits on how far back in history you can go.
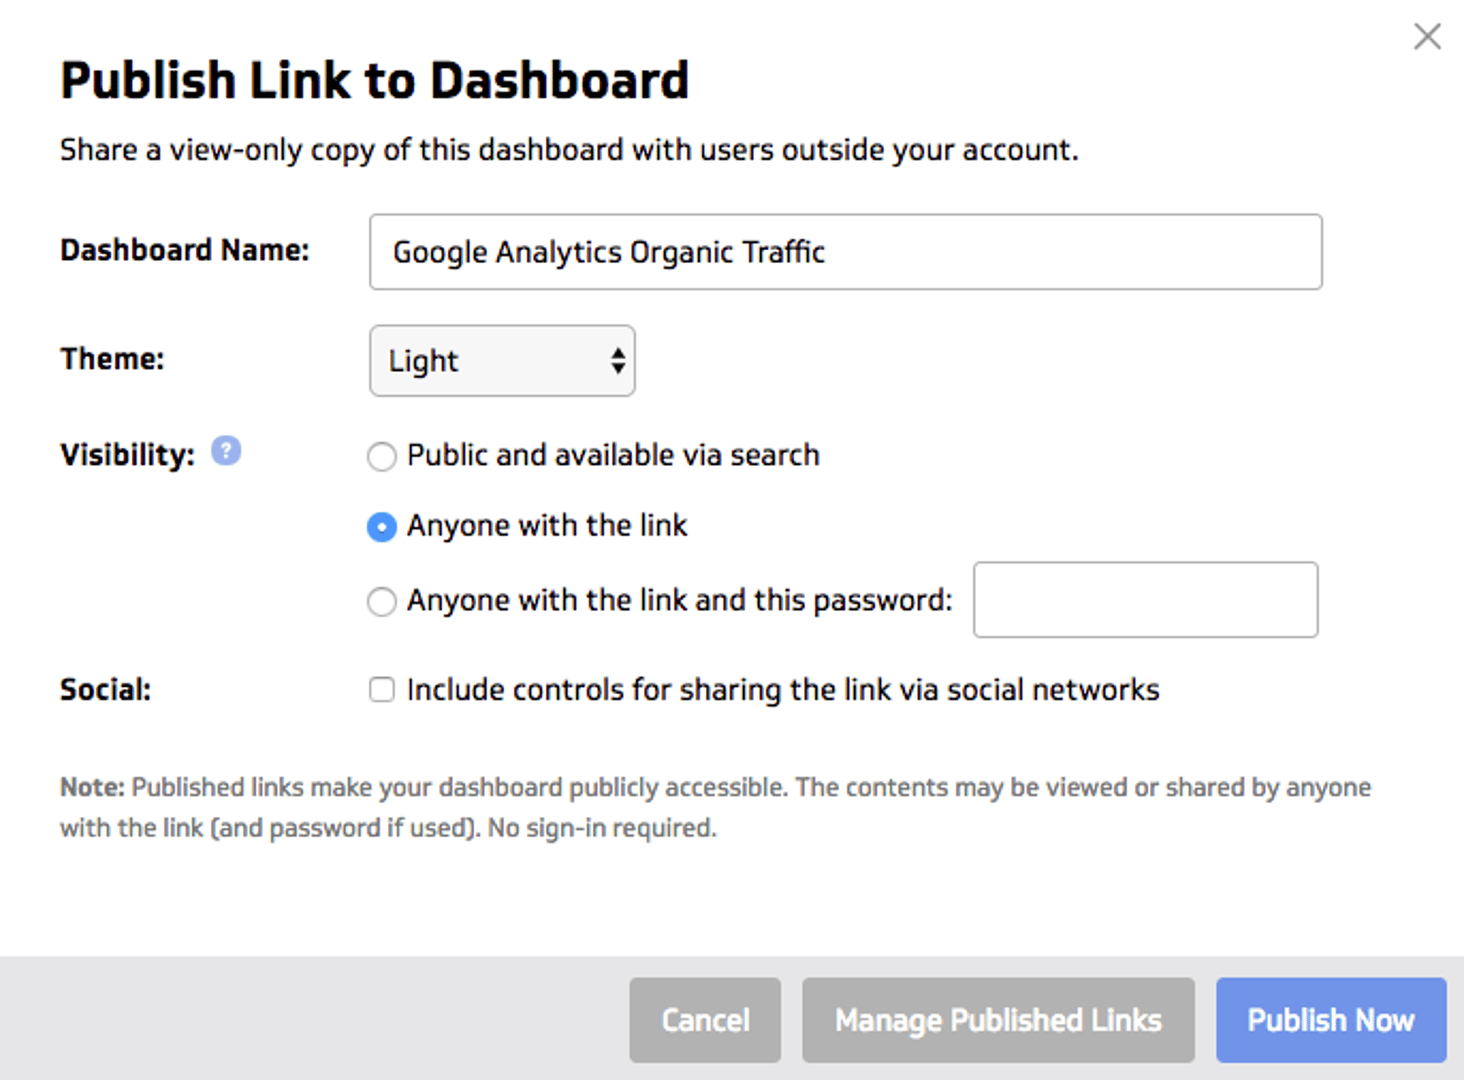
4. Share your dashboard in under five seconds!
Have you created an amazing dashboard and want to share it with all your coworkers? It takes five seconds to create a URL that you can use to share your dashboard.
5. Start a discussion
Is everyone viewing your dashboard but no one taking action? Start a discussion about the latest data in one of your Slack channels!
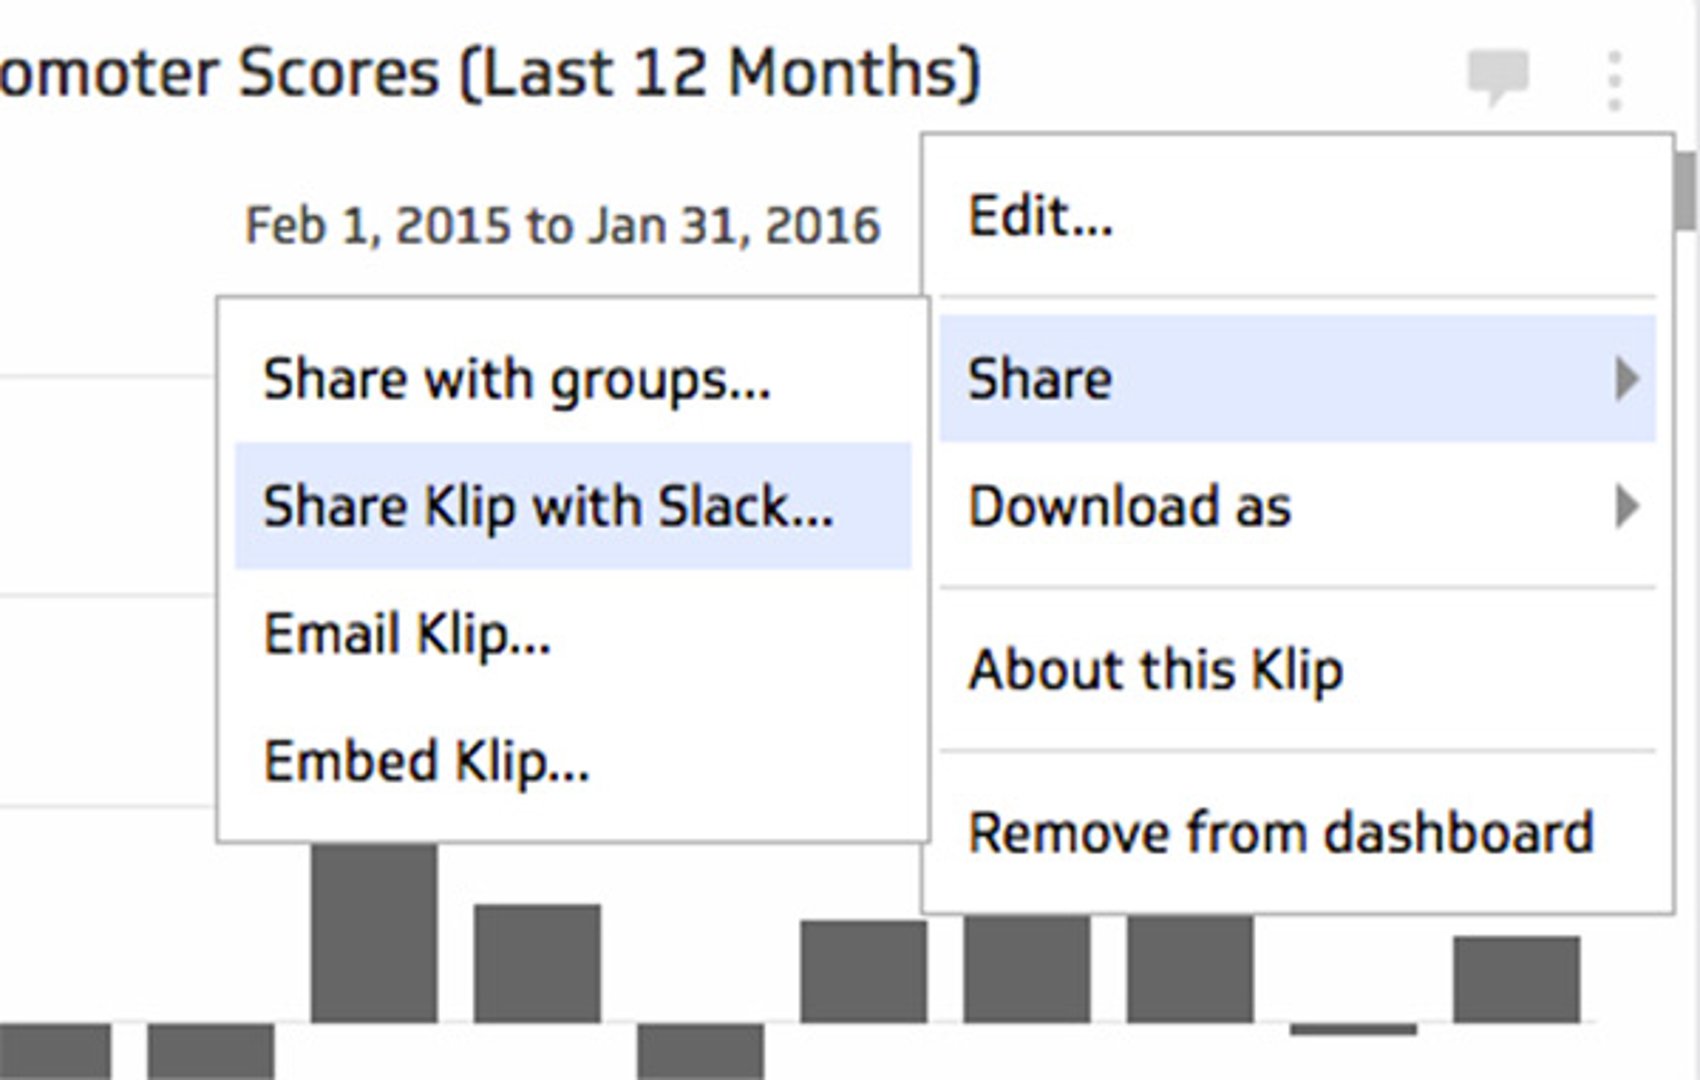
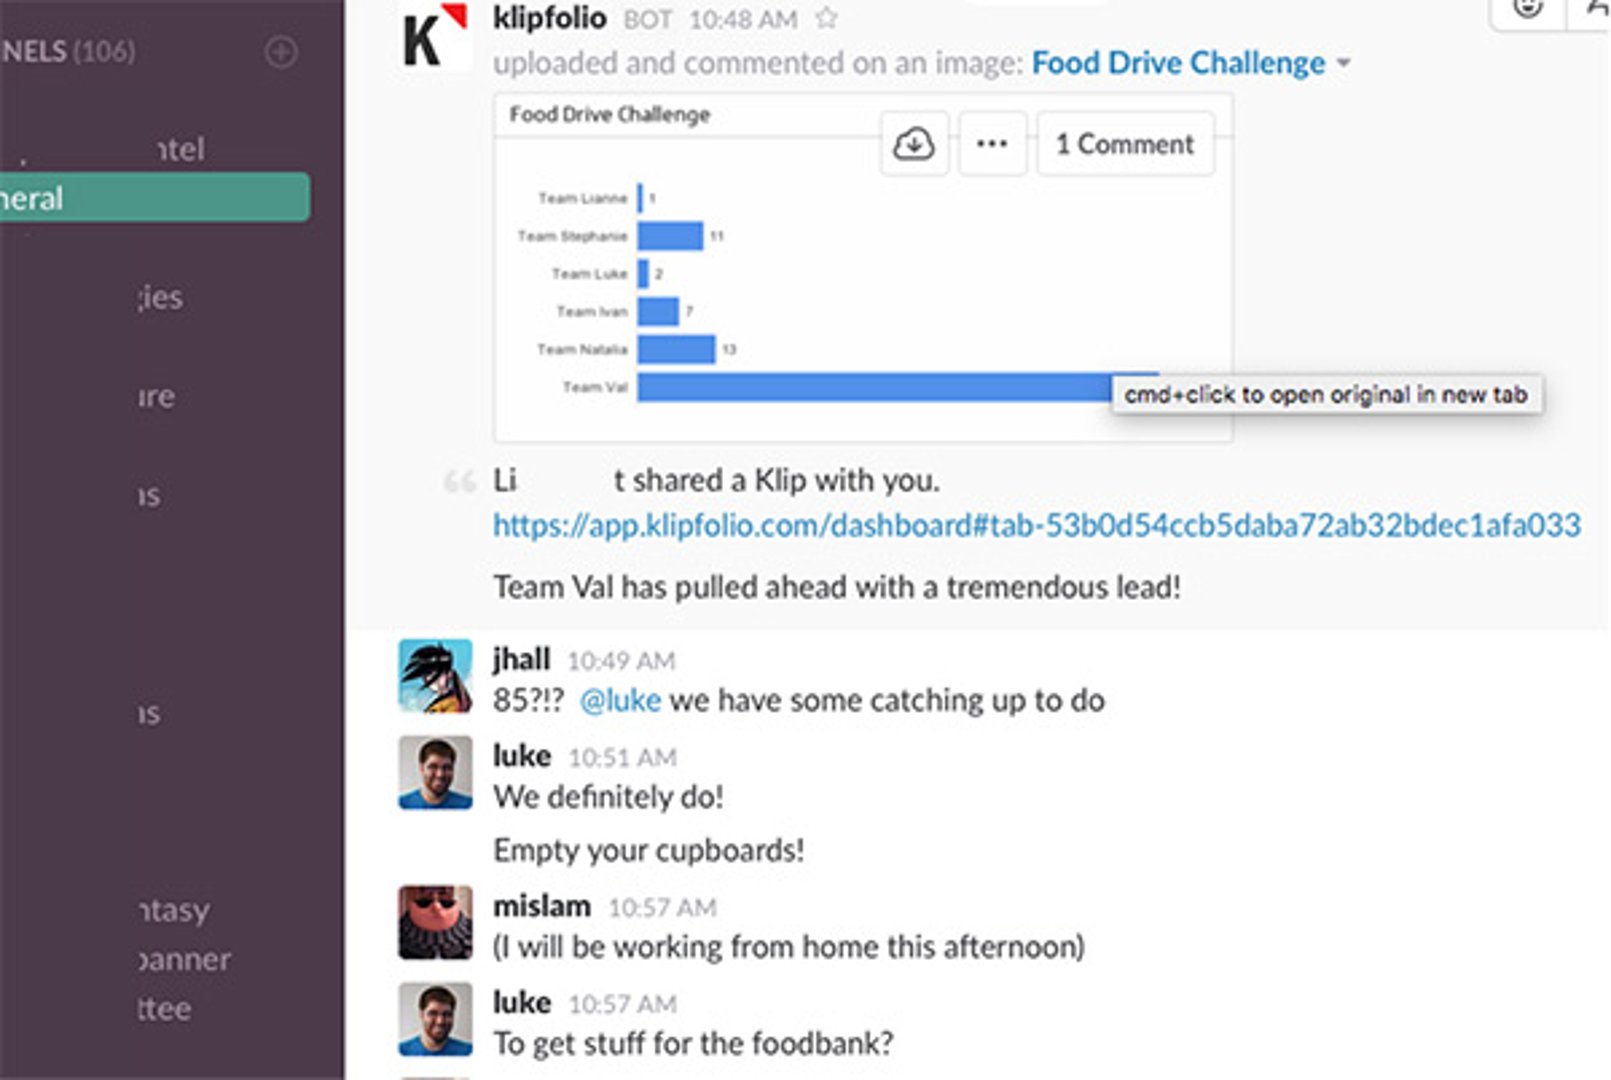
Note: You must have the Slack integration enabled in your account.
Hope you enjoyed these tips!
Related Articles

PowerMetrics Case Study: The Project Booth
By Cathrin Schneider — April 11th, 2024

Let’s fix analytics so we can stop asking you for dashboards
By Cathrin Schneider — September 11th, 2023
How to Build Google Analytics 4 Dashboards in Klips
By Jonathan Taylor — June 6th, 2023
How to use the Google Analytics 4 Query Explorer to export data
By Jonathan Taylor — June 1st, 2023