Data Analytics blogs
A collection of our most recent articles on

Using Data at Your Restaurant: Tips to Improve the Process
By Saleem Khatri — March 14, 2019
It's not about the database. It's about you. The biggest Klipfolio update ever.
By Allan Wille, Co-Founder — February 6, 2019

Most Click-Through Data Is Wrong, and Here’s Why
By Dave Moll — August 29, 2018

Salesforce Training Resources 101: The Basics that You Need to Know
By Jonathan Milne — September 25, 2019

Make your company’s data the source of your next blog post
By Mark Brownlee — January 16, 2019

4 data-driven retail strategies to better understand your clients
By Saleem Khatri — May 1, 2019

Side hustle metrics: What you need to consider for side hustle success
By Mark Brownlee — January 21, 2019

Top 6 KPIs to track for enterprise e-commerce organizations
By Brian Dainis — January 3, 2020

Inside the mind of a successful data-driven startup founder
By Melinda Elmborg — December 5, 2019

Enriching Culture Through Survey Data: It's Not Easy Being Green
By Lisa Wester — July 23, 2018

The Evolution of Analytics
By Allan Wille, Co-Founder — December 3, 2020

Using Facebook's Graph API Explorer to retrieve Insights data
By Jonathan Taylor — April 11, 2014

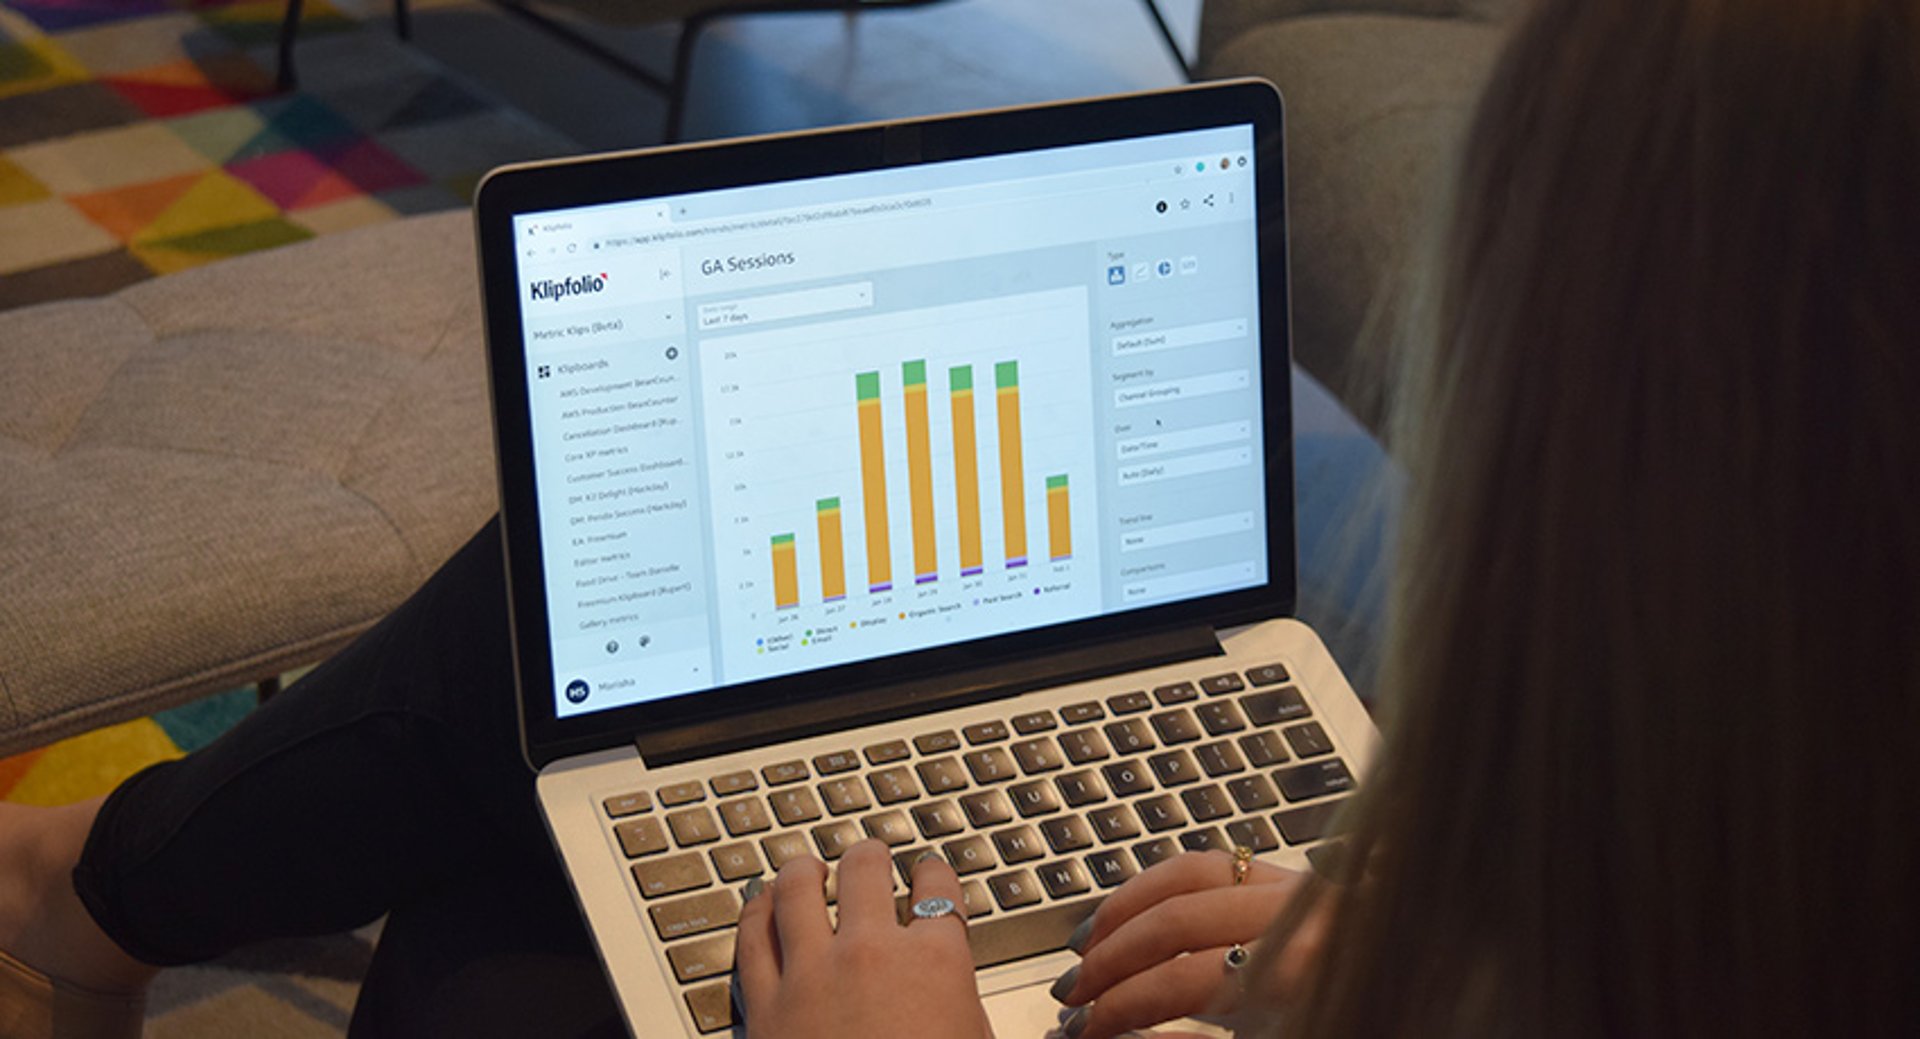
Data Driven Agency Series Chapter 2: Using data to foster lasting customer relationships
By Marisha Sesto — October 15, 2018

5 tips to understand (and organize) your restaurant data
By Saleem Khatri — December 11, 2019

Top cybersecurity KPIs to track for risk mitigation
By Matt Shealy — November 25, 2019
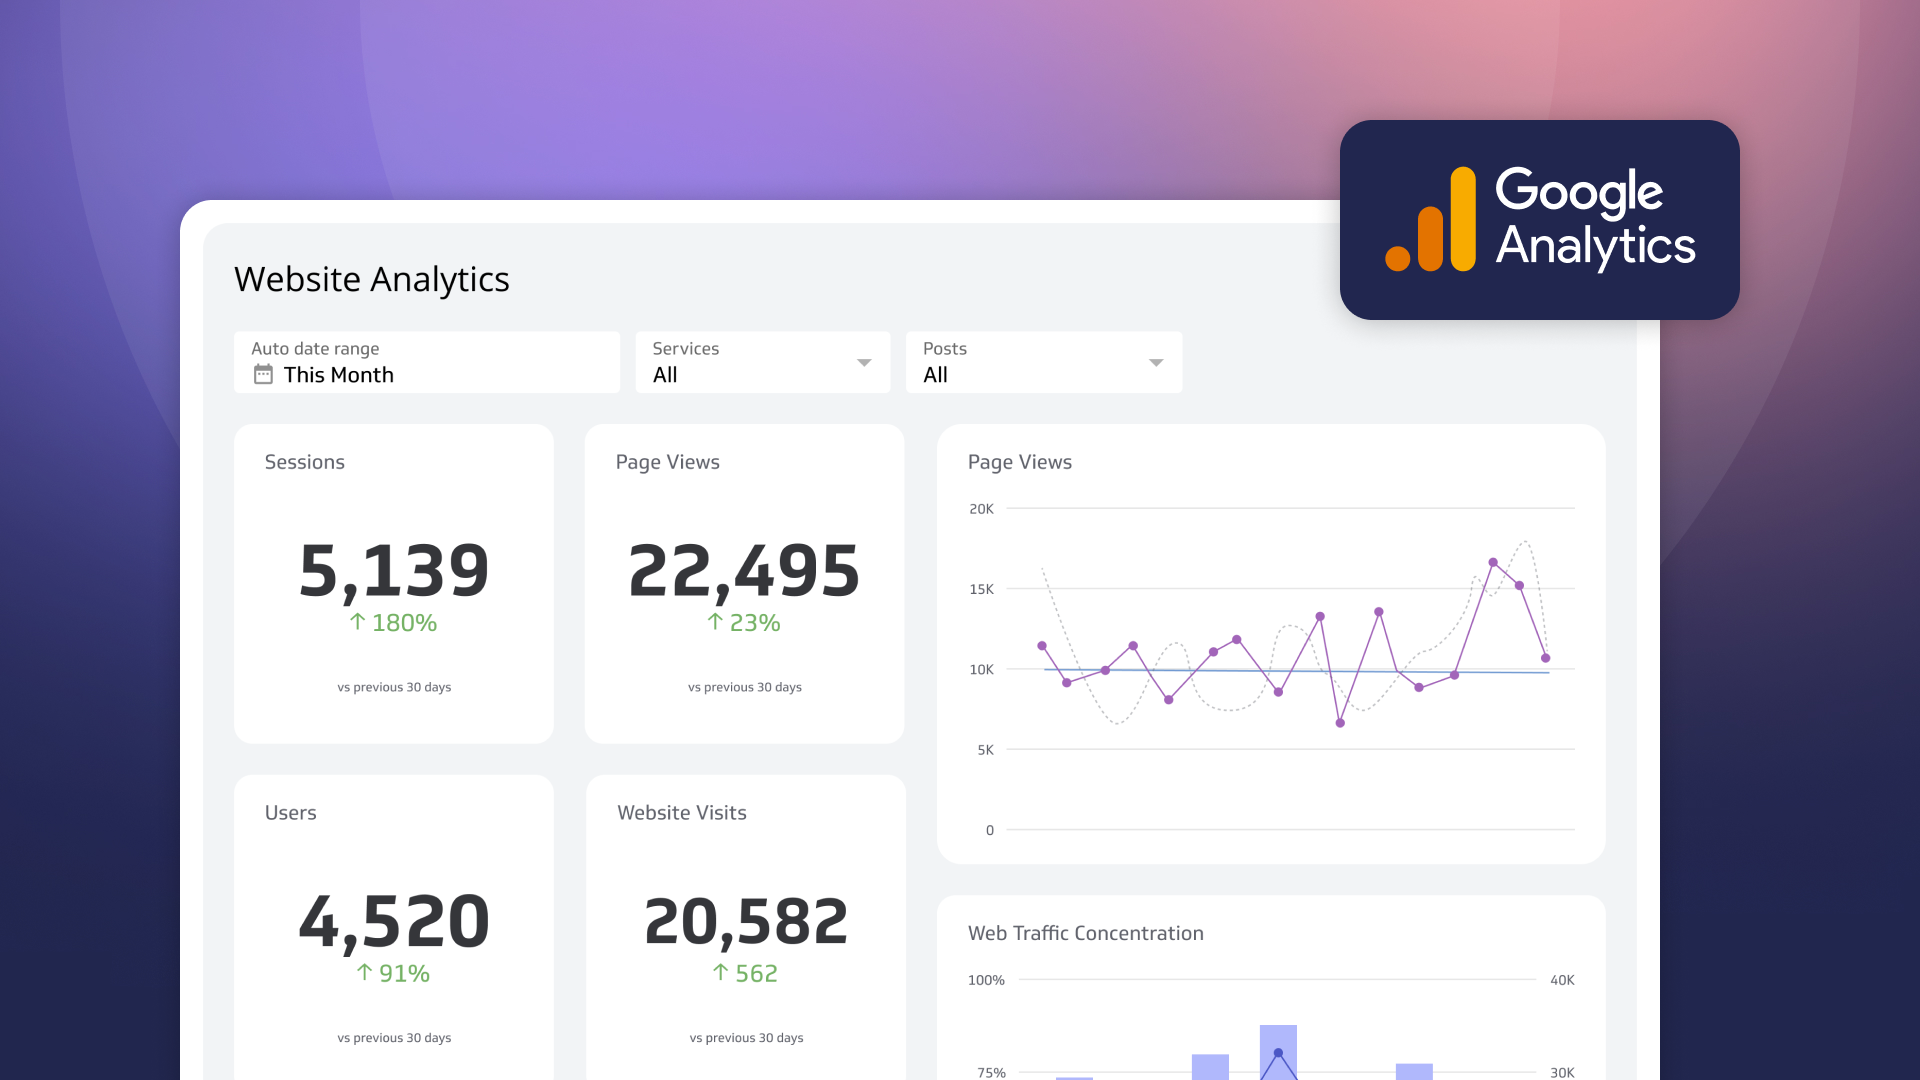
How to use the Google Analytics 4 Query Explorer to export data
By Jonathan Taylor — June 1, 2023

PayTabs embraces a data-driven strategy with KPI dashboards
By Mitch Dupuis — May 21, 2019

The Ultimate Guide for Marketing Your Brand on TikTok
By Emily Hayward — January 11, 2022

How Data Visualization Helps Prevent Cyber Attacks
By Matt Shealy — May 5, 2021

Three Ways Unito Uses Data As Rocket Fuel
By Lauren Thibodeau — September 25, 2020
How we are using A-B testing to refine our pricing model – Part 1
By Allan Wille, Co-Founder — February 26, 2016
How we are using A-B testing to refine our pricing model – Part 2
By Allan Wille, Co-Founder — March 4, 2016

How (and when) to create a custom metric
By Mark Brownlee — January 23, 2019

Misleading Statistics & Data: How To Protect Yourself Against Bad Statistics
By Hassan Ud-deen — March 30, 2020

10 Enterprise Software Applications Every Business Needs
By Jonathan Milne — September 27, 2019
Klipfolio + Zapier = A match made in business dashboard heaven
By Jonathan Taylor — March 3, 2016

With so much data out there, why is there so little trust?
By Allan Wille, Co-Founder — March 23, 2022

7 Data Modeling Techniques For Better Business Intelligence
By Jonathan Milne — September 9, 2019

The Starter Guide to Metrics
By Emily Hayward — June 22, 2022
You've spoken and we've heard you - The re-launch of Klipfolio Desktop
By Parker Selman — April 1, 2023

Unlock Data-Driven Decisions with ChatGPT & MetricHQ
By Nicolas Venne — April 3, 2023

Managing Your Data for Hypergrowth: Insights from a Data-Driven Agency
By Fiona Russell — January 30, 2019

Let’s fix analytics so we can stop asking you for dashboards
By Cathrin Schneider — September 11, 2023

Strategic Planning and The BIG Impact of SMALL Data
By Brett Knowles — December 20, 2018

Maximizing Business Insights: The Power of dbt’s Semantic Layer with Klipfolio PowerMetrics
By Jeroen Visser — November 27, 2023

Top Six Data and Analytics Trends – 2024
By Allan Wille, Co-Founder — December 11, 2023

PowerMetrics Case Study: The Project Booth
By Cathrin Schneider — April 11, 2024

Growth Institute is making data-driven decisions faster with Klipfolio
By Mitch Dupuis — September 17, 2019