Annual Contract Value (ACV)
Date created: Oct 12, 2022 • Last updated: Mar 31, 2023
What is Annual Contract Value?
Annual Contract Value (ACV) is the dollar amount an average customer contract is worth to your company in one year. There tends to be less universal consensus on the definition of ACV compared to some other SaaS metrics, such as Annual Recurring Revenue. For example, some companies include one-time initial charges like setup or training in their ACV calculations, while others don’t.
Annual Contract Value Formula
How to calculate Annual Contract Value
You have 100 customers. 30 signed a 3-year contract with a contract value of $90,000, equivalent to $30,000 / year. 30 signed a 2-year contract with a contract value of $80,000, equivalent to $40,000 / year. 40 signed a 1-year contract with a contract value of $50,000, equivalent to $50,000 / year First Year Annual Contract Value = ( (30,000 x 30) + (40,000 x 30) + (50,000 x 40) ) / 100 customers Year 1 ACV = $41,000 Second Year Annual Contract Value = ( (30,000 x 30) + (40,000 x 30) ) / 60 customers Year 2 ACV = $35,000 Third Year Annual Contract Value = (30,000 x 30) / 30 customers Year 3 ACV = $30,000
Start tracking your Annual Contract Value data
Use Klipfolio PowerMetrics, our free analytics tool, to monitor your data.
Get PowerMetrics Free
What is a good Annual Contract Value benchmark?
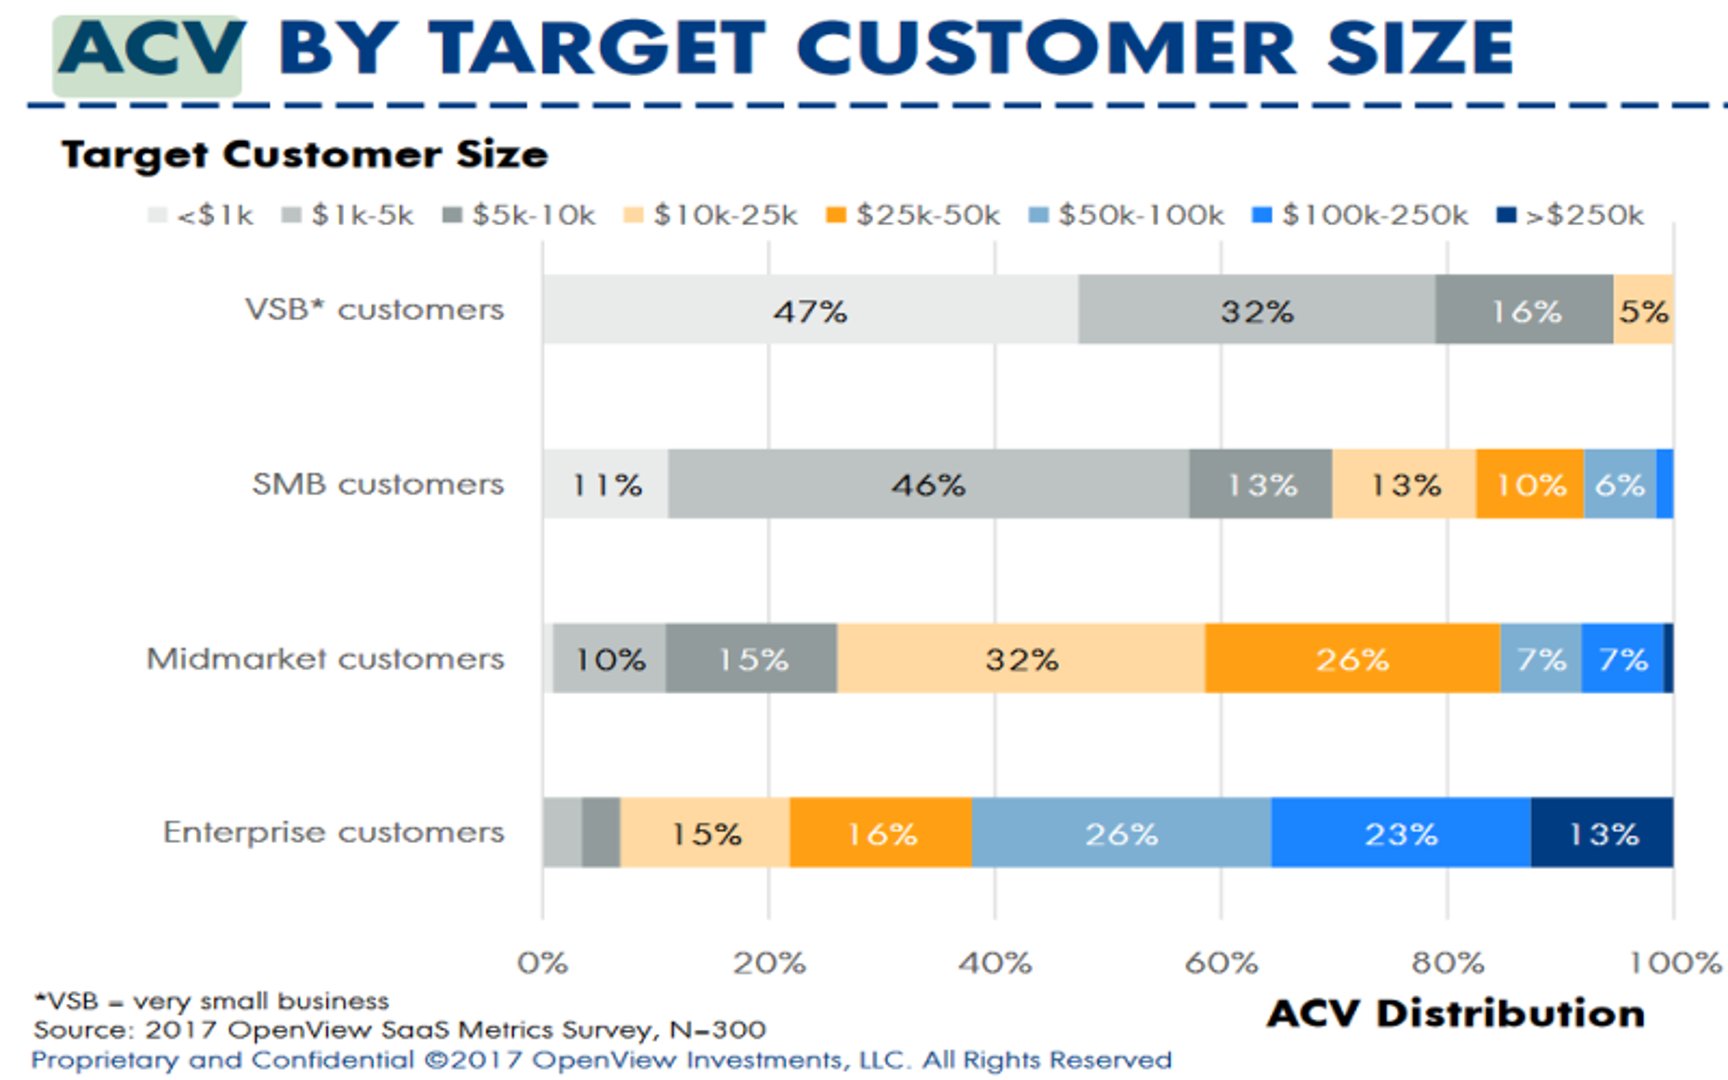
There is really no ACV benchmark, because there’s nothing necessarily good or bad about a high or low ACV. However, a 2017 OpenView SaaS Metrics Survey suggests that most companies that target SMBs have an ACV between $1k and $5k.
Annual Contract Value benchmarks
ACV benchmark by target customer size

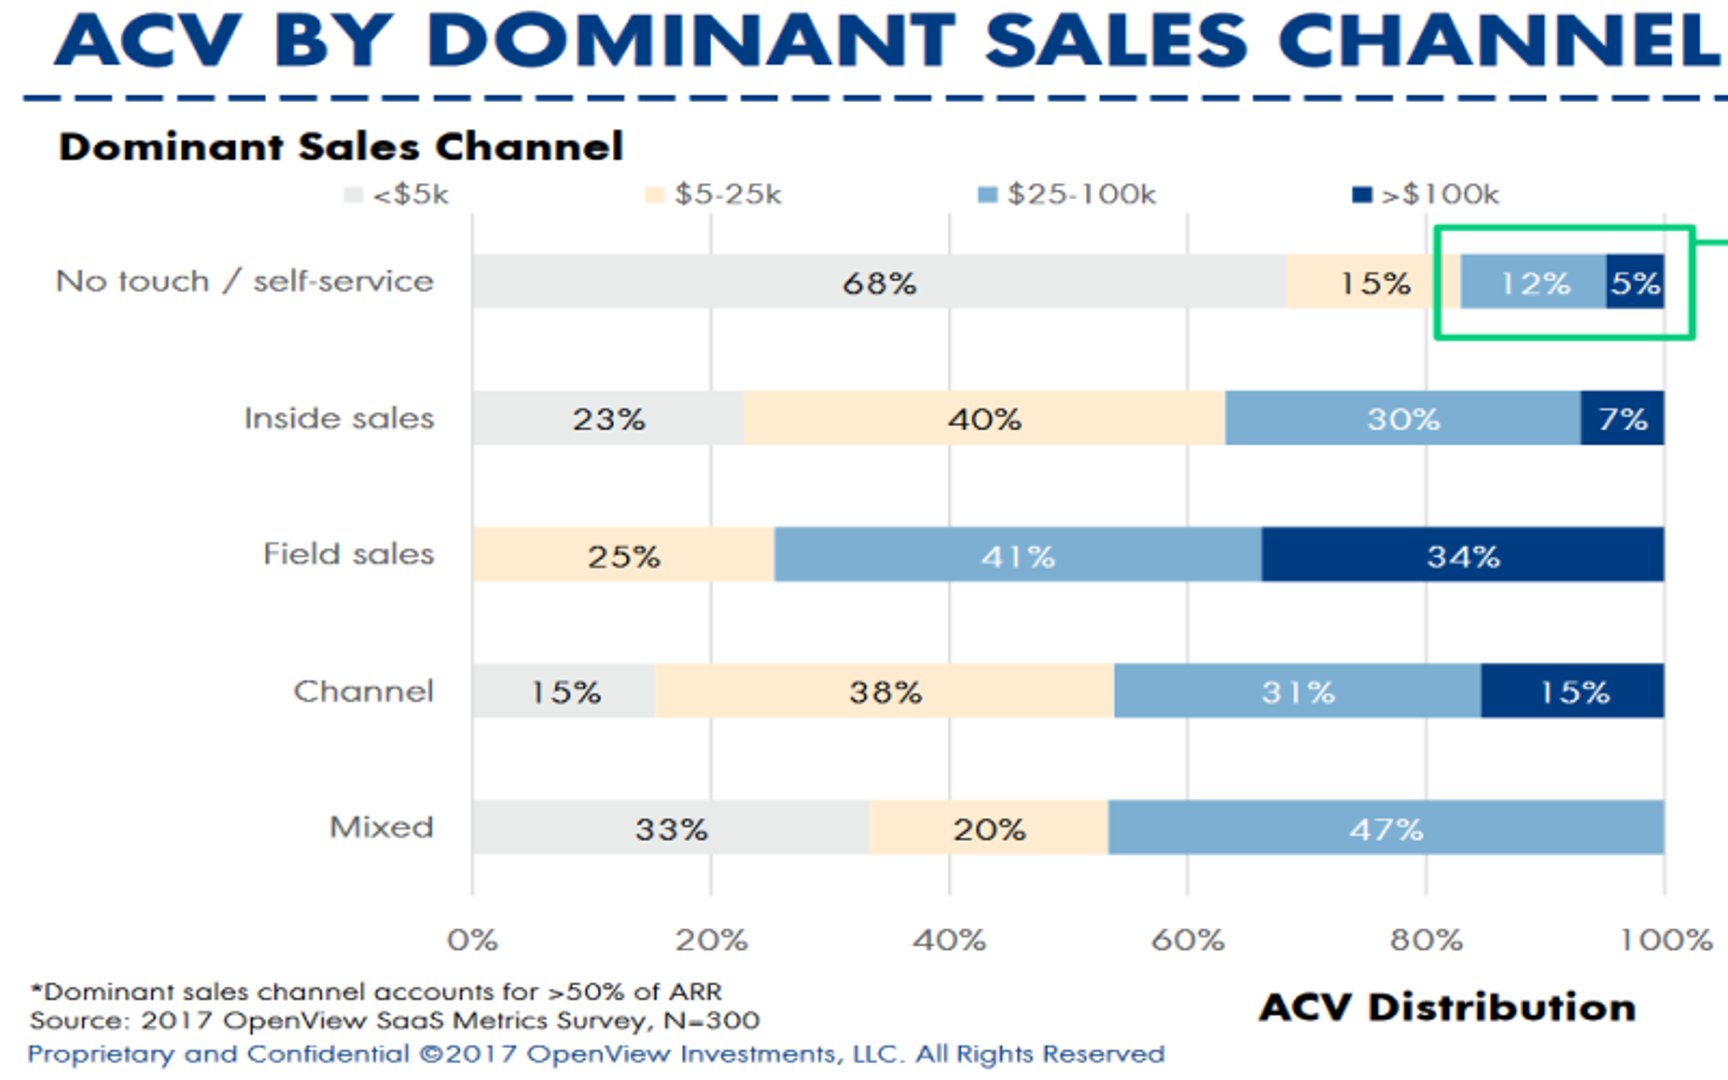
ACV benchmark by dominant sales channel

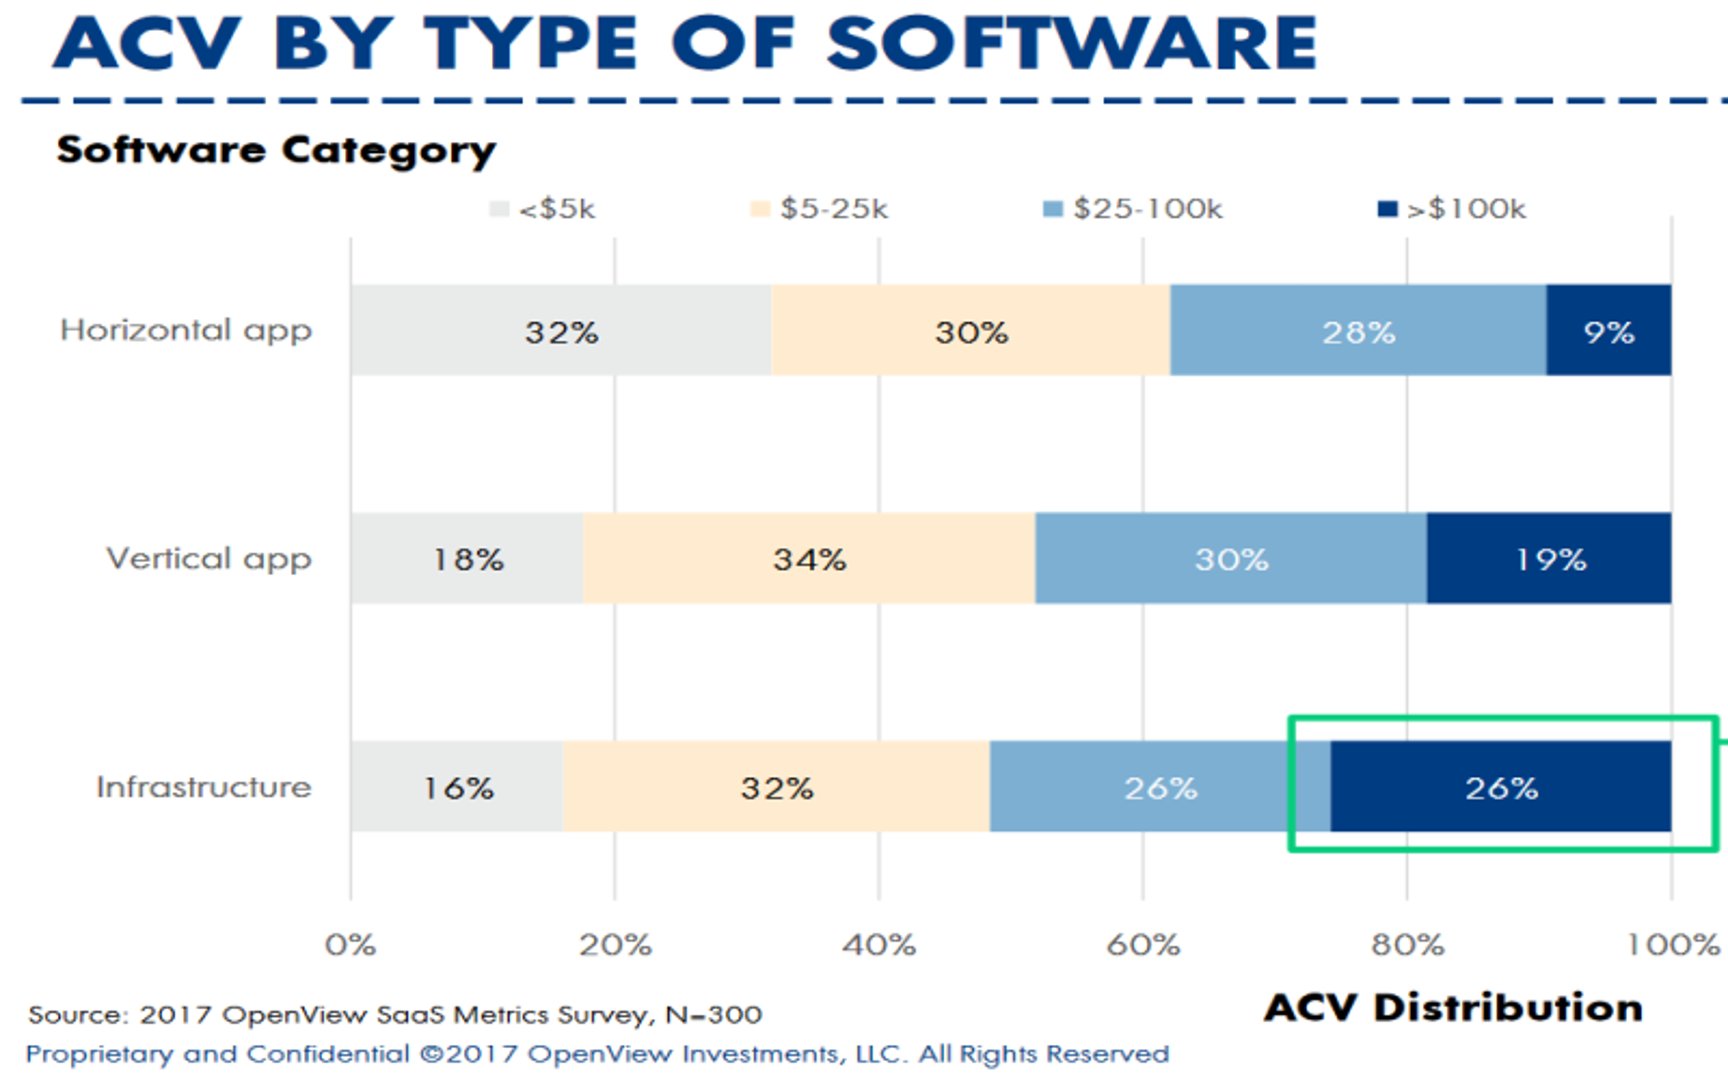
ACV benchmark by type of software

How to visualize Annual Contract Value?
When you start tracking your ACV data, it's best to visualize it as either a summary chart with a year-over-year comparison, or a more historical view with a line or bar chart. Choose a line chart to see changes in your ACV, and a bar chart to segment ACV by target customer type or other relevant segments.
Annual Contract Value visualization examples

Summary Chart
Annual Contract Value
Line Chart
Annual Contract Value
Bar Chart
Annual Contract Value
Chart
Measuring Annual Contract ValueMore about Annual Contract Value
Annual Contract Value (ACV) is sometimes confused with Annual Recurring Revenue (ARR). While the definition and calculation of ACV can vary across SaaS companies, ARR is more consistently calculated. “It's the Revenue equivalent used by every SaaS company”, and doesn’t include things like one-time charges, that ACV can.
In general, here's the definition of ACV: ACV is the average dollar amount brought in by all your customers under contract over the period of one year. ACV is most useful when it’s analyzed in context of other metrics such as revenue retention. Companies are often grouped by ACV band for such analysis.
For example, in a study of 700 B2B SaaS companies, SaaSCapital analyzed Gross Revenue Retention by ACV band. They found that companies with an ACV less than $1000 had Median Gross Retention of 89%. Companies with an ACV over $150,000 had Median Gross Retention of 95%.
Why is this? Lower ACV products are often sold to small and mid-sized businesses, whose financial stability is more precarious than larger enterprises who can afford higher ACV products. As well, switching costs are often much less for lower ACV products than they are for higher ACV products, effectively incentivizing retention for higher ACV products.
Recommended resources related to Annual Contract Value
A good article about ACV by the folks at Lighter CapitalMetric Toolkit
Start tracking your Annual Contract Value data
Use Klipfolio PowerMetrics, our free analytics tool, to monitor your data.
Get PowerMetrics FreeContributor

.jpg)