Post Engagement Rate
Date created: Oct 12, 2022 • Last updated: Oct 12, 2022
What is Post Engagement Rate?
Post Engagement Rate is the ratio of interactions with a social media post to the total number of followers the page or profile has. This metric shows how involved followers are with the content posted on a social media page. Generally, higher Post Engagement Rate shows higher levels of follower involvement.
Post Engagement Rate Formula
How to calculate Post Engagement Rate
A business with 4,000 followers on Instagram has a post which has received 100 likes. The Engagement Rate of this post would be 100/4000 which equals 2.5%. Another less popular post on the same page with only 20 likes would have an Engagement Rate of 0.5%.
Start tracking your Post Engagement Rate data
Use Klipfolio PowerMetrics, our free analytics tool, to monitor your data. Choose one of the following available services to start tracking your Post Engagement Rate instantly.

What is a good Post Engagement Rate benchmark?
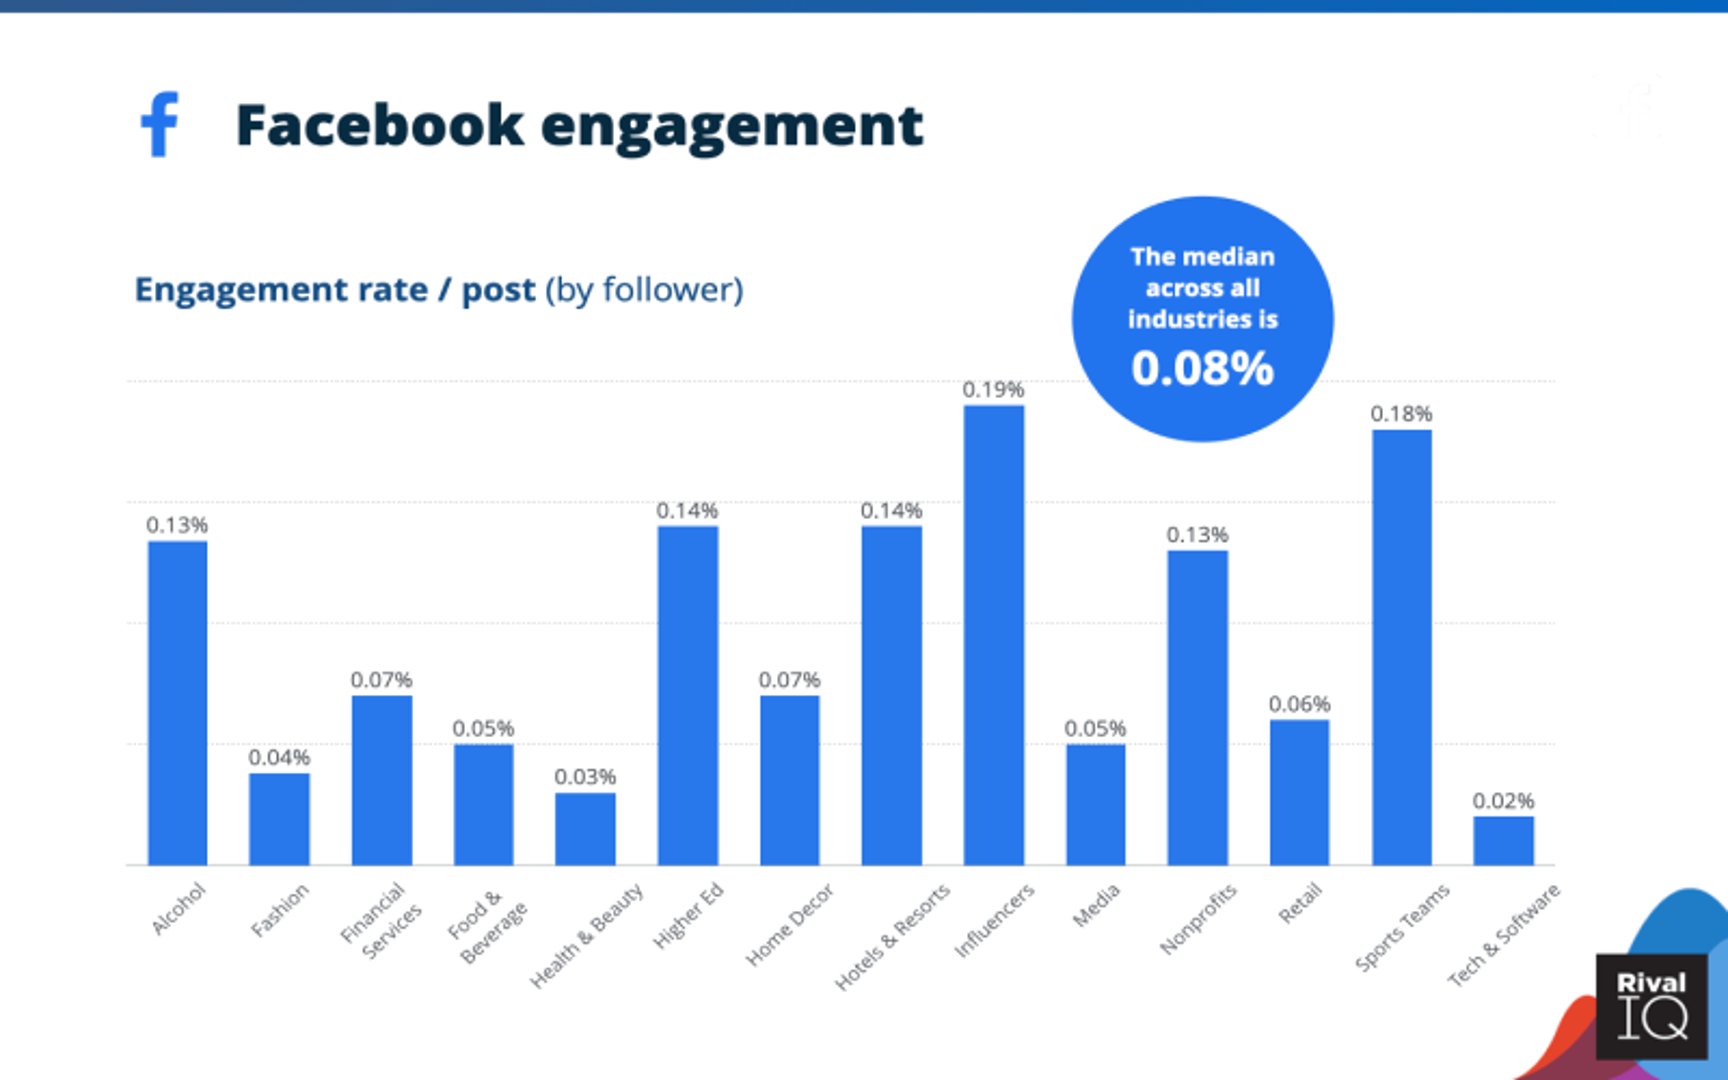
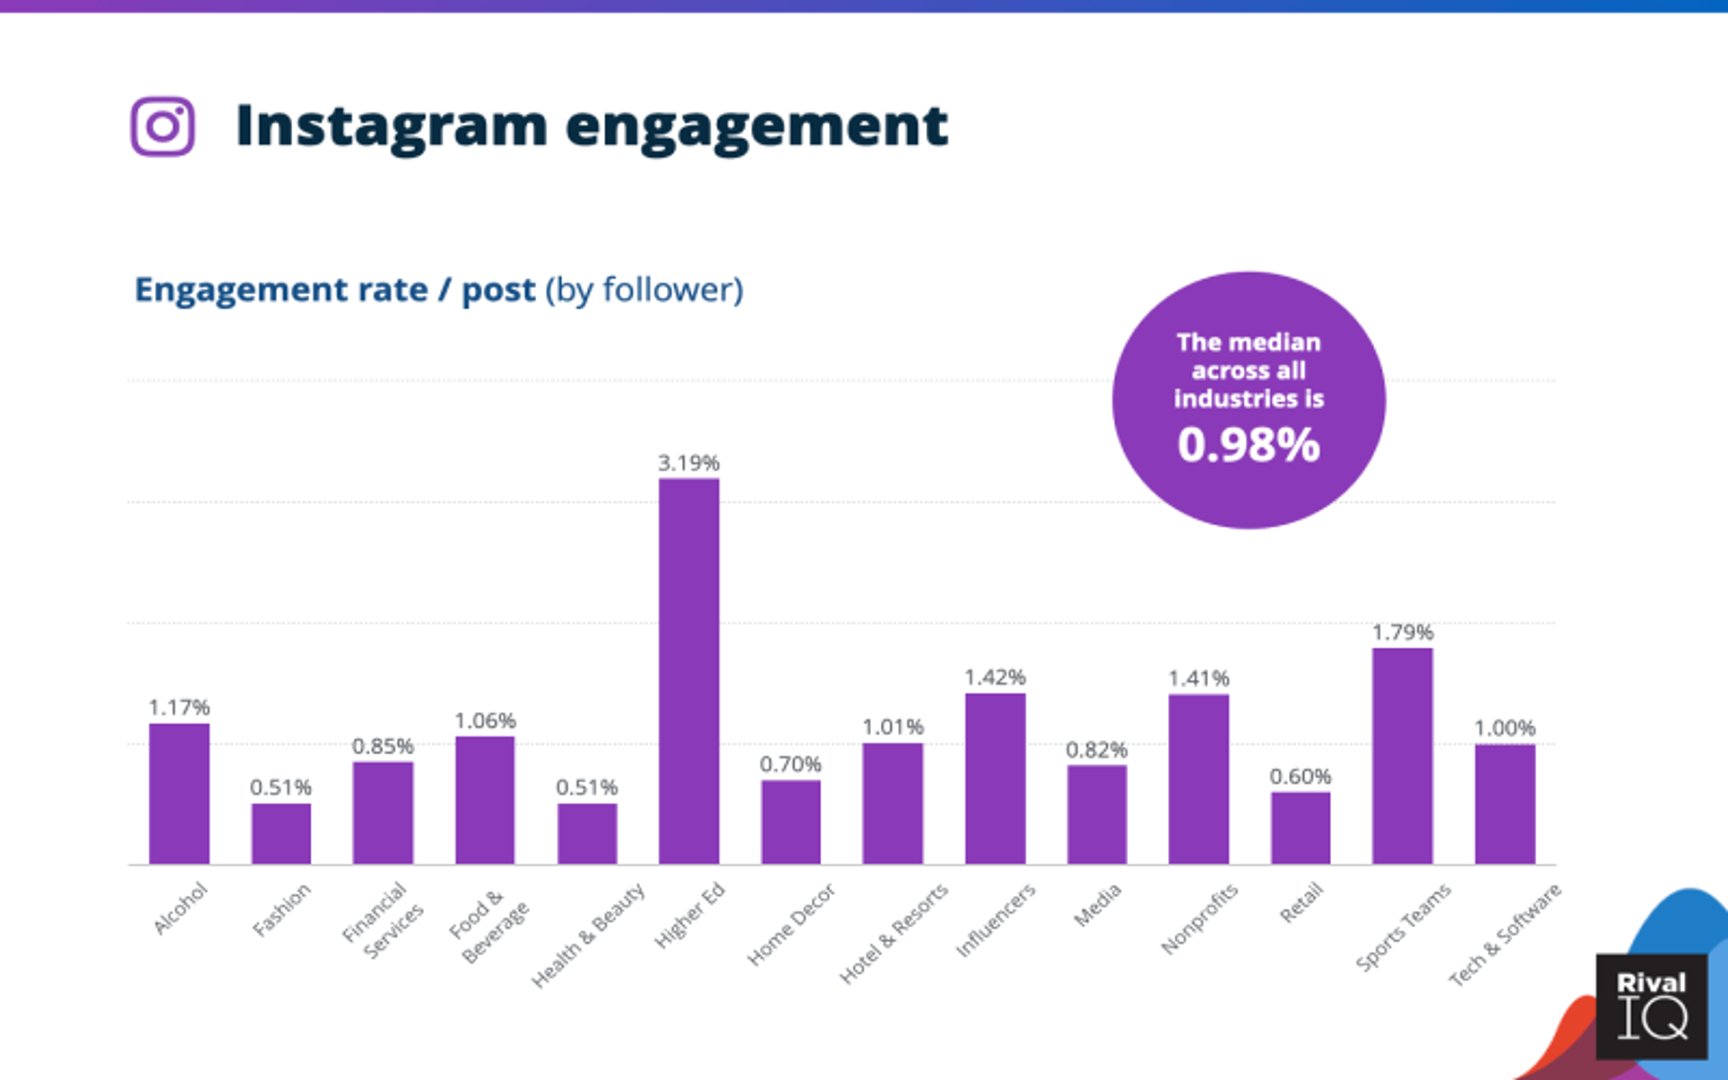
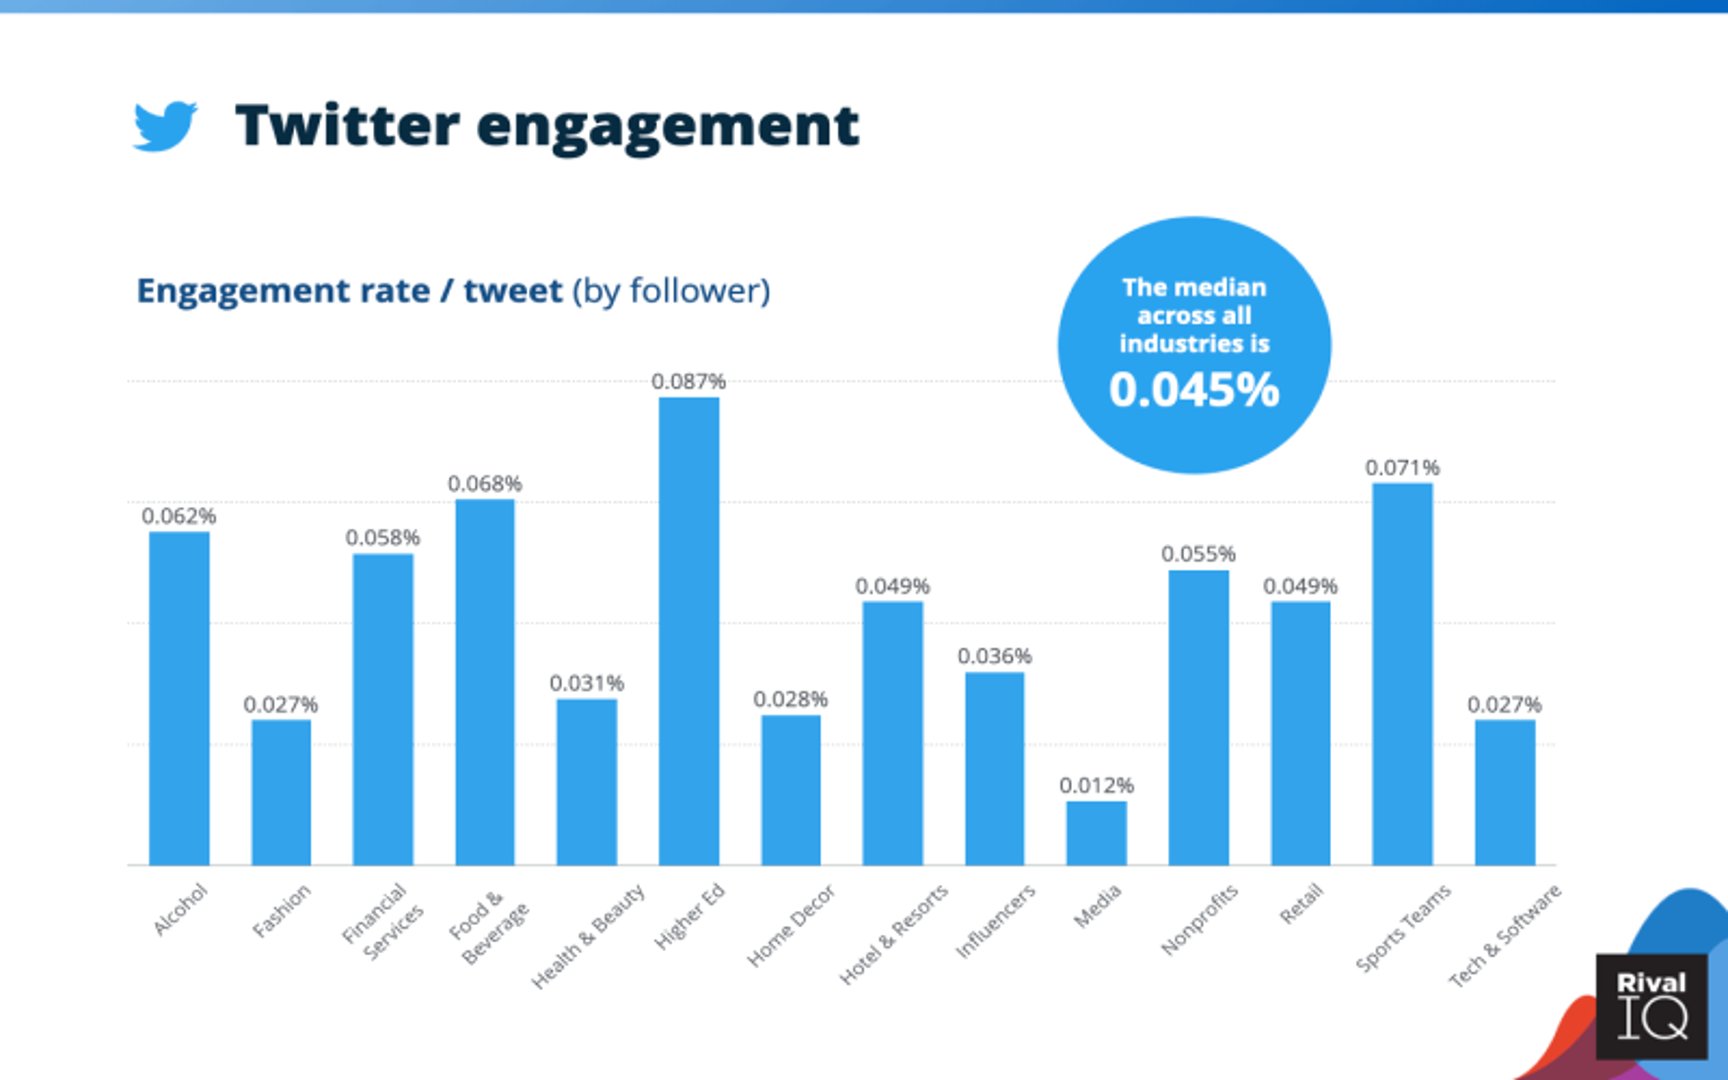
The benchmark for Post Engagement Rate varies across industries and social media platforms and is generally higher on Instagram. For Facebook, the median Engagement Rate is 0.08%, whereas the median is 0.98% for Instagram and 0.045% for Twitter, according to a 2021 Social Media Industry Benchmark Review by RivalIQ.
Post Engagement Rate benchmarks
Facebook Engagement Rate by Industry

Instagram Engagement Rate by Industry

Twitter Engagement Rate by Industry

How to visualize Post Engagement Rate?
A line chart can help you optimally visualize your Post Engagement Rate data by letting you see how this metric trends over time. You can then adjust your strategy to meet your goals.
Post Engagement Rate visualization example
Post Engagement Rate

Line Chart
Post Engagement Rate
Chart
Measuring Post Engagement RateMore about Post Engagement Rate
Social media platforms host millions of accounts, each vying for the attention and followership of consumers who have endless options. In the highly competitive environment of social media marketing, generating post interactions is the end goal of increasing follower count.
Post Engagement Rate is the ratio of post engagement to the total number of followers the page or profile has. This metric shows how involved followers are with the content posted on a social media page. Generally, higher Post Engagement Rate shows higher levels of follower involvement.
This metric differs based on the social media platform, brand awareness, target audience, and industry. However, it allows businesses of different sizes to utilize a single, comparable metric.
Post Engagement Rate can indicate several different things about a social media page:
- Low Engagement Rate with high follower count may suggest that users do not find the content interesting or that there are many “bot” followers.
- High Engagement Rate with high follower count is the optimal scenario; the page is popular, and followers enjoy interacting with the content.
- High Engagement Rate with low follower count indicates that the page does not have a wide reach. It may also indicate that the page is newly created.
- Low Engagement Rate with low follower count shows that the page may benefit from changes in content and visibility generating options such as hashtags. This is also likely for a page that is only several days old.
Table 1: The Implications of Engagement Rate versus Follower Count
| Low Engagement Rate | High Engagement Rate | |
|---|---|---|
| Low Follower Count |
|
|
| High Follower Count |
|
|
Metric Toolkit
Start tracking your Post Engagement Rate data
Use Klipfolio PowerMetrics, our free analytics tool, to monitor your data. Choose one of the following available services to start tracking your Post Engagement Rate instantly.
Contributor

