Real-time dashboards are making work life easier for an Office Manager at Resolute Recruiting

Published 2019-02-20, updated 2023-07-20

Summary - Think of data visualization like a car dashboard. When you are driving, you only really need to keep an eye on a few key data points.
Resolute is a recruiting agency that specializes in construction, oil & gas services, and oil & gas exploration and production. They currently have four teams and hope to add two additional teams to their company by the end of the year.
Meet Elizabeth…
Elizabeth Pugh Ruiz is the Office Manager at Resolute Recruiting USA. She is kicking it solo on the team so she has no issue keeping busy during the day. Her job is a vital one and consists of ensuring the office runs smoothly. Her specific job responsibilities range anywhere from keeping the coffee well stocked, to finding information on potential candidates before the screening process, to identifying and maintaining data that allows their company to see where they are with their workflow and production.
Elizabeth is also a key dashboard builder in the company.

Change was in order
Elizabeth wasn’t always the ‘Dashboard Guru’ at Resolute. Before she got into the dashboard building game, Resolute Recruiting was working with another service company that would pull information from their Google Sheets and display it in a very similar fashion to Klipfolio. This approach to dashboarding came with a list of limitations.
“We needed to have total control over our dashboards, and we needed to be able to do it without extensive (and expensive) training.”
At the time, they would have to wait anywhere from three days to two weeks for major changes to the dashboard to happen and were sometimes paying thousands of dollars for a single edit to their visualizations. They would often wait until they had multiple changes that needed to be made in order to keep costs down, which resulted in their dashboards being out of date and inaccurate.
This pretty much defeats the purpose of having dashboards altogether, am I right!?
“When I was hired, I was asked to find an alternative dashboard solution and landed on Klipfolio. I was immediately a fan and had no trouble setting up a basic dashboard within hours of signing up for the trial.”
Elizabeth saves the day!
It’s exciting when you become the company hero.
“After switching to Klipfolio, we’re spending a fraction of the cost of what we were previously paying.”
It can also be fun.
“Playing with Klipfolio is one of the most enjoyable aspects of my job and there are times I will go onto Klipfolio just to play with it and see what I can make it do.”
Elizabeth claims that Klipfolio’s onboarding process and training has eased the pain of setting up new visualizations for when a new team member joins the company or when a new KPI is introduced. Gone are the days when Resolute had to pay a hefty bill and wait weeks for basic dashboard edits to be completed.
KPIs don’t need to be complex in order for them to be effective
Currently, Resolute uses Klipfolio to display their YTD (year-to-date) and MTD (month-to-date) overall production as well as each individual team member’s production. The YTD and MTD dashboards also display the employee’s name and photo to add a personal touch and they even highlight the top performers using the indicators feature.
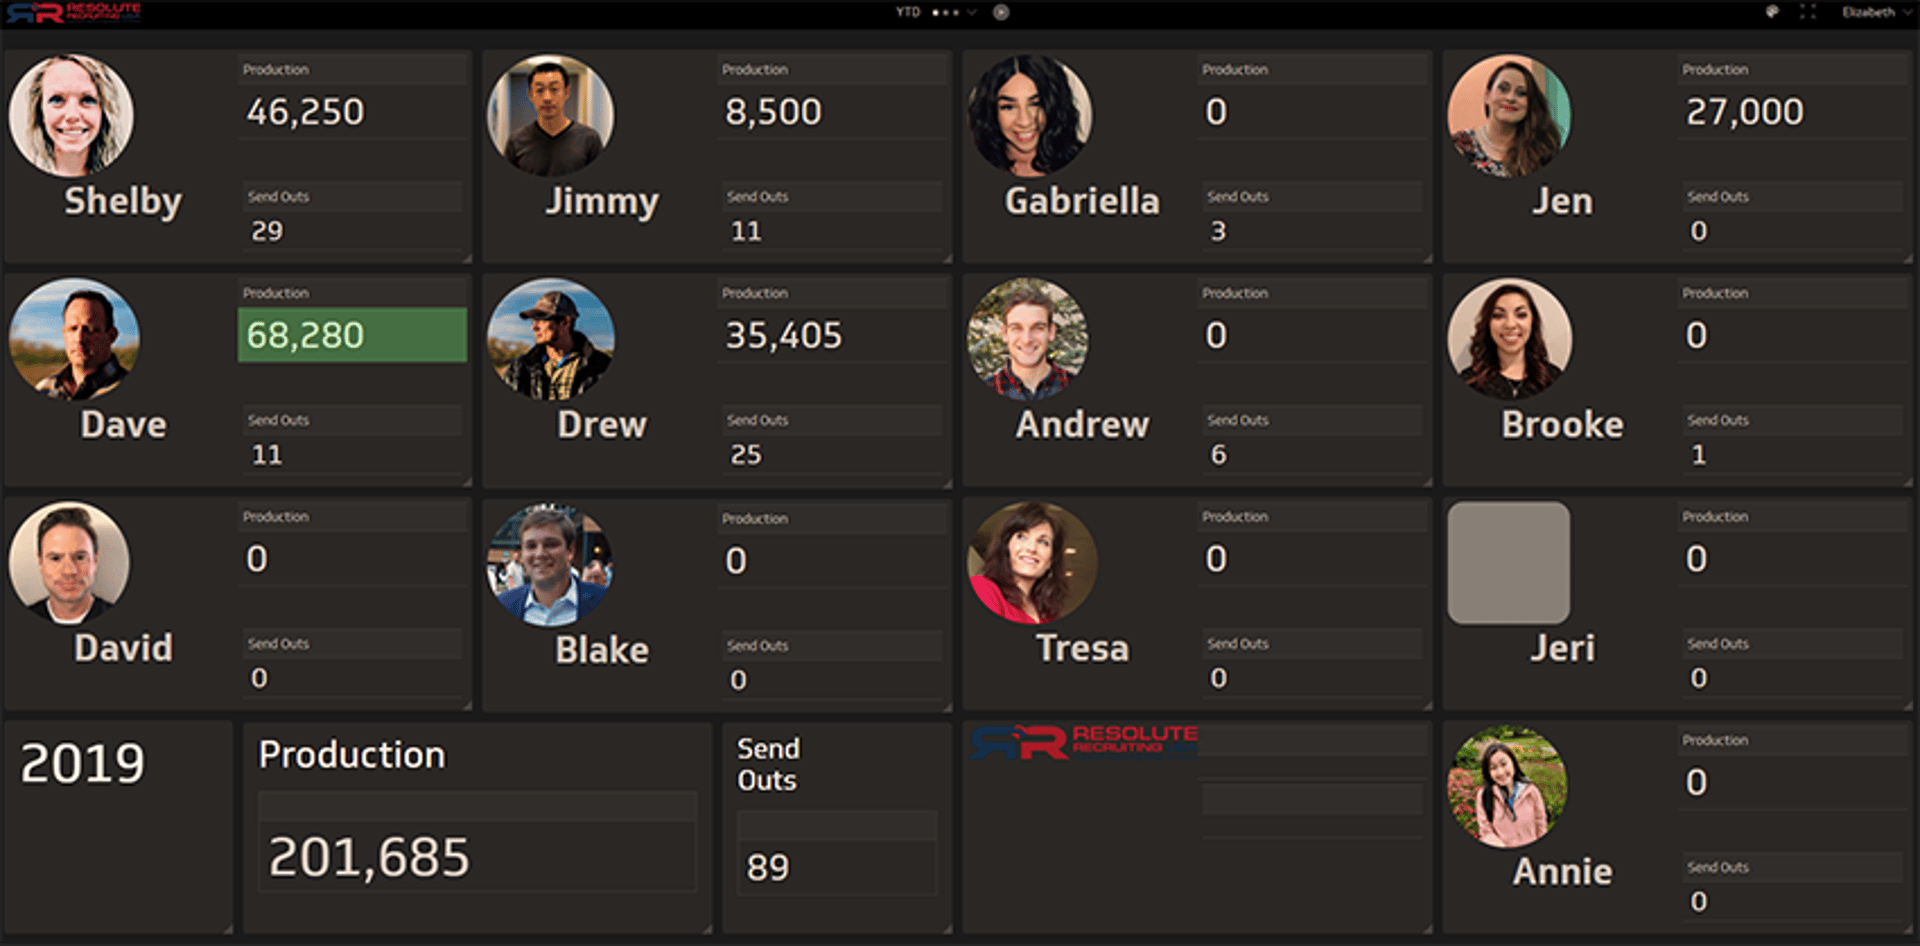
“Compared to what the product can do, our dashboards are relatively simple. I’ve explored other ways to display the information, mainly charts that compare current production to past production. I know I haven’t even scratched the surface and I hope to further utilize Klipfolio’s features and functionality in the near future.”
I personally like to think of data visualization like a car dashboard. When you are driving, you only really need to keep an eye on a few key data points like speed, gas tank level, oil level, engine temperature, and kilometres travelled in order to stay safe, efficient, and comfortable on the road.
Identifying and tracking your KPIs should be just as simple when starting out. All you have to do is figure out the most important things you need to focus on and prioritize those. Your KPIs should inspire action; like when your gas light flashes red, you know to pull over at the next service station to fill up. Elizabeth has done a stellar job at working with her team on defining the company’s most important metrics and displaying them on beautiful dashboards in a way that is easy to consume at-a-glance in real-time.
It’s important to note that Elizabeth didn’t have to tackle this dashboard project on her own. She had a little help from her friends on the Klipfolio support team.
“Klipfolio’s customer support is stellar and the product is very intuitive.”
Specifically, she loves the copy and paste source code feature that allows her to create multiple identical Klips without having to recreate the Klip over and over again. A huge time saver.
Office culture is alive and well at the Resolute Recruiting HQ
This team works hard. Very hard. Having data visualizations that allow them to see the fruits of their labor is extremely important to the team.
“We try our best to balance out the weight of our workload with an easy environment that’s fun, enjoyable, and relaxed.”
You will always hear music playing in the background of the office and each employee has access to the in-house Bluetooth speaker so everyone gets a chance to crank the tunes they love. They recognize the necessity of separating their work life from home life and take pride in respecting each and every team member as an adult, and more importantly as a human.
“We all have families, we all have lives outside of this place. We’re all friends, and we all spend time with one another outside of the office on a regular basis. It’s all about finding a happy balance.”
Related Articles

PowerMetrics Case Study: The Project Booth
By Cathrin Schneider — April 11th, 2024

Let’s fix analytics so we can stop asking you for dashboards
By Cathrin Schneider — September 11th, 2023
Secure and accessible dashboards for your extended team
By David Mennie — April 25th, 2023
Guide to migrating your digital marketing dashboards to Google Analytics 4
By Jonathan Taylor — February 13th, 2023