Facebook Analytics Dashboard
Monitor your campaign performance with a Facebook dashboard to track key engagement metrics.
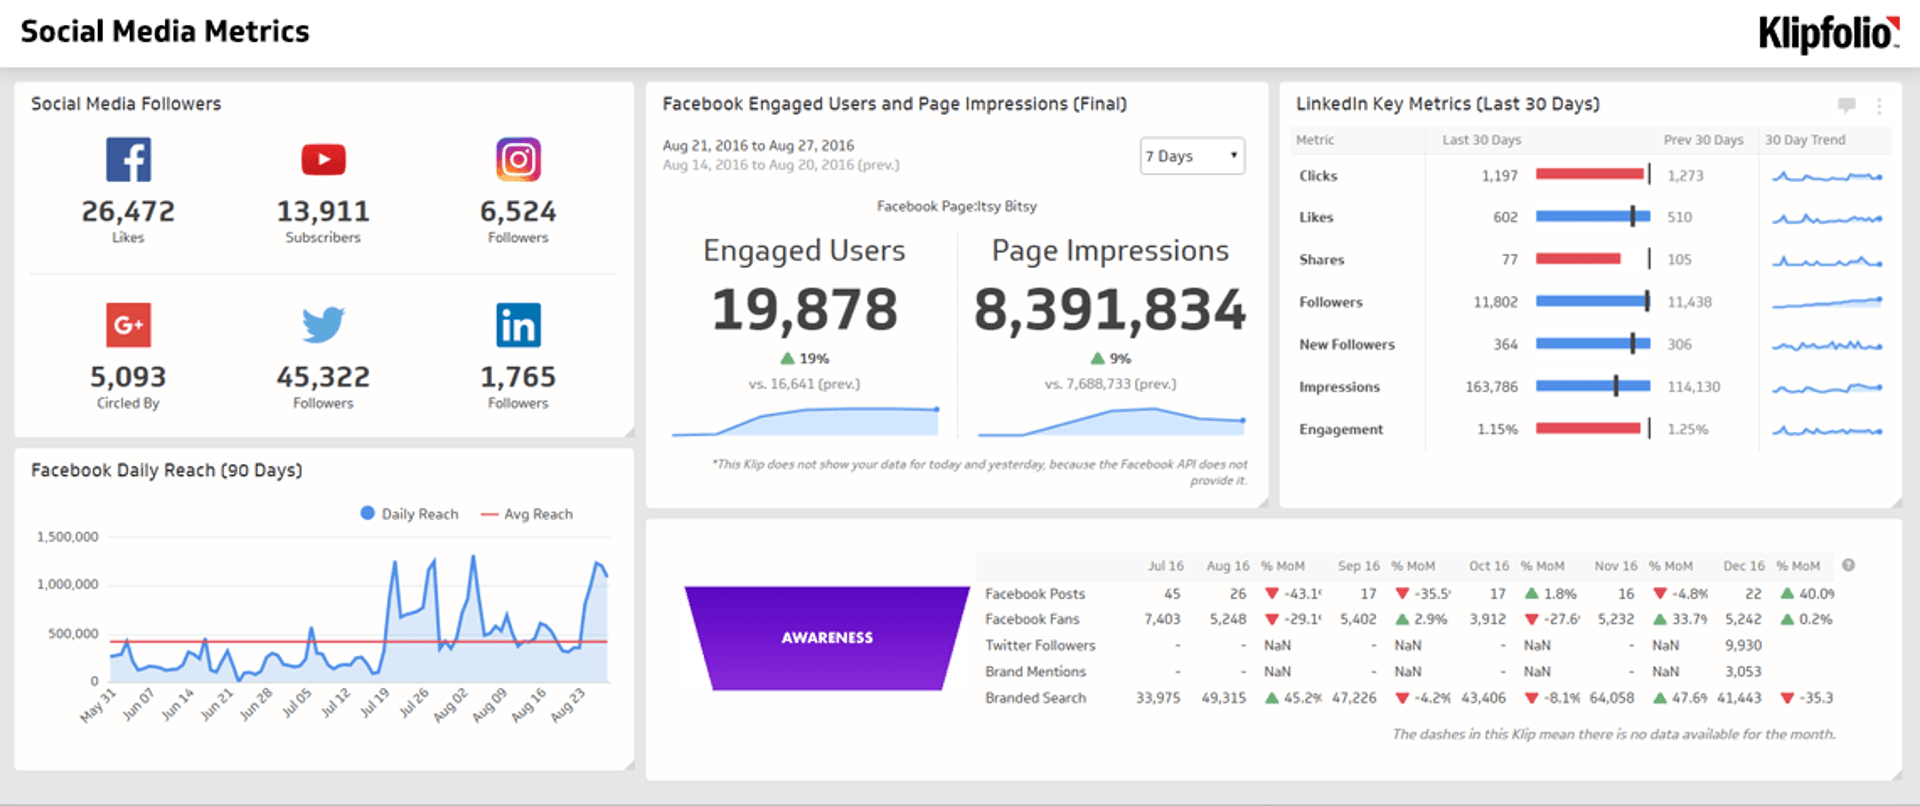
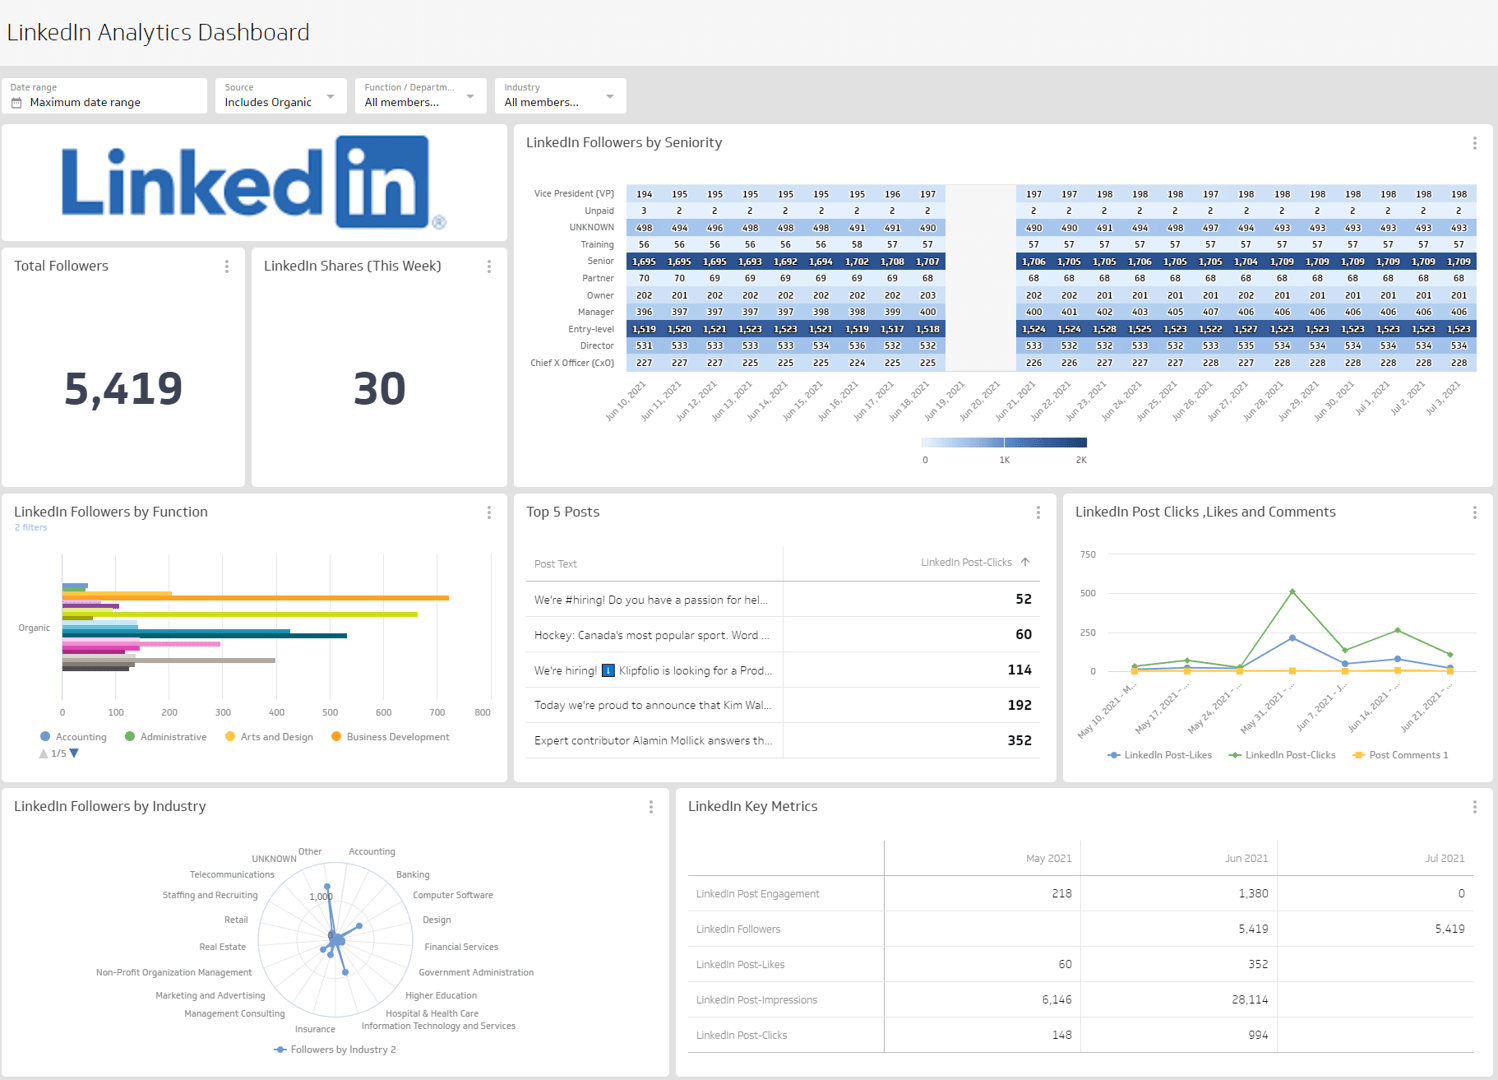
Track all your Facebook Analytics KPIs in one place
Sign up for a 14-day free trial and start making decisions for your business with confidence.
What is a Facebook Analytics dashboard?
A Facebook Analytics dashboard is a visual reporting tool that displays the metrics and KPIs related to your Facebook Page. Tracking your Facebook Analytics allows you to answer questions like:
- How is my audience engaging with my content?
- How many new followers does my page gain each week?
- How many people is my content reaching?
- Is my audience engaging with my content actively (leaving comments) versus passively (liking posts)?
A Facebook Analytics dashboard will provide you with actionable insight on your organic social media strategy.
What metrics should be included on a Facebook Analytics dashboard?
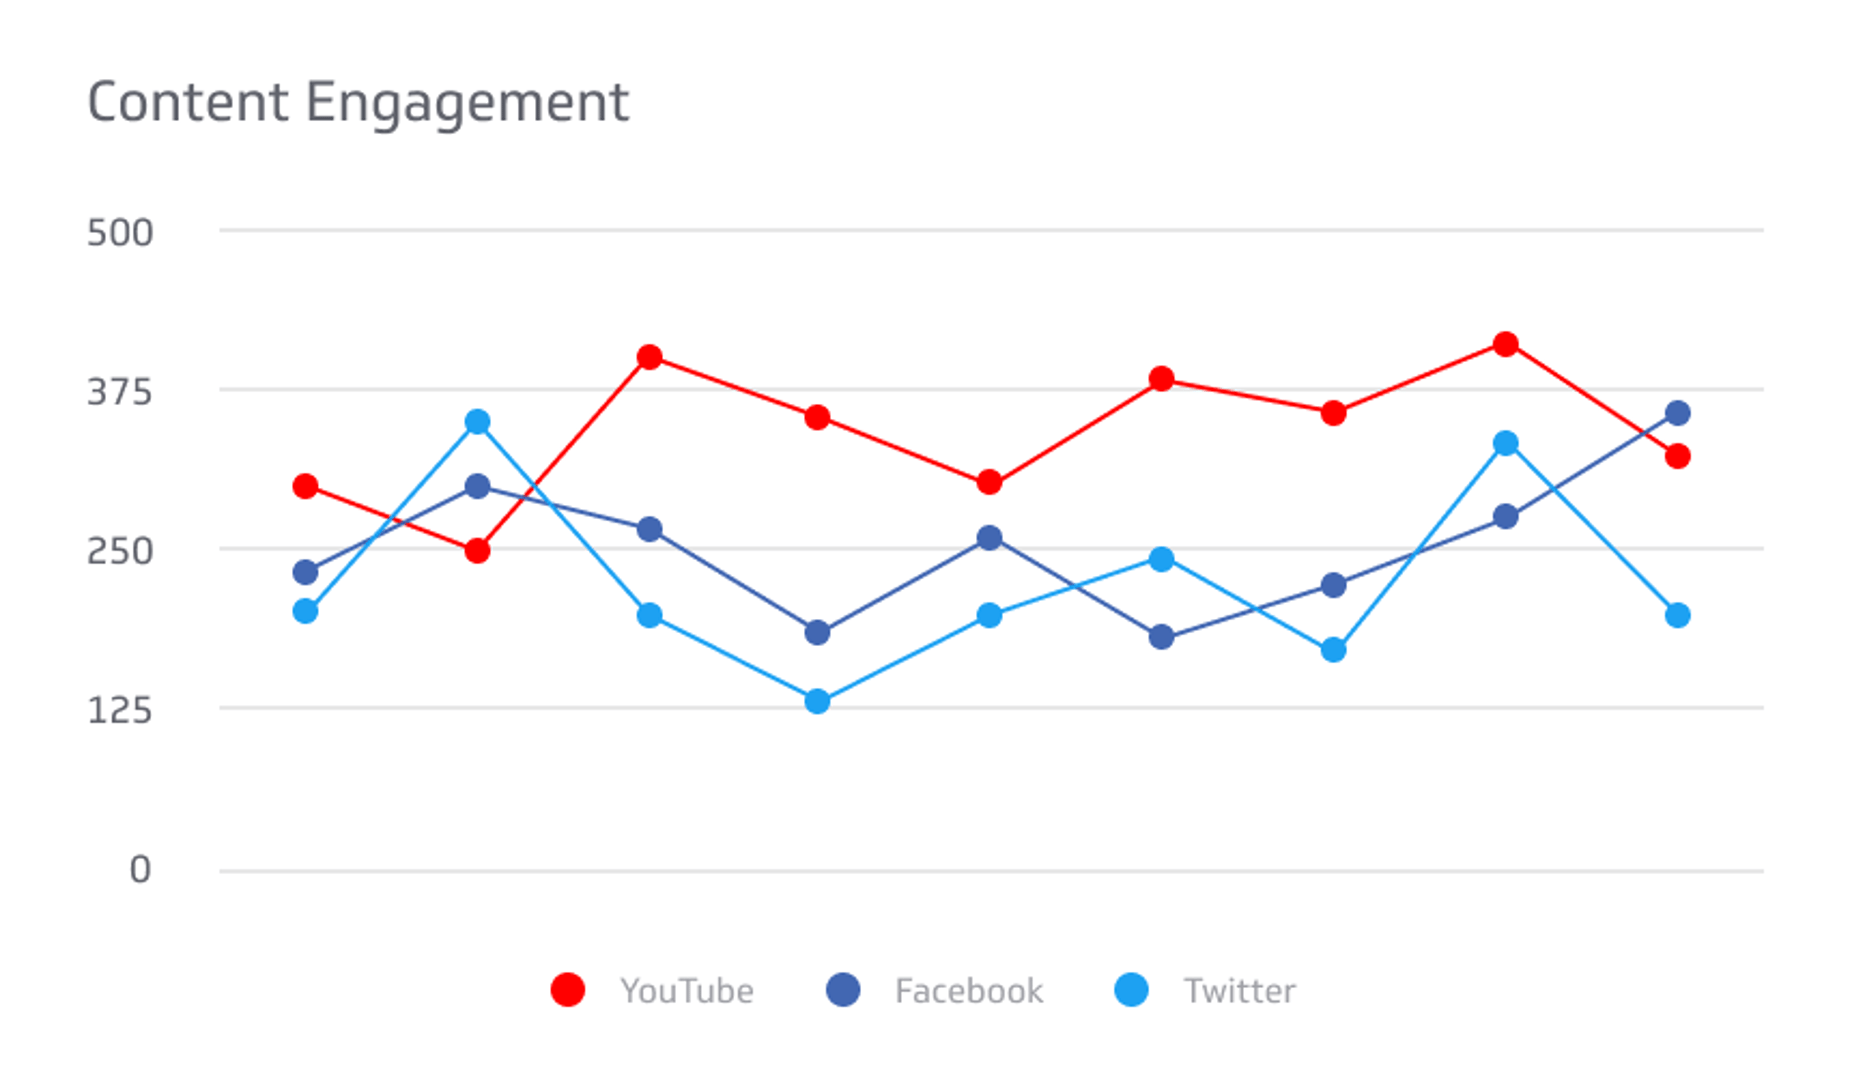
Content Engagement
Content Engagement measures all engagements resulting from content generated in a social media account.
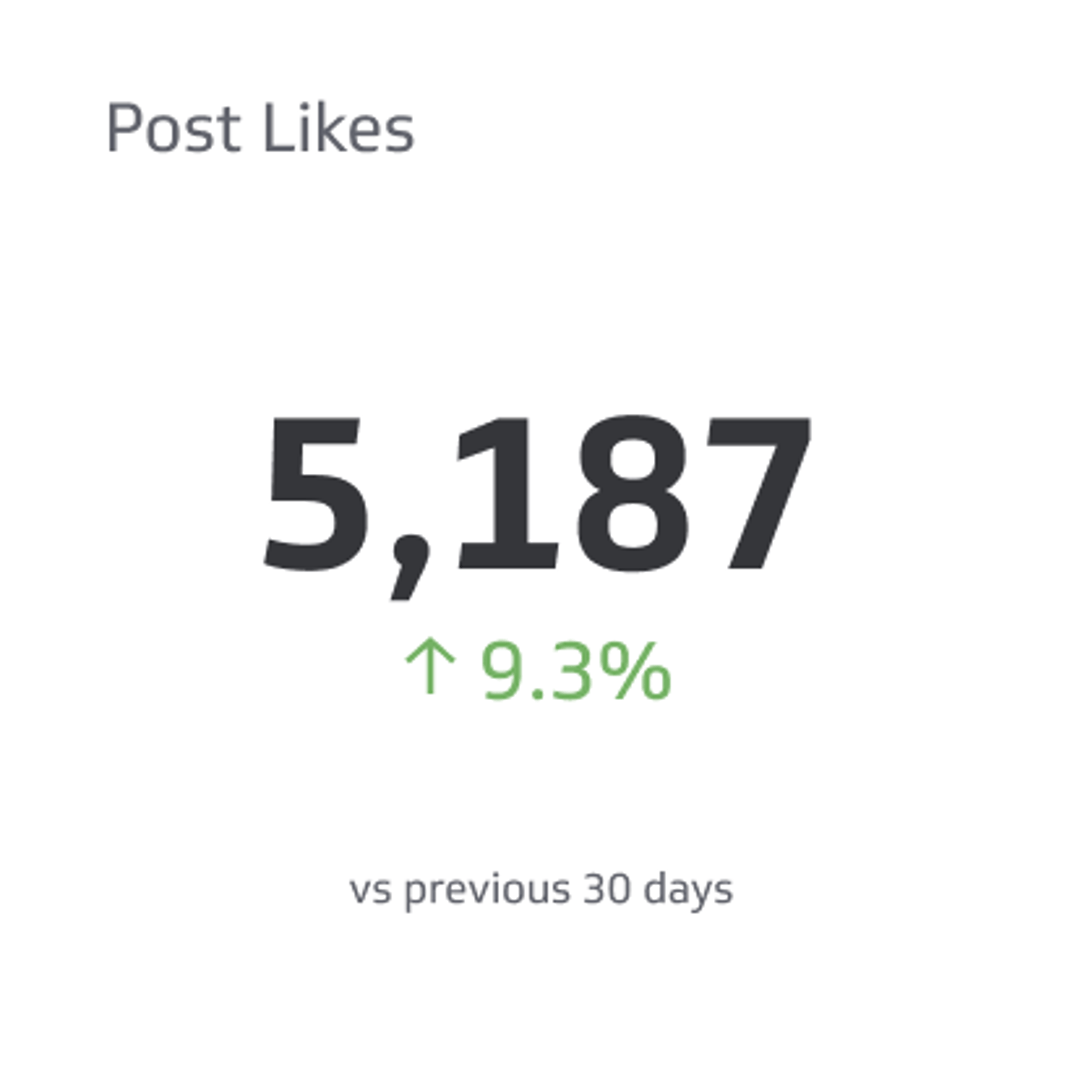
Post Likes
Post Likes is a measure of the popularity of social media content on platforms such as Facebook and Twitter.
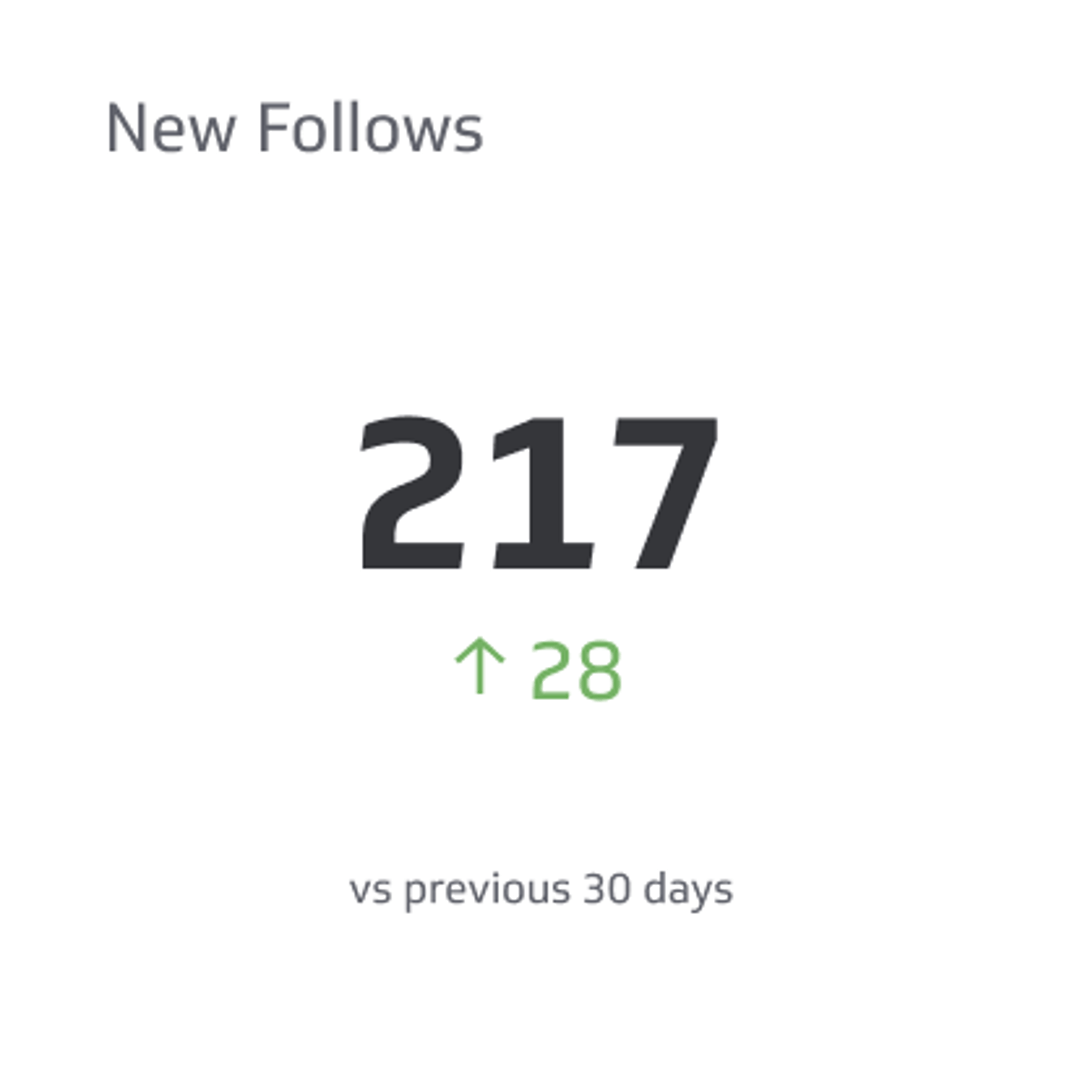
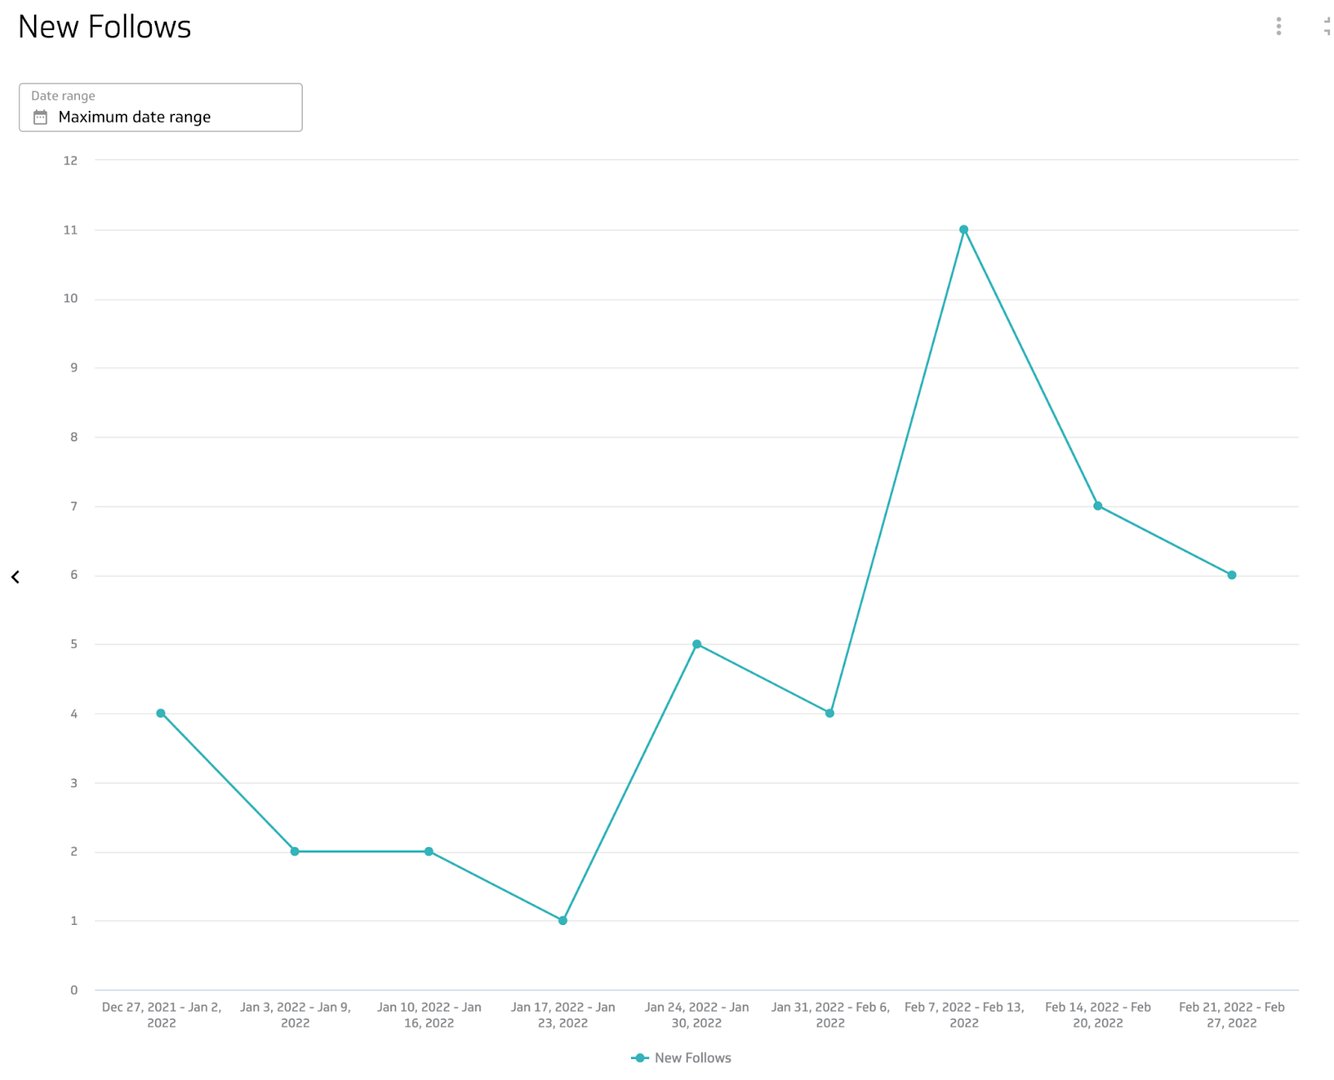
New Follows
This metric measures the number of New Followers you've gained on a specific social platform over a given period of time.
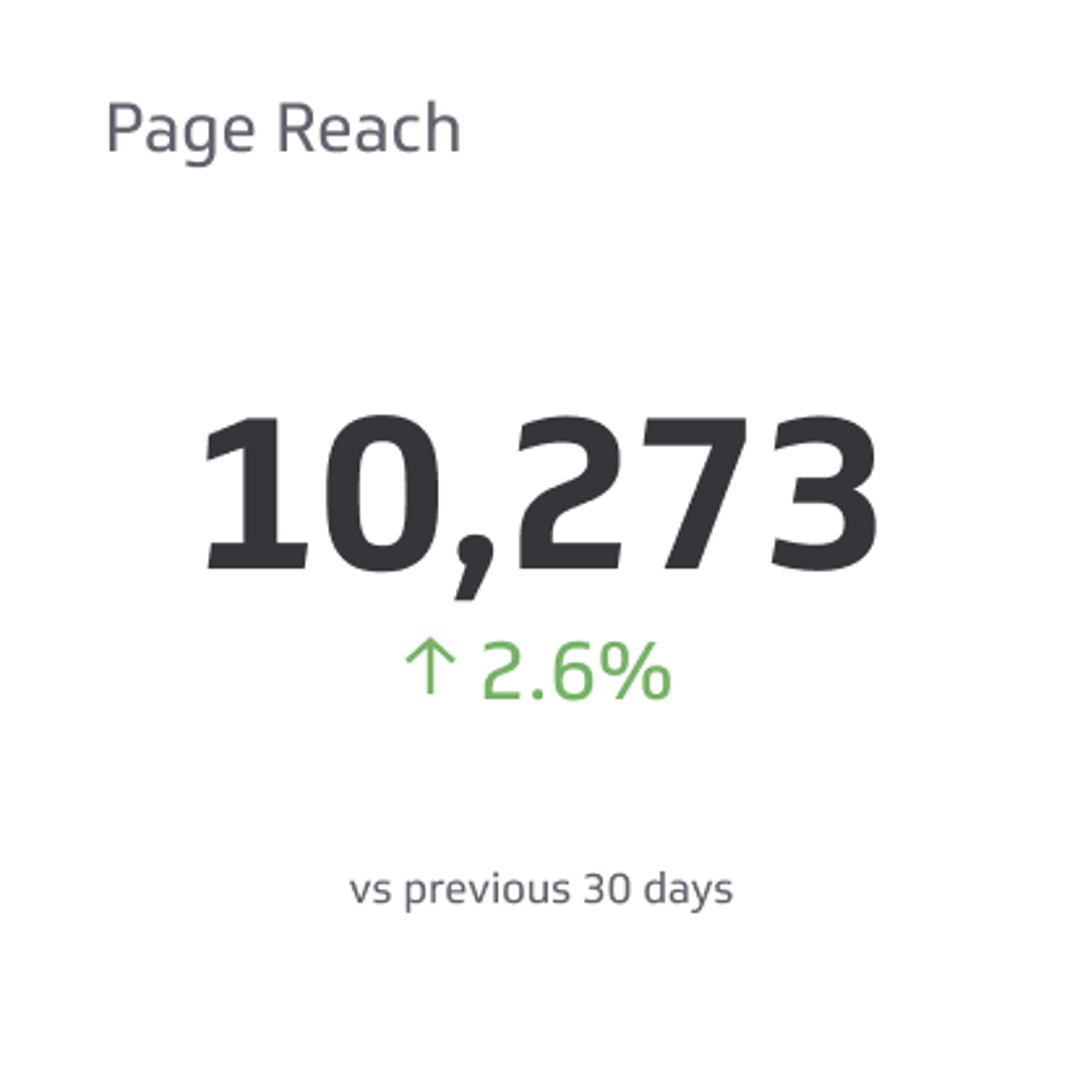
Page Reach
Page Reach is the number of unique users that have seen posts or any other information or content from your social media page at least once.
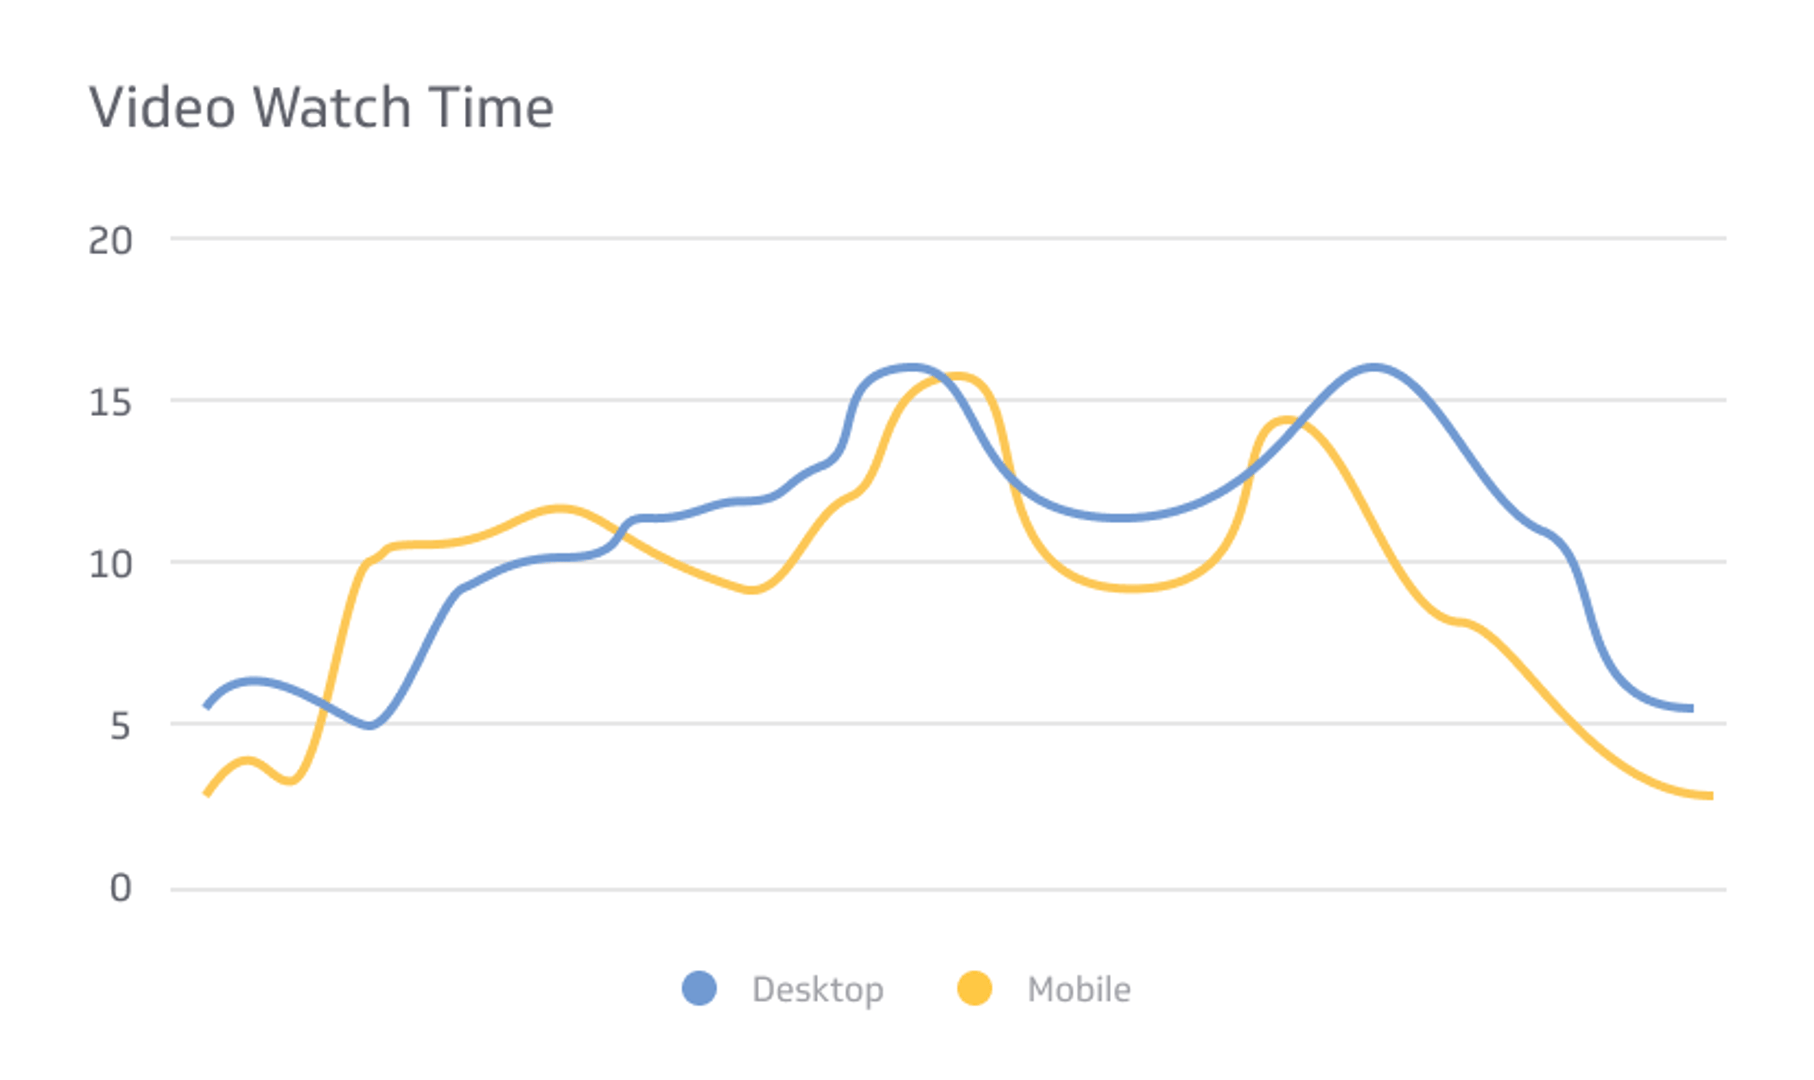
Video Watch Time
Page Reach is the number of unique users that have seen posts or any other information or content from your social media page at least once.
What type of visualization works best on a Facebook Analytics dashboard?
When you’re exploring data visualizations, it’s key to consider the goal of your dashboard. Are you building a dashboard to compare time periods, observe relationships, or summarize data? These are all important considerations when picking your data visualization types.
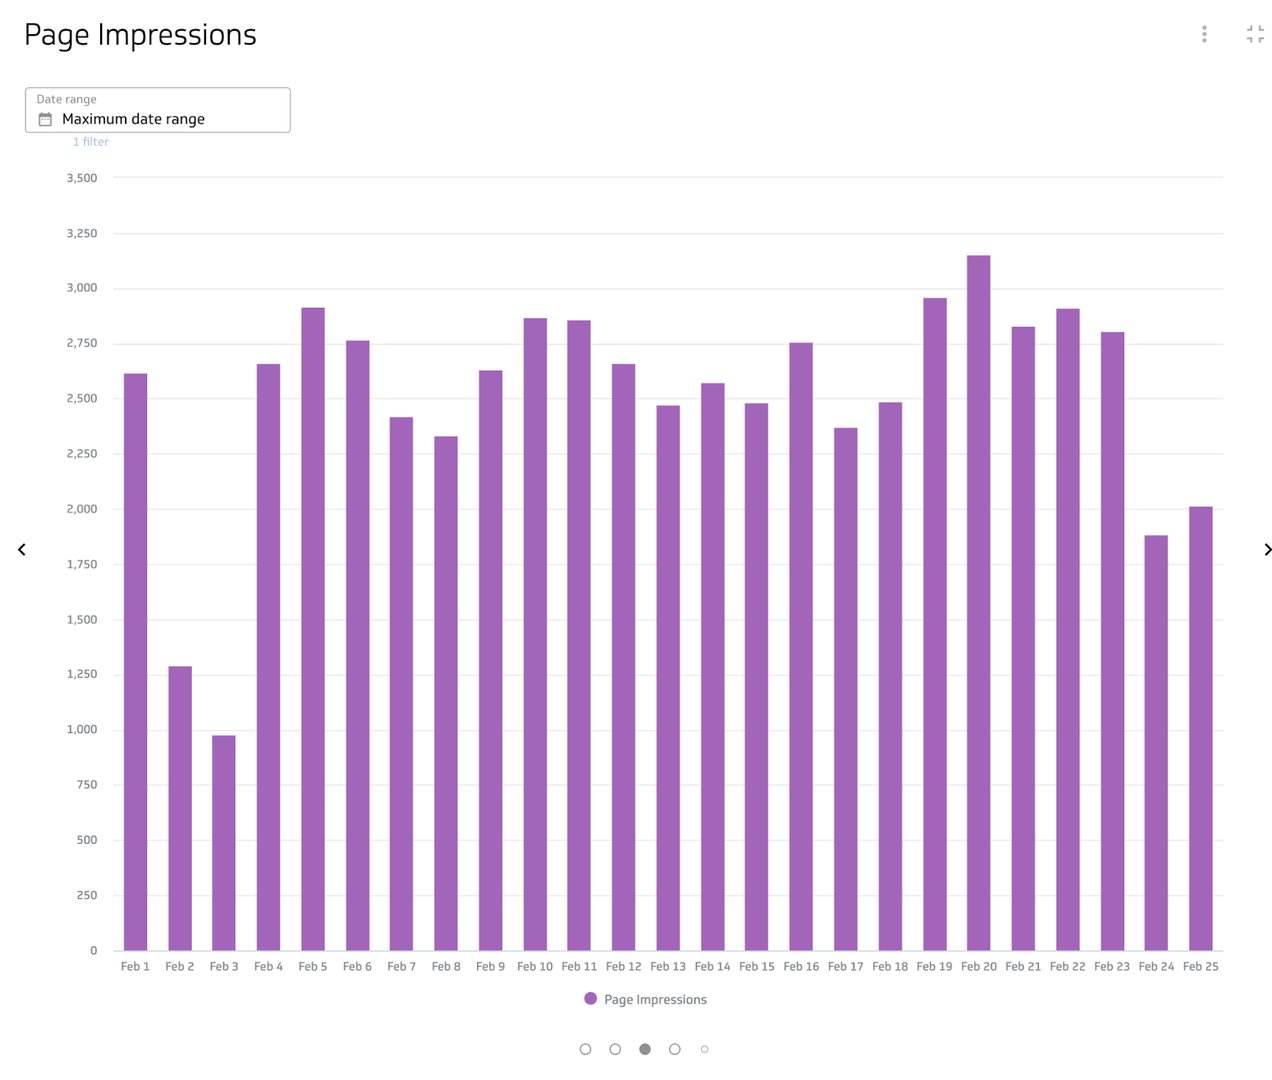
Use a bar chart of a line chart to compare your growth over a period of time
Let’s say you want to see how your page impressions increased week over week or month over month, or how your follower growth tracks month over month. These are great examples of when to use a bar chart or a line chart so you can clearly see the trajectory over your specified time period.
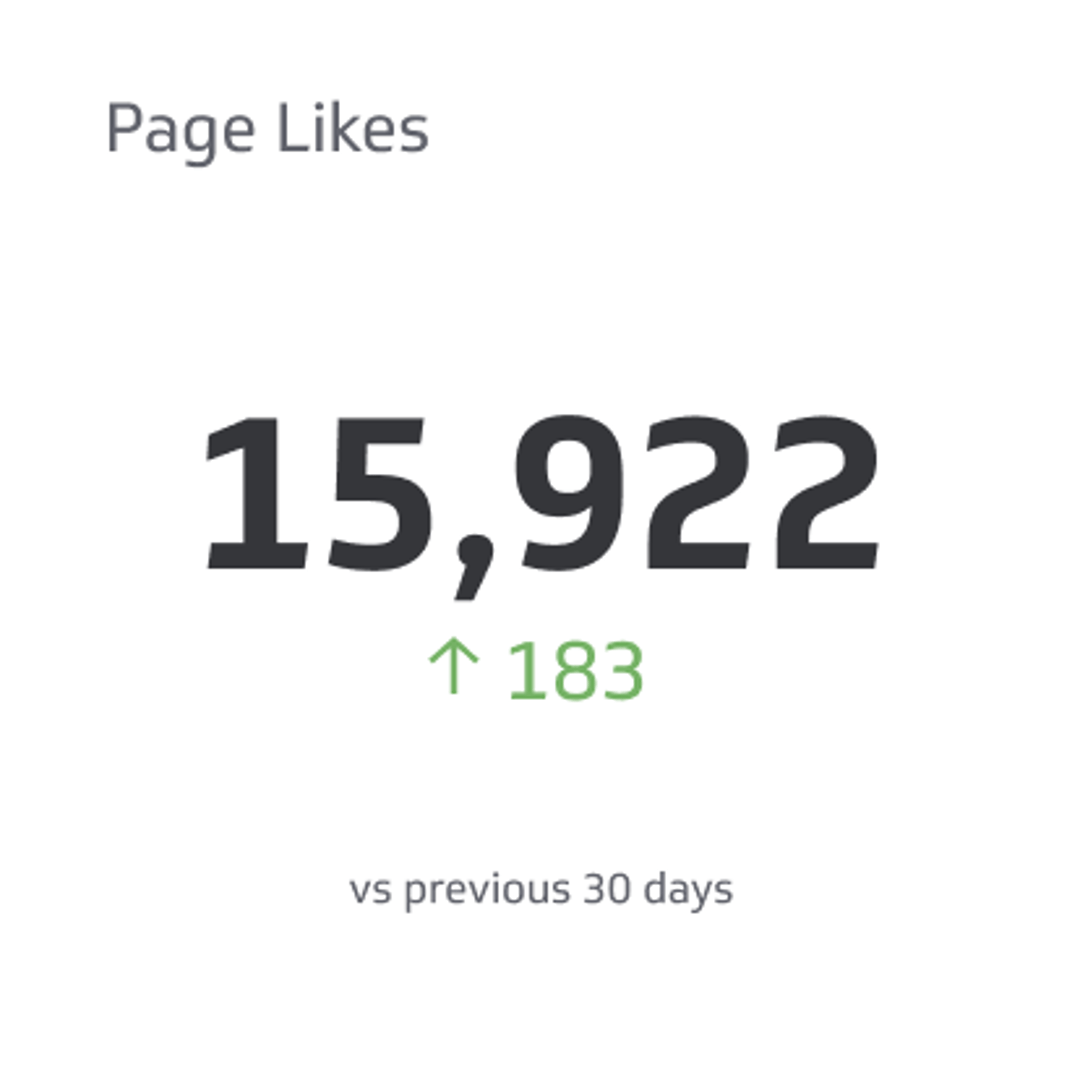
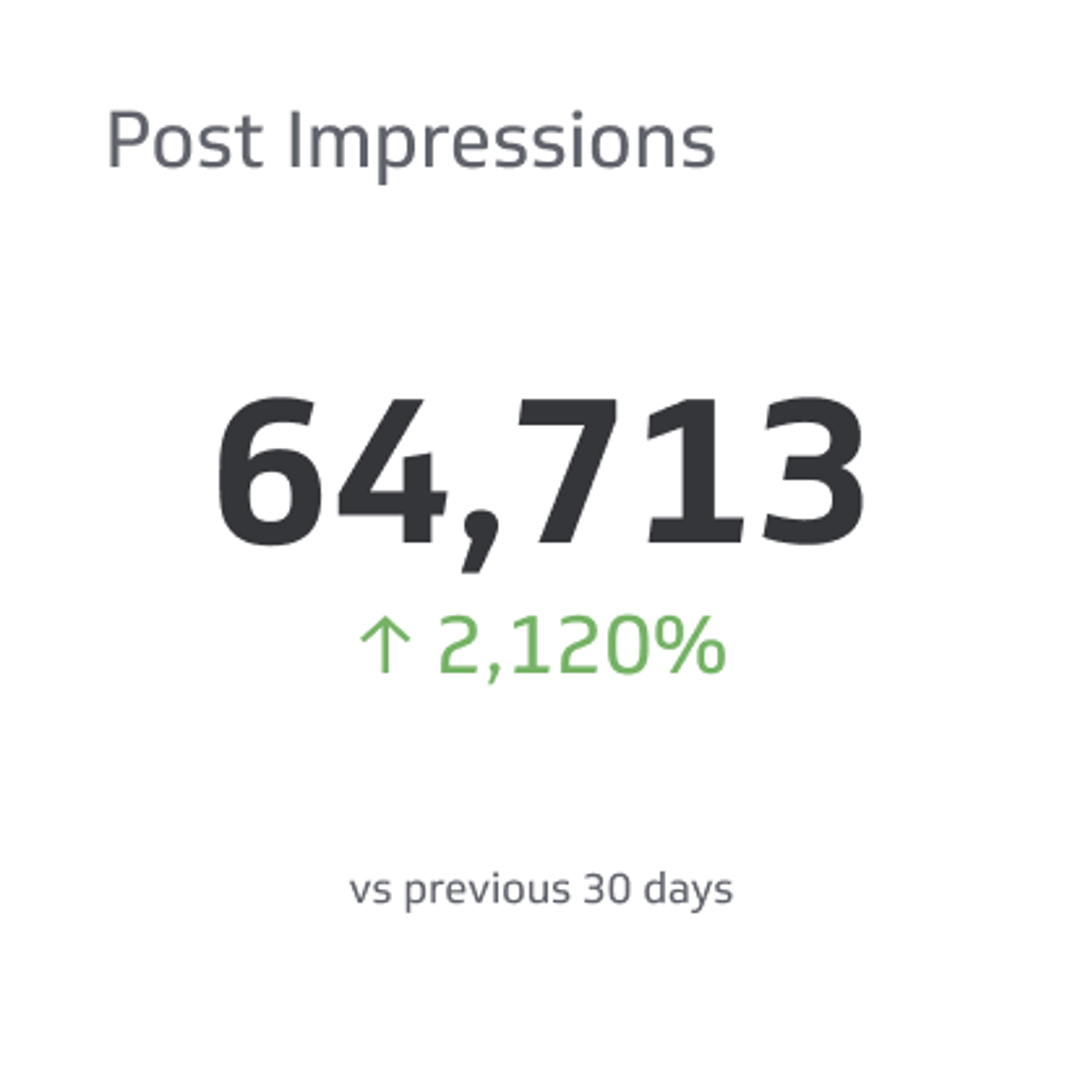
Use a summary chart to see cumulative values and add a comparison
If you want to display a data point as a single numeric value, you can use a summary chart. Summary charts display a number, like page likes or post impressions, so you can quickly gauge your growth. You can add a comparison value, whether it’s a number or percentage, so you can see how you’re tracking without having to dig deep into analysis.
Benefits of a Facebook Analytics dashboard
The standalone Facebook Analytics tool was deprecated in 2021. This means that Facebook Page insights are now available through the Business Suite on Facebook, in addition to using Ads Manager for ads insights and Events Manager for the pixel and conversions API. Why not bring your Facebook Page Analytics data into a PowerMetrics dashboard (alongside your Facebook Ads data) so you can access everything all in one place.
Building a Facebook Analytics dashboard ensures that you and your team can access the metrics to measure your organic social media performance. And, since Facebook Pages are often linked to personal Facebook accounts, creating a Facebook Analytics dashboard means there is no gatekeeping—you can widely share the data and ensure everyone can monitor performance and engagement rates.
Dashboard inspiration for your Facebook Analytics
Not sure where to start? Here are a few dashboard examples that you can build using your Facebook Analytics data, each focusing on a specific area goal or KPI.
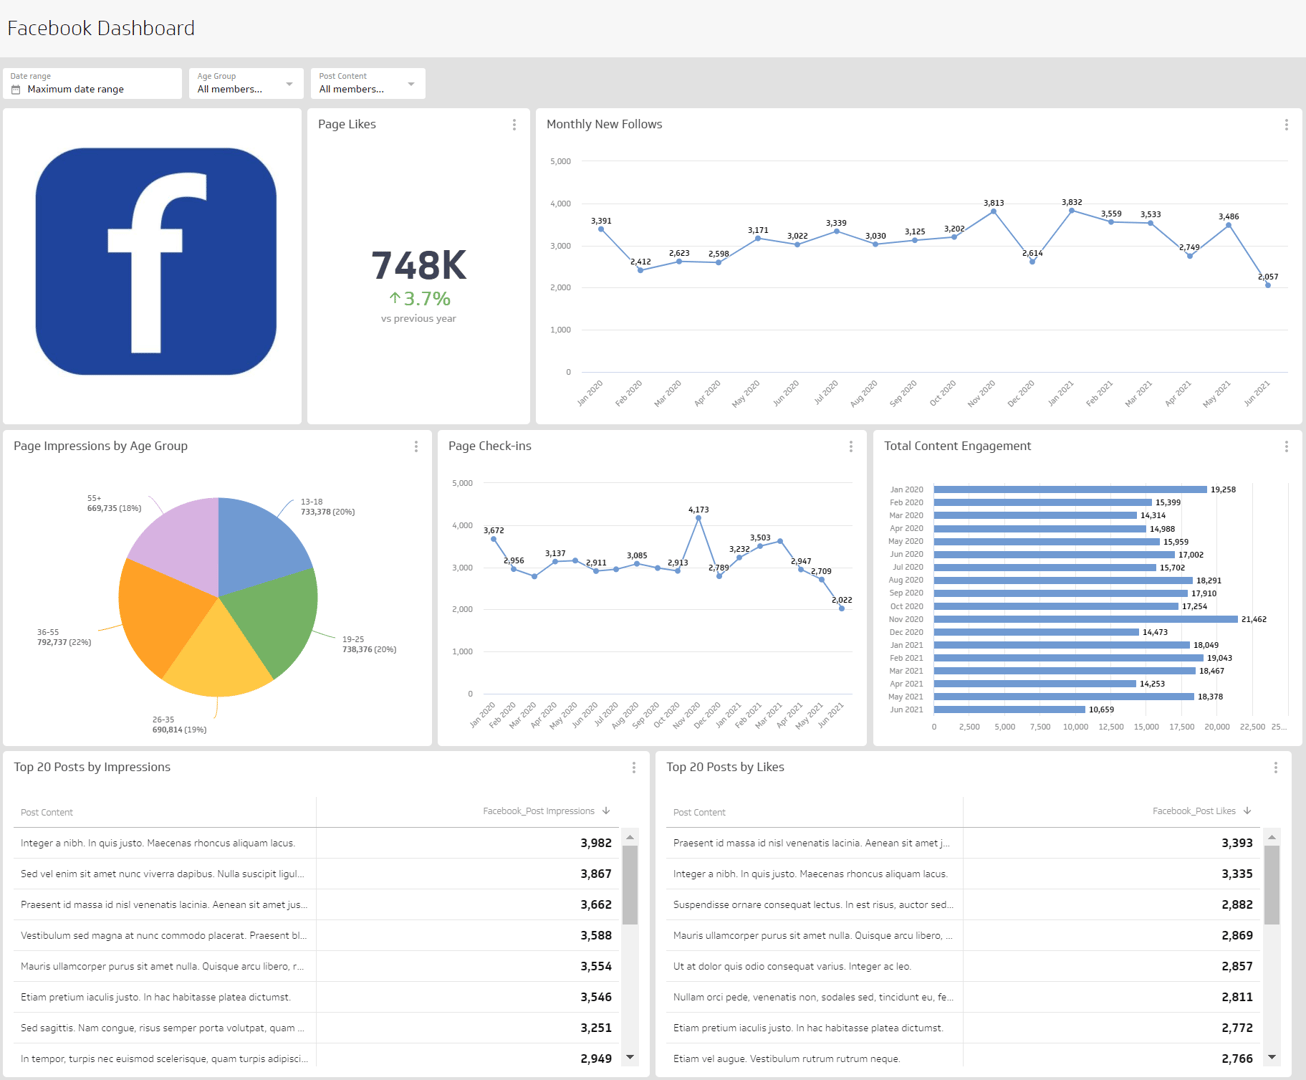
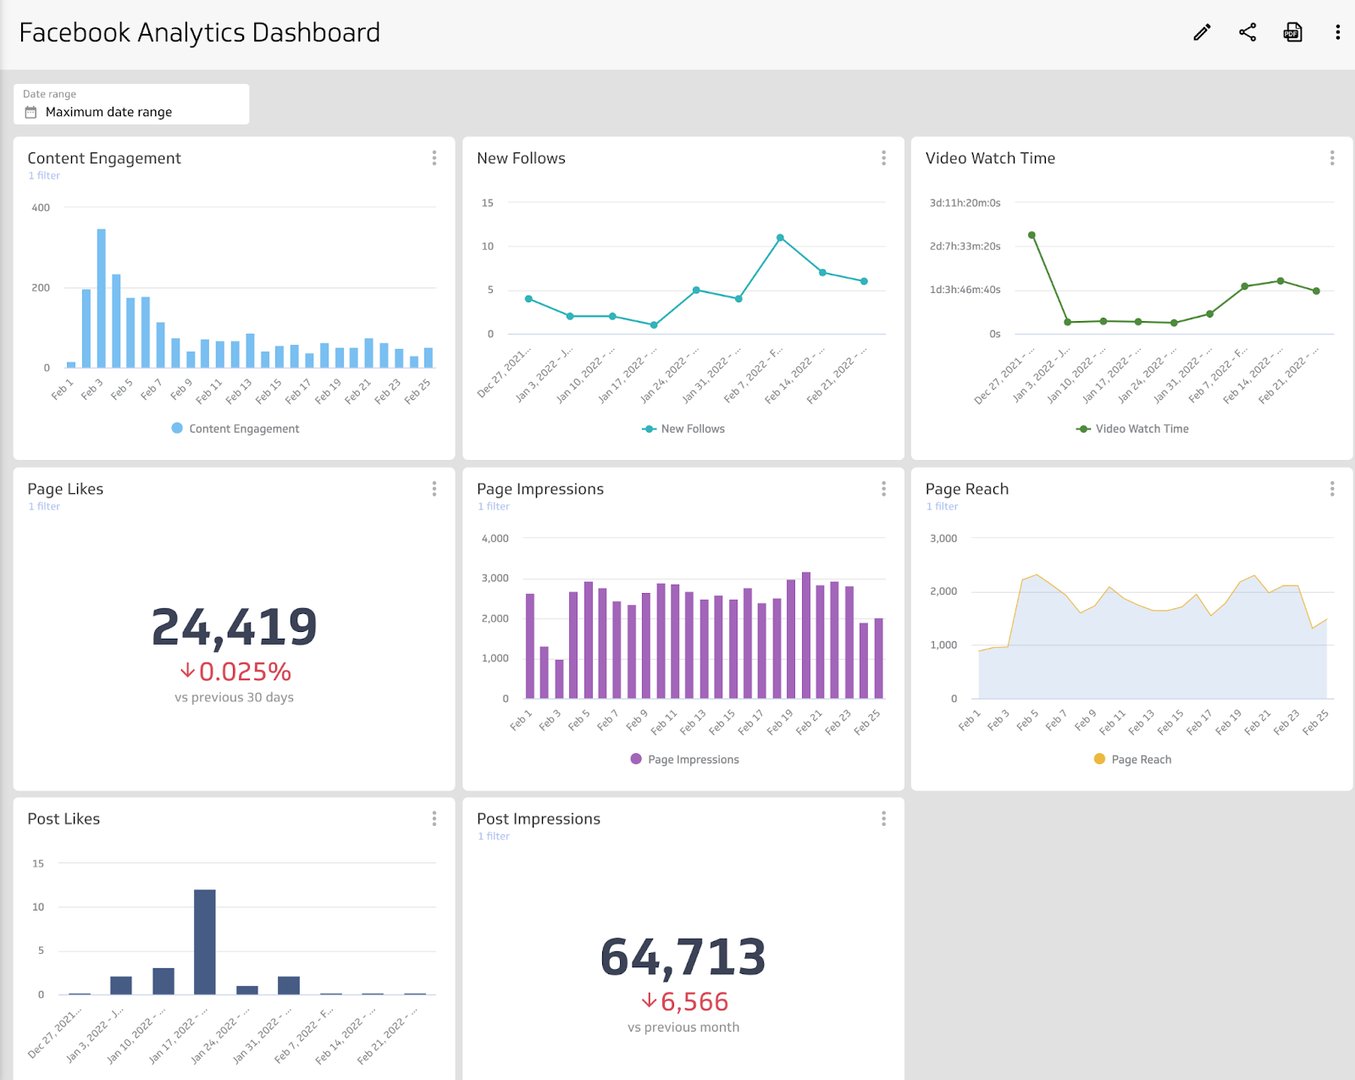
Facebook Performance Dashboard
Get a complete overview of Facebook performance with a performance dashboard. This dashboard will include metrics like content engagement, new followers, page impressions, and post reach. This dashboard will help you answer questions like:
- How many new followers are we gaining each week?
- How many post impressions do we have this month compared to last month?
- Is our page content consistently reaching our audience?
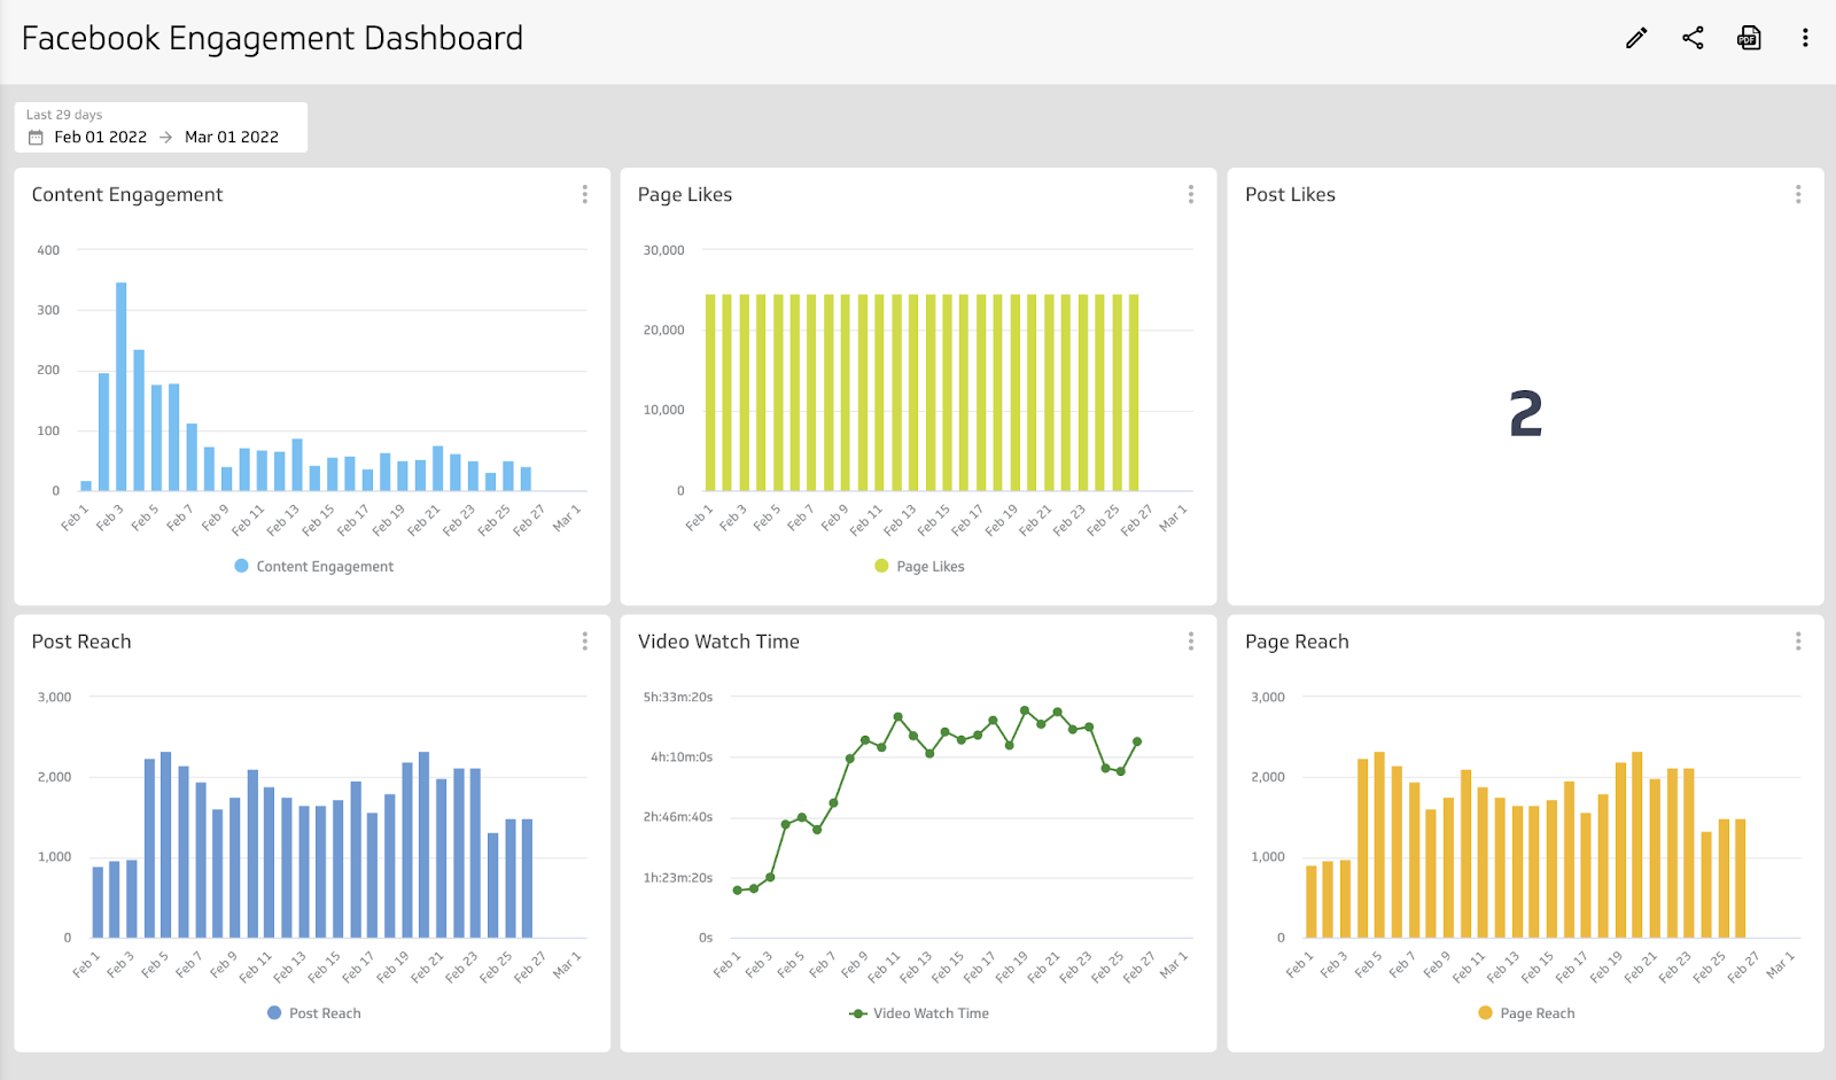
Facebook Organic Engagement Dashboard
Engagement on Facebook is a key indicator: are you reaching your audience and, as a result, are they interacting with your content? If your audience is engaging with your content, it usually indicates that your message resonates. This dashboard will help you answer questions like:
- Is my audience passively (likes) or actively (comments) engaging with my content?
- Are there any patterns or trends in days of the week that see higher engagement?
- How does our post reach compare to our page reach?
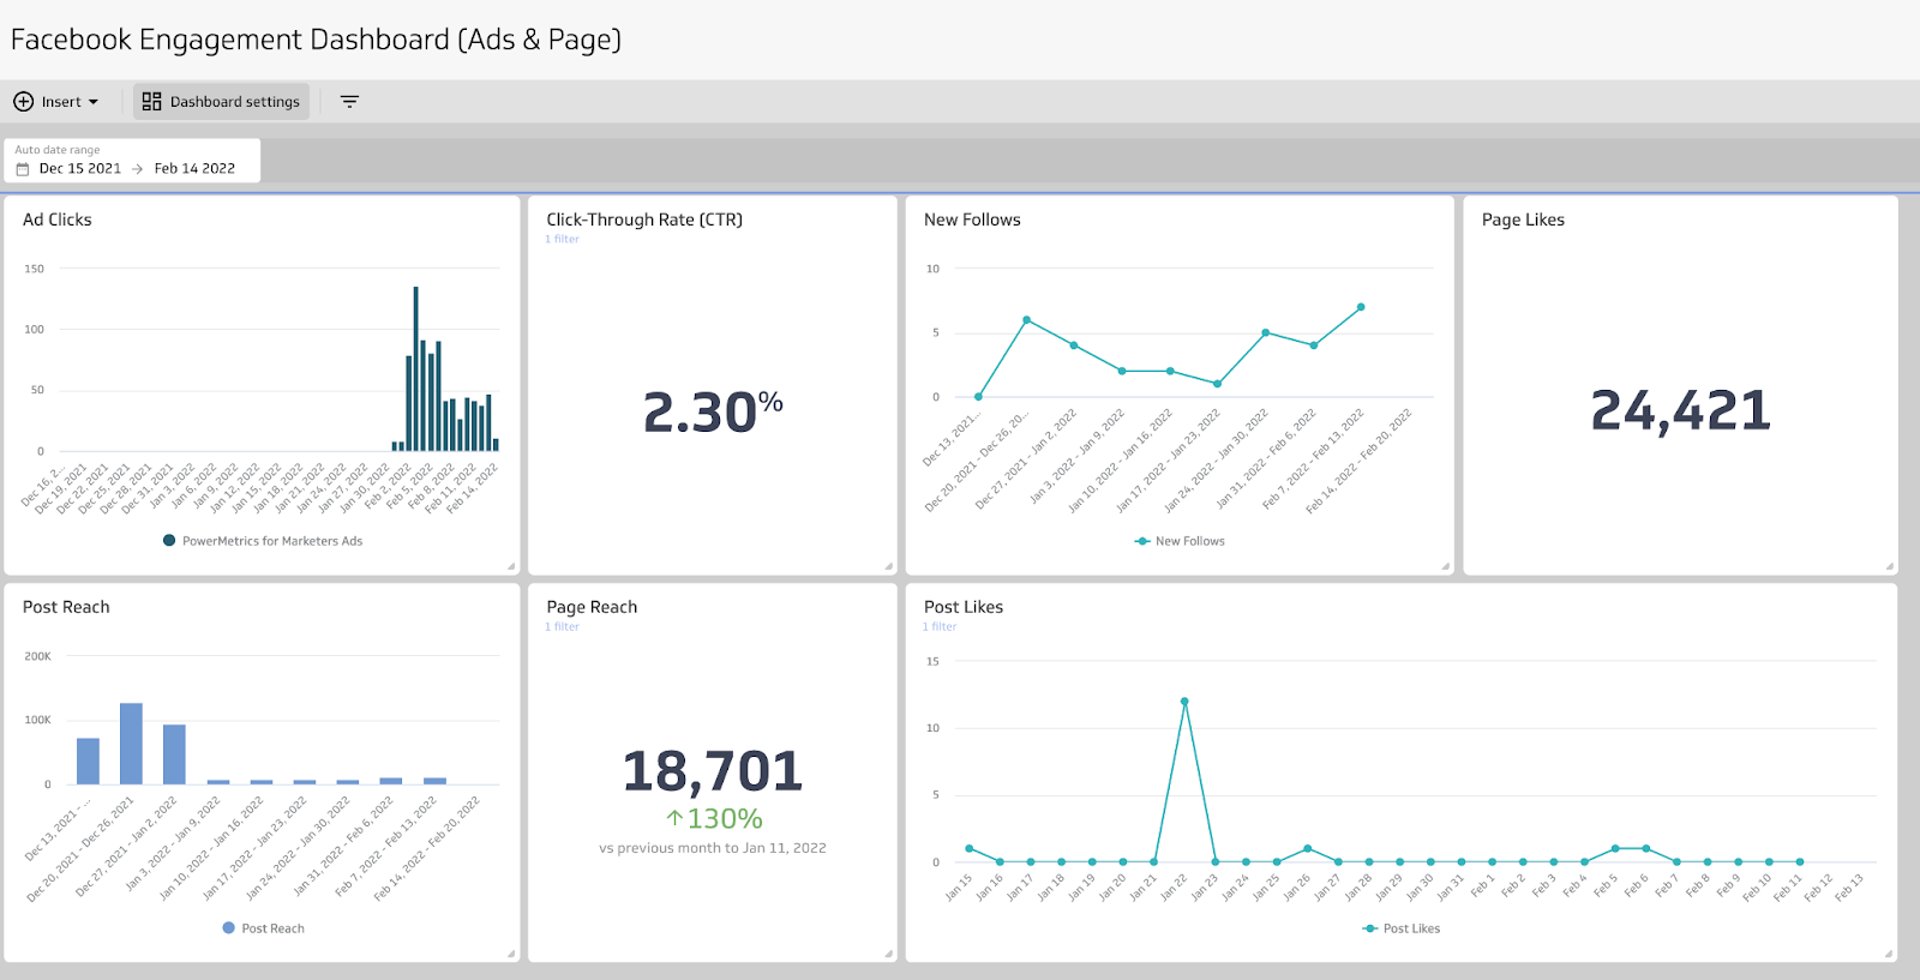
Facebook Paid Ads Engagement Dashboard
A Facebook engagement dashboard measures engagement from your Facebook Ads (paid) and your Facebook page (organic) so you can track your success across your entire Facebook marketing strategy. This dashboard will answer questions like:
- Do we have more success reaching our audience through paid channels or organically?
- Does our paid audience or our organic audience convert at a higher rate?
- Does our follower growth correlate with our ad campaigns?
What does success look like with a Facebook Analytics dashboard?
When you build a Facebook Analytics dashboard, you have a reporting tool that provides you and your team with the metrics and insights to measure your organic marketing efforts. A well-designed dashboard ensures that everyone, regardless of department of expertise, can understand the data being visualized.
Your Facebook Analytics dashboard should be used as a reporting tool to understand what’s working (or what’s not) as part of your social media strategy. The data you present on your Facebook dashboard should help you solidify a social media strategy that works for you and your business.
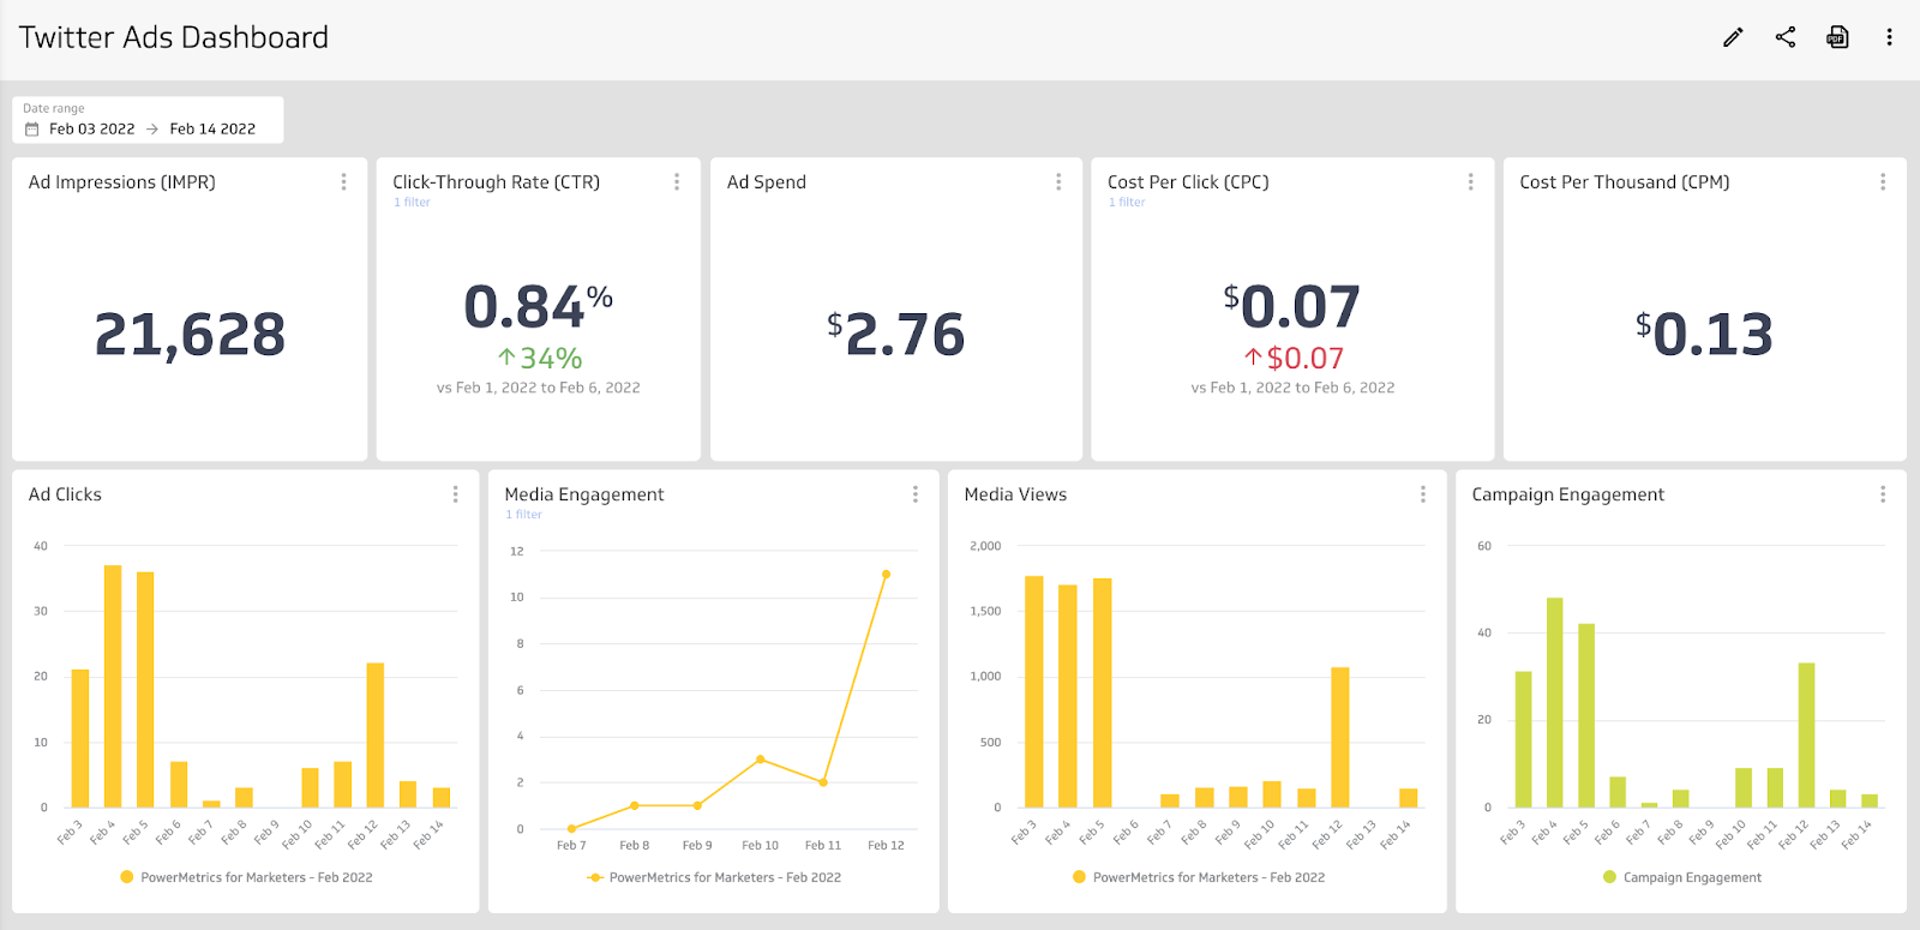
If you are also running ads on the Facebook platform, then you should also add a Facebook Ads Dashboard to your reporting.
Related Dashboard Examples