How to build a Sales Team Leaderboard

Published 2018-06-19, updated 2023-07-20

Summary - Leaderboards give a clear view on a team's relative performance, from strong starts to falling short. Learn how to build a Sales Team Leaderboard.
Friendly competition and real-time monitoring? Yes please.
With Klipfolio, you can connect your everyday data sources that you’re currently using to track and report on sales activity in a matter of minutes. A CRM like Salesforce, HubSpot or Pipedrive; call center and support apps like CallRail, Intercom or Zendesk; or spreadsheets that live on your hard drive, server, or in the cloud, all integrate with Klipfolio.
Already know the ins and outs of a sales team leaderboard, but you’re not sure how to build one? I’ll give you a brief breakdown:
- Create a report in your CRM that tracks your sales metrics.
- Create an Excel or Google Sheets spreadsheet to track your daily, monthly, and quarterly sales targets for each KPI you want to track.
- Use your CRM report and spreadsheet to build data visualizations that displays your sales KPIs against your overall business goals.
- Use dashboard software and a TV to display your sales leaderboard in your office.
With Klipfolio, you can build and publish custom data visualizations that surface your sales data in a way that is intuitive to you and the rest of your team. The visualizations will update as your data updates, so you’ll always know how you and your team members are doing in real-time.
For more of a detailed step-by-step guide, read on...
Why a sales team leaderboard?
You might be wondering, what’s a sales team leaderboard and why do I need one?
Put simply, it’s a software application used to track a sales team’s performance against business goals and targets. Sales leaderboards display individual performance side by side, making it easy to see which members of a sales team are ahead of target or behind target. It can be used to track performance on a daily, weekly, or monthly basis depending on objectives.
What are the key reasons to build a sales leaderboard?
- Track individual sales performance in real-time
- Track team sales performance in real-time
- Directly compare performance across multiple sales metrics or KPIs
- Use friendly competition to fuel motivation in the sales team
- Create a transparent, data-driven work environment
- Make quick decisions based on the data instead of waiting for end of quarter reports
Use real-time data: build a powerful sales leaderboard
Now that you know what a sales leaderboard is and all of its awesome benefits, you can create one using real-time data from your CRM (eg. Salesforce) and charting those metrics with your business targets.
Use these steps to build your own sales leaderboard:
- Create a report in your CRM that tracks new business deals, new business values, demo calls, and any other sales metrics.
- Create an Excel or Google Sheets spreadsheet to track your daily, monthly, and quarterly sales targets for each KPI you want to track.
- Use your CRM report and spreadsheet to build data visualizations, such as a gauge, that displays your sales KPIs against your overall business goals.
- Use dashboard software and a TV to display your sales leaderboard in your office.
Connect and customize your leaderboard with Klipfolio
To connect your data sources and start building your sales team leaderboard with Klipfolio, watch this detailed video tutorial or read on down below.
Connect your sales data source to Klipfolio
The first step in building custom data visualizations and dashboards in Klipfolio is to connect your data sources to Klipfolio.
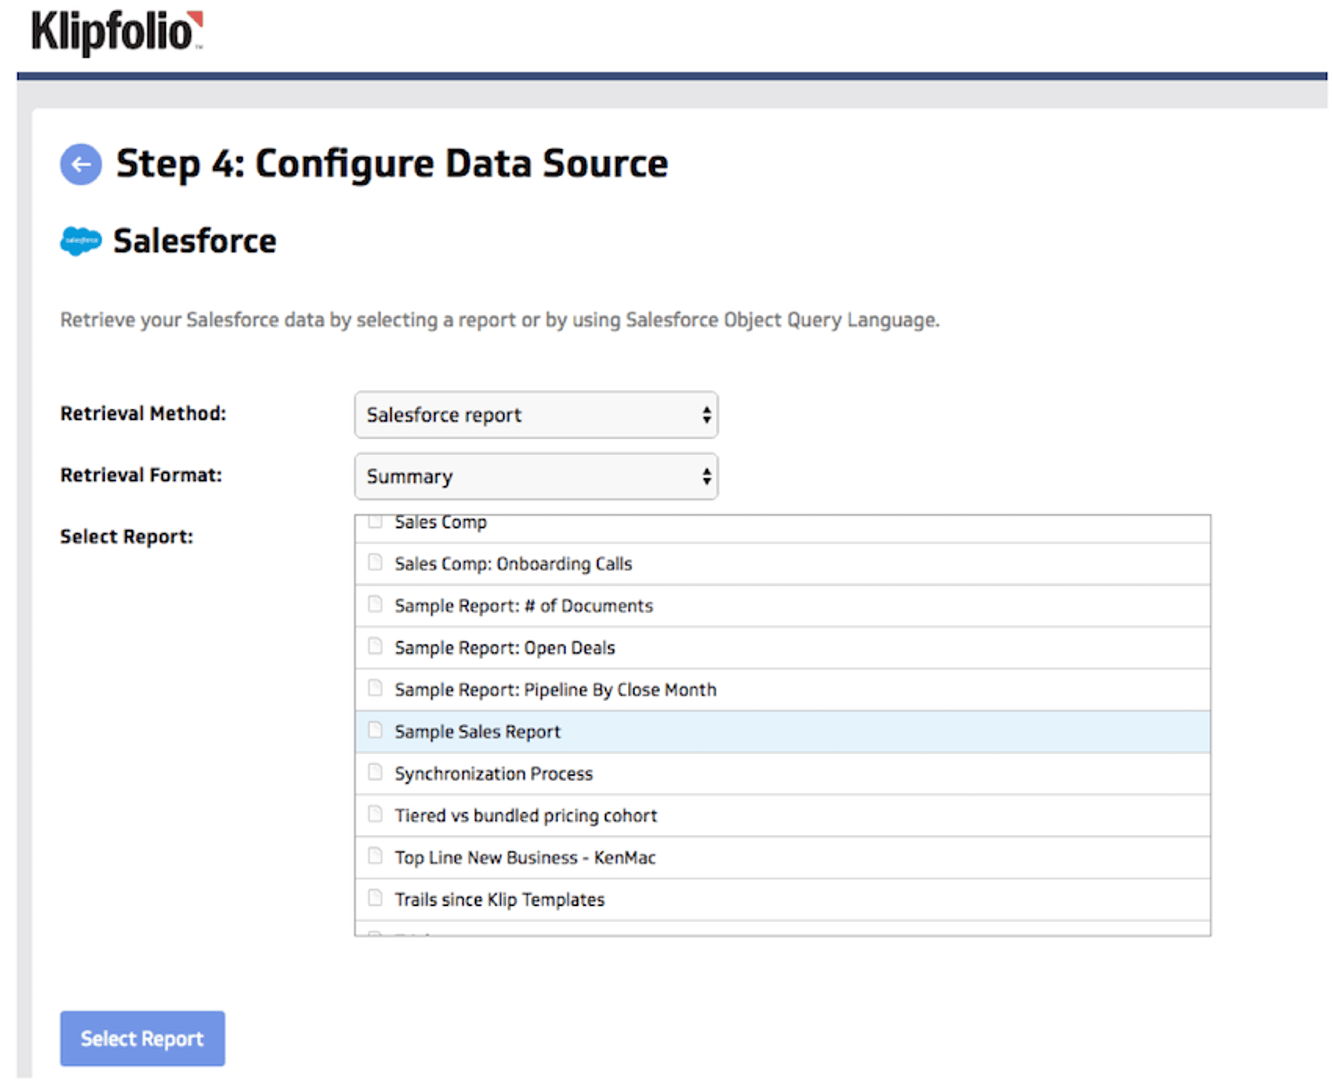
As an example, if you want to build a Sales Team Leaderboard in Klipfolio that draws on Salesforce data, you’d start by creating a sales report in Salesforce, and following that, you’d connect your Salesforce account in Klipfolio.
From there, you would be able to search for and connect to that Salesforce report.
Build your custom sales data visualizations
Once your sales data sources are connected, you’re ready to start building.
From the dashboard interface click Add a Klip and then Build a Custom Klip.
Pick the data visualization component you’d like to start building with. In building data visualizations for Sales Team Leaderboards, I like to start with the ‘Blank’ component.
Next, you’ll be asked what data source you’d like to use to build your data visualization. Sticking with the Salesforce example, if you’ve already created the Salesforce Report you’d like to use, you can choose to Connect a New Data Source at this stage, and you’ll be taken to the Connector Gallery.
Type Salesforce in the search field and select the Salesforce Connector. Pick a flow step, then provide your Salesforce credentials to enable you to access your Salesforce data through Klipfolio.
Where you have the option to select a data retrieval method, pick Salesforce Report, unless you want to write a SQL query to pull in data that way.
Click Select and verify that you’re about to pull in the right data down below. Click Continue and you’ll be taken to the Editor.
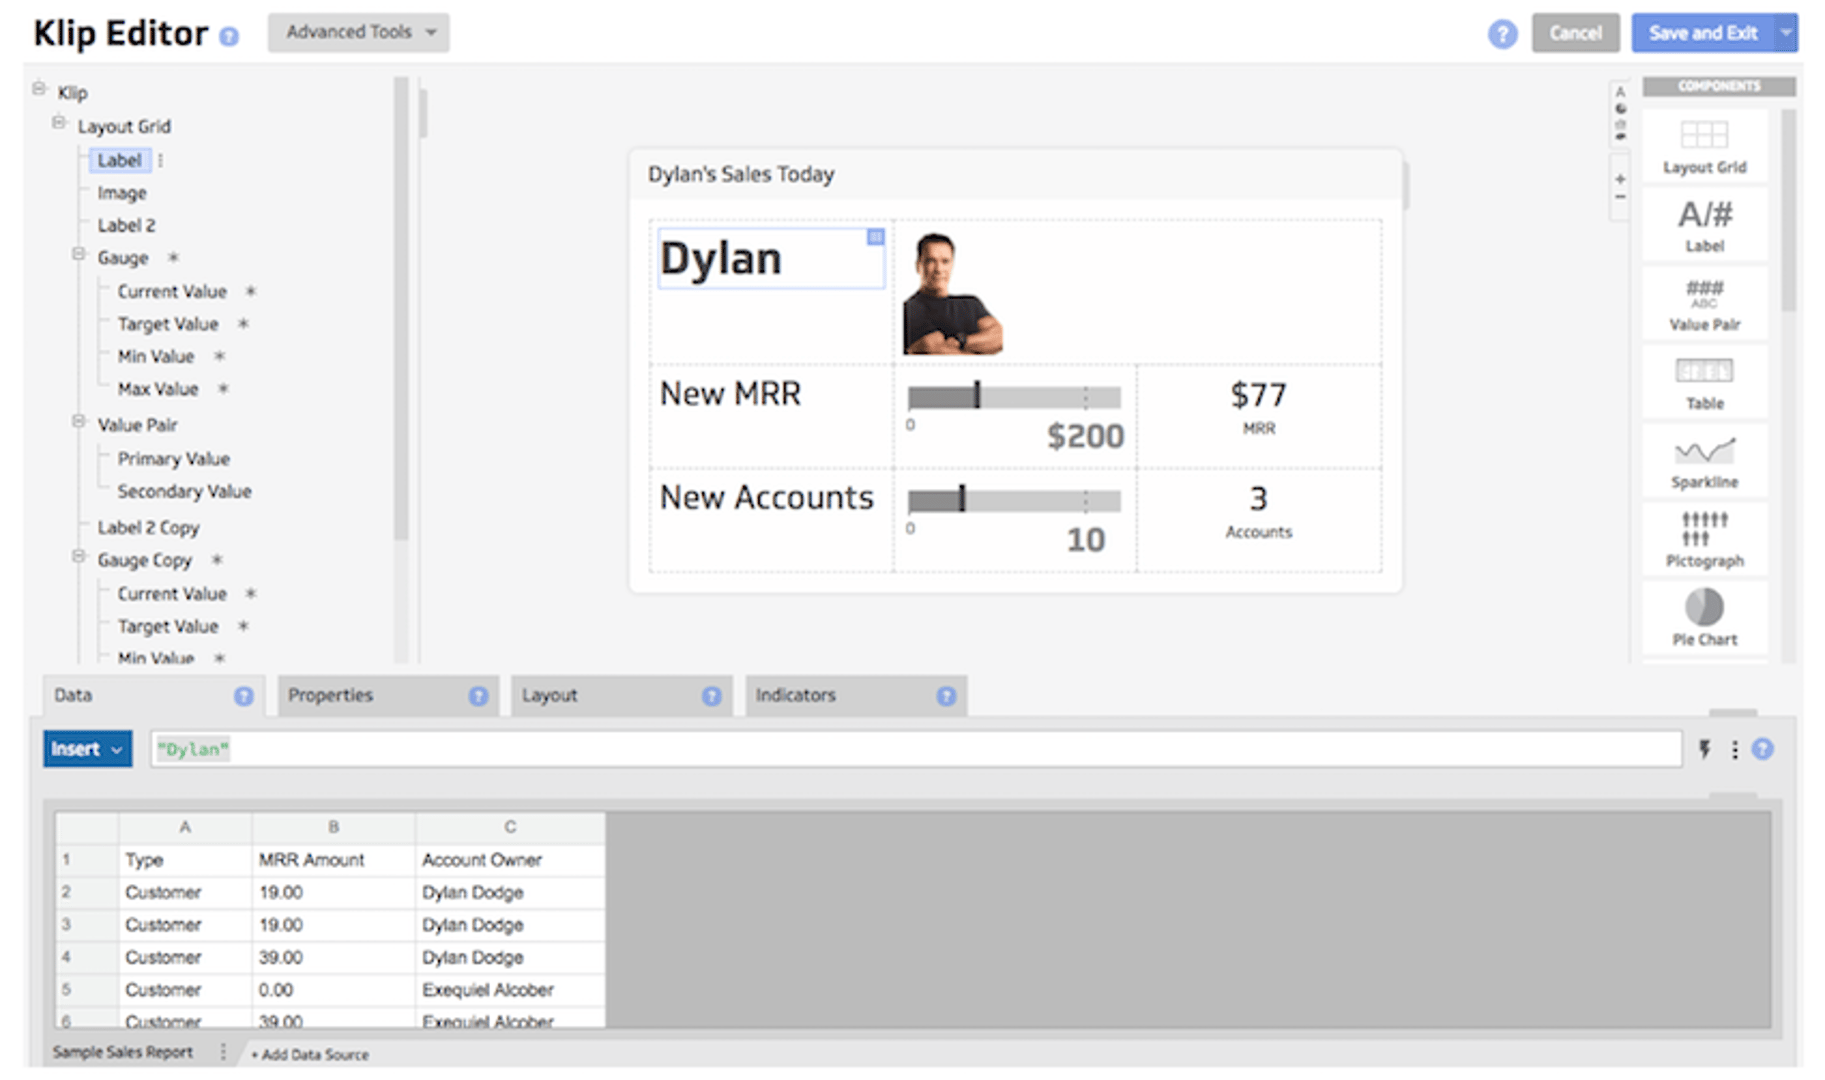
In the Editor, you’ll see a variety of data visualization components on the right-hand side which you can drag into the preview screen in the middle.
Your data source will be displayed down below, and you’ll see a formula bar on top of that.
For a step-by-step on how to build a Sales Team Leaderboard in Klipfolio, be sure to check out the video I included.
Long story short - once you create your first data visualization and display the relevant metrics and KPIs for one sales rep, you'll duplicate that content, adjust it to show data for another sales rep, and save as so that you’re not writing over the first data visualization you created.
Repeat this process until you’ve created a "sales scorecard" for all of your sales reps, and then add them to your dashboard.
Once you're happy with your leaderboard layout, you'll be able to share the final product with your sales team and throughout your office. Want to kick it up a notch? Complement your leaderboard with a Salesforce TV dashboard, inspiring your team to be even more data-driven.
Pro building tip
Take a look at our internal sales leaderboard where the monthly targets are cumulative. This is a great approach to use as positive reinforcement, keeping your team motivated. Leaderboards help employees get a clear view on their relative performance; from strong starts to falling short, there is psychology behind a little competition driving results. So try out our different formatting layouts, colours, gauges and graphs, branding opportunities, and more. With Klipfolio, you can build practically anything!
Drive your team's performance
I hope this post has helped you come to realize how effective yet fun a sales leaderboard can be to track your sales team’s performance. Use the step-by-step instructions on how to build a sales leaderboard to help you and your team land those big wins and rebound from tough losses - after all, who doesn’t like some friendly competition?
Related Articles
How to Build Google Analytics 4 Dashboards in Klips
By Jonathan Taylor — June 6th, 2023
How to use the Google Analytics 4 Query Explorer to export data
By Jonathan Taylor — June 1st, 2023

Unlock Data-Driven Decisions with ChatGPT & MetricHQ
By Nicolas Venne — April 3rd, 2023

Start your analytics journey with instant metrics
By Jonathan Taylor — June 8th, 2022