Social Traffic and Conversions
Measure traffic and goal completions from social sources.
What is Social Traffic and Conversions?
Social Traffic and Conversions measures visits to your website from social media sources and the goals or orders those visits generate. Track it by channel and campaign to see which networks bring visitors who act.
Why it matters
Knowing your social traffic volume is table stakes. The question that drives decisions is whether those visitors do anything once they arrive.
This KPI connects social activity to real business outcomes. When you know which platforms send visitors who convert, you can shift time and budget toward what works, and stop guessing. When conversion rates drop, you have a signal to fix the landing experience before it costs you more.
Three things this KPI helps you do:
- Tie social activity to outcomes: See whether posts and campaigns create real business impact, not just impressions.
- Guide budget and time: Move effort to channels that send visitors who complete key actions.
- Improve post-click experience: Identify landing pages and offers that help social visitors act, and ones that do not.
Formula
Social Conversions = Count of goal completions where source/medium is a social channel

Social Conversion Rate = (Social Conversions / Social Sessions) × 100
How to calculate Social Traffic and Conversions
- Define your social sources: X, Facebook, LinkedIn, Instagram, TikTok, Pinterest, and any others relevant to your business.
- Apply consistent UTM parameters to every social link (source, medium, campaign).
- Filter your analytics sessions to those sources.
- Count completed goals or orders from those sessions.
- Divide conversions by social sessions and multiply by 100 to get the rate.
Tip: Separate paid and organic traffic by using distinct UTM medium values, for example social versus paid-social, then compare outcomes side by side.
Example
In April, your site recorded 8,200 social sessions and 410 goal completions from those sessions.
Social Conversion Rate = (410 / 8,200) × 100 = 5.0%
Key terms
- Referral traffic: Visitors who arrive at your site by clicking a link on another website, including social platforms.
- Conversion or goal: A specific action you want visitors to complete, such as subscribing to a mailing list or placing an order.
- Conversion rate: The percentage of sessions that result in a completed goal.
What good looks like
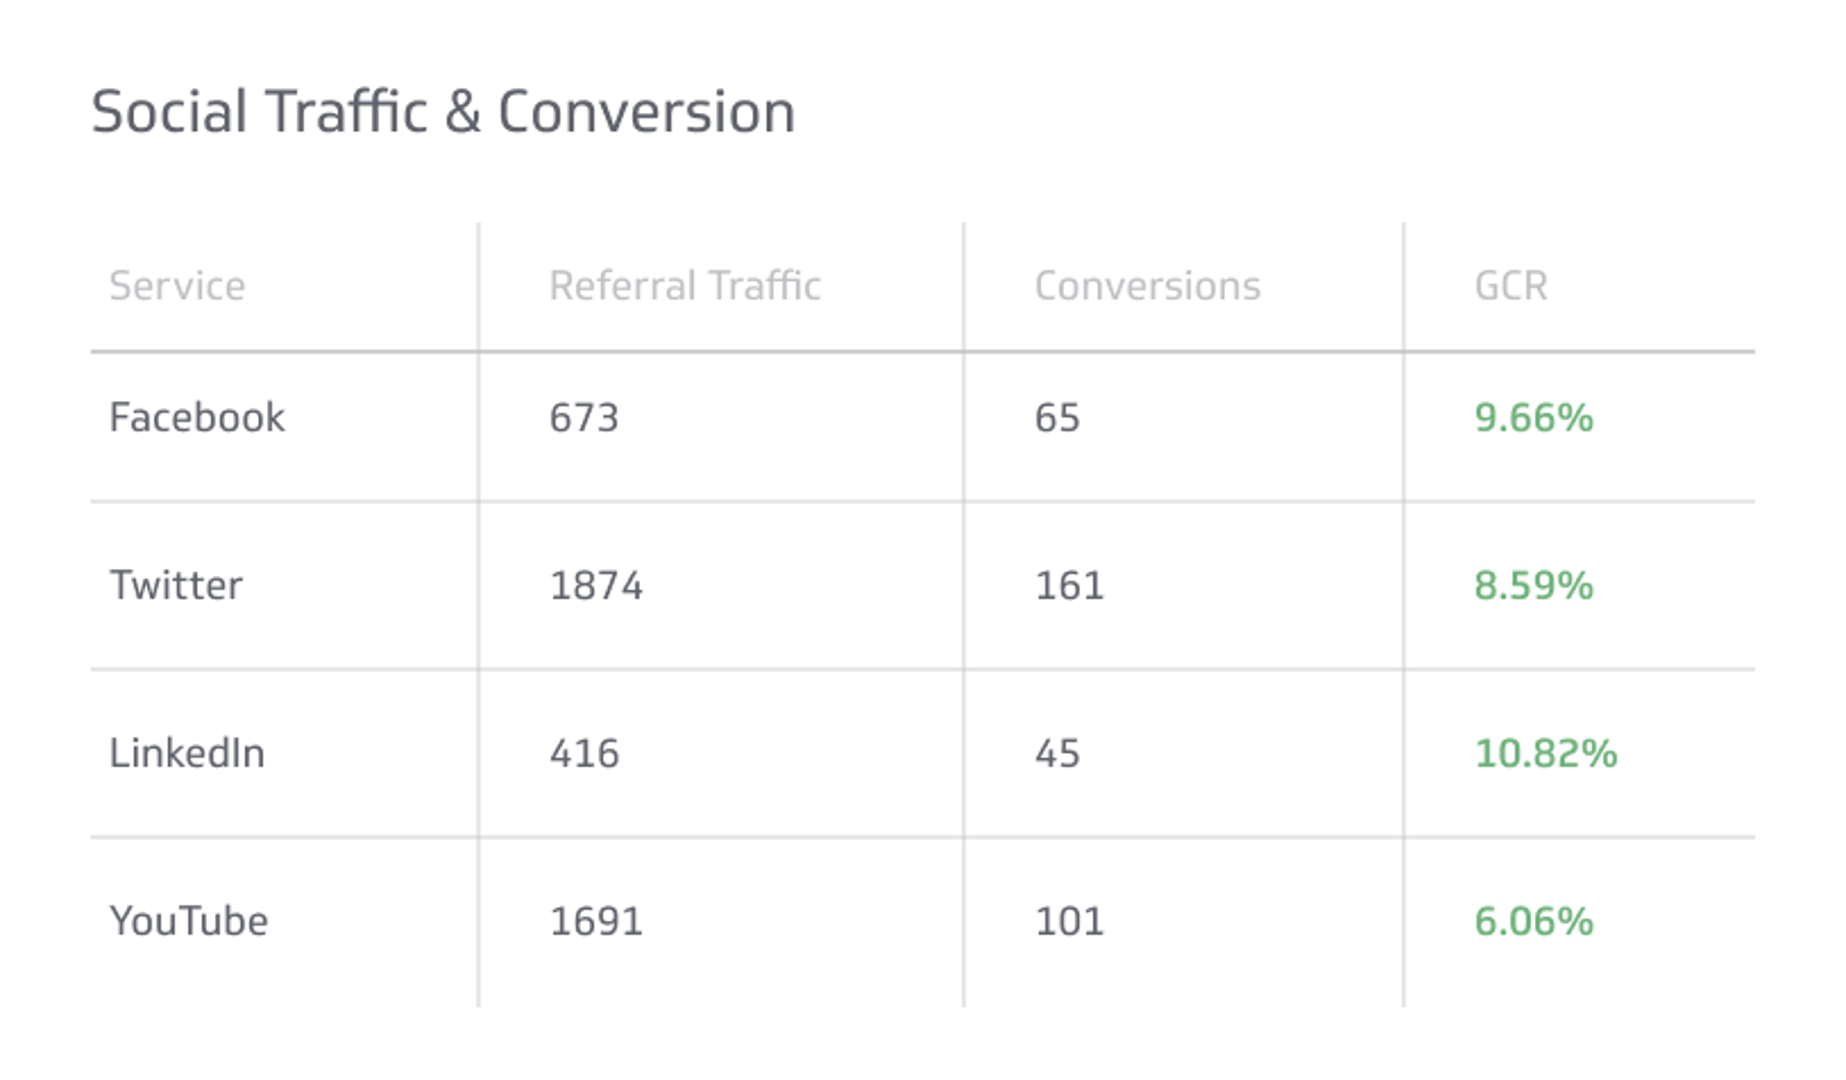
A strong result is high goal conversion rate (GCR) paired with strong session volume from your key social platforms. Either metric alone tells an incomplete story. High traffic with low GCR suggests a mismatch between your social message and the landing experience. Low traffic with high GCR means the channel works but needs more reach.
Best practices
The biggest conversion leak in social traffic is a mismatch between the ad or post and the page it sends people to. If you promote a specific product or offer, link directly to it. Sending visitors to your homepage and expecting them to find it themselves loses most of them.
A few principles that hold across channels:
- Match the landing page to the post. Check that URL shorteners and recent page renames have not broken links. Errors here are common and easy to miss.
- Reduce friction. Fewer clicks between arrival and conversion usually means a higher rate. Audit the path a social visitor takes and cut any unnecessary steps.
- Adjust post frequency and timing deliberately. When you change your posting schedule, track whether click-through and conversion rates follow. Use UTM data to confirm what your instincts suggest. Kissmetrics has documented this effect in detail.
- Make your site easy to share. Social-friendly structure, Open Graph tags for Facebook, and X Cards for X help your content render well when shared, which affects click-through before a visitor even reaches your site. Jawad Khan covers several practical approaches.
- Add sharing and follow widgets. Tools that make it easy to share your content extend its reach without additional spend.
If you see strong referral volume but high bounce rates, the problem is almost always the landing page, not the social channel.
Reporting frequency
Review monthly. During active campaigns, check weekly so you can catch drops early and adjust before the campaign ends.
How to monitor Social Traffic and Conversions
In Klips, connect your web analytics and social data sources. Build Klips for Social Sessions, Social Conversions, and Social Conversion Rate. Segment by network and campaign, annotate major content drops or promotions, and trend the last 6 to 12 months to spot meaningful shifts.
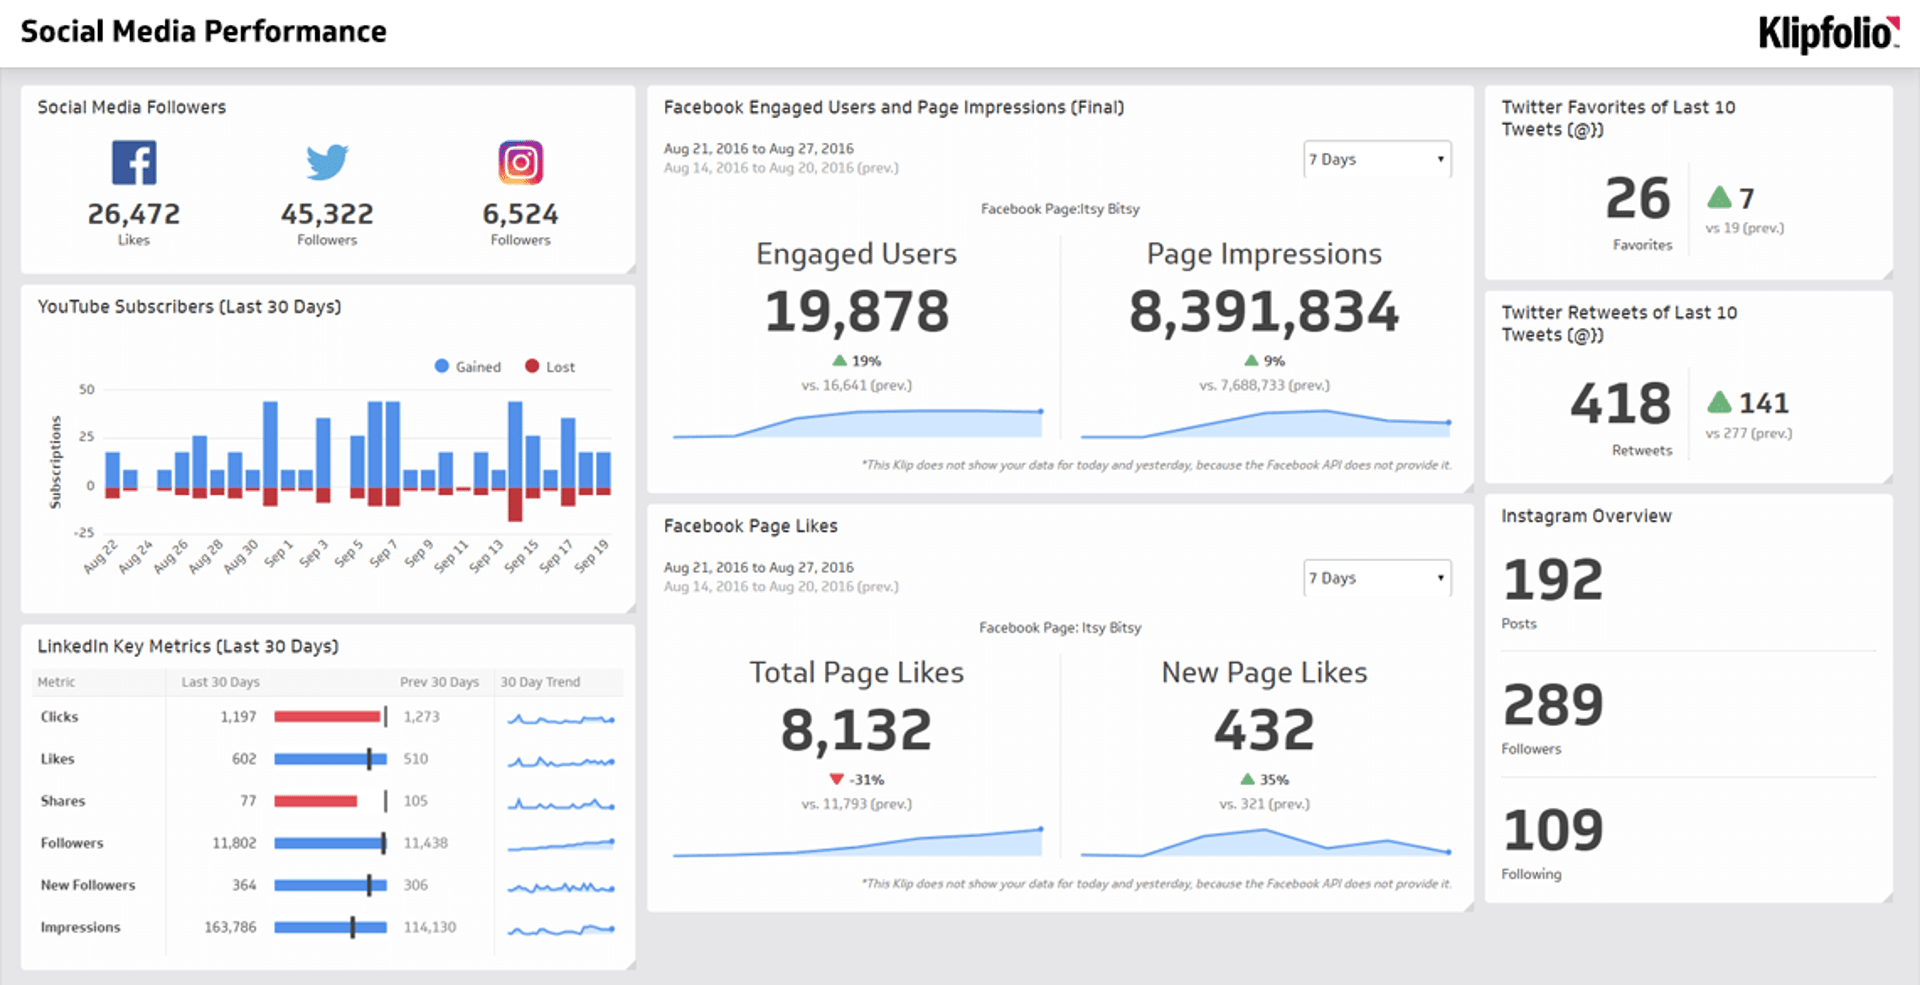
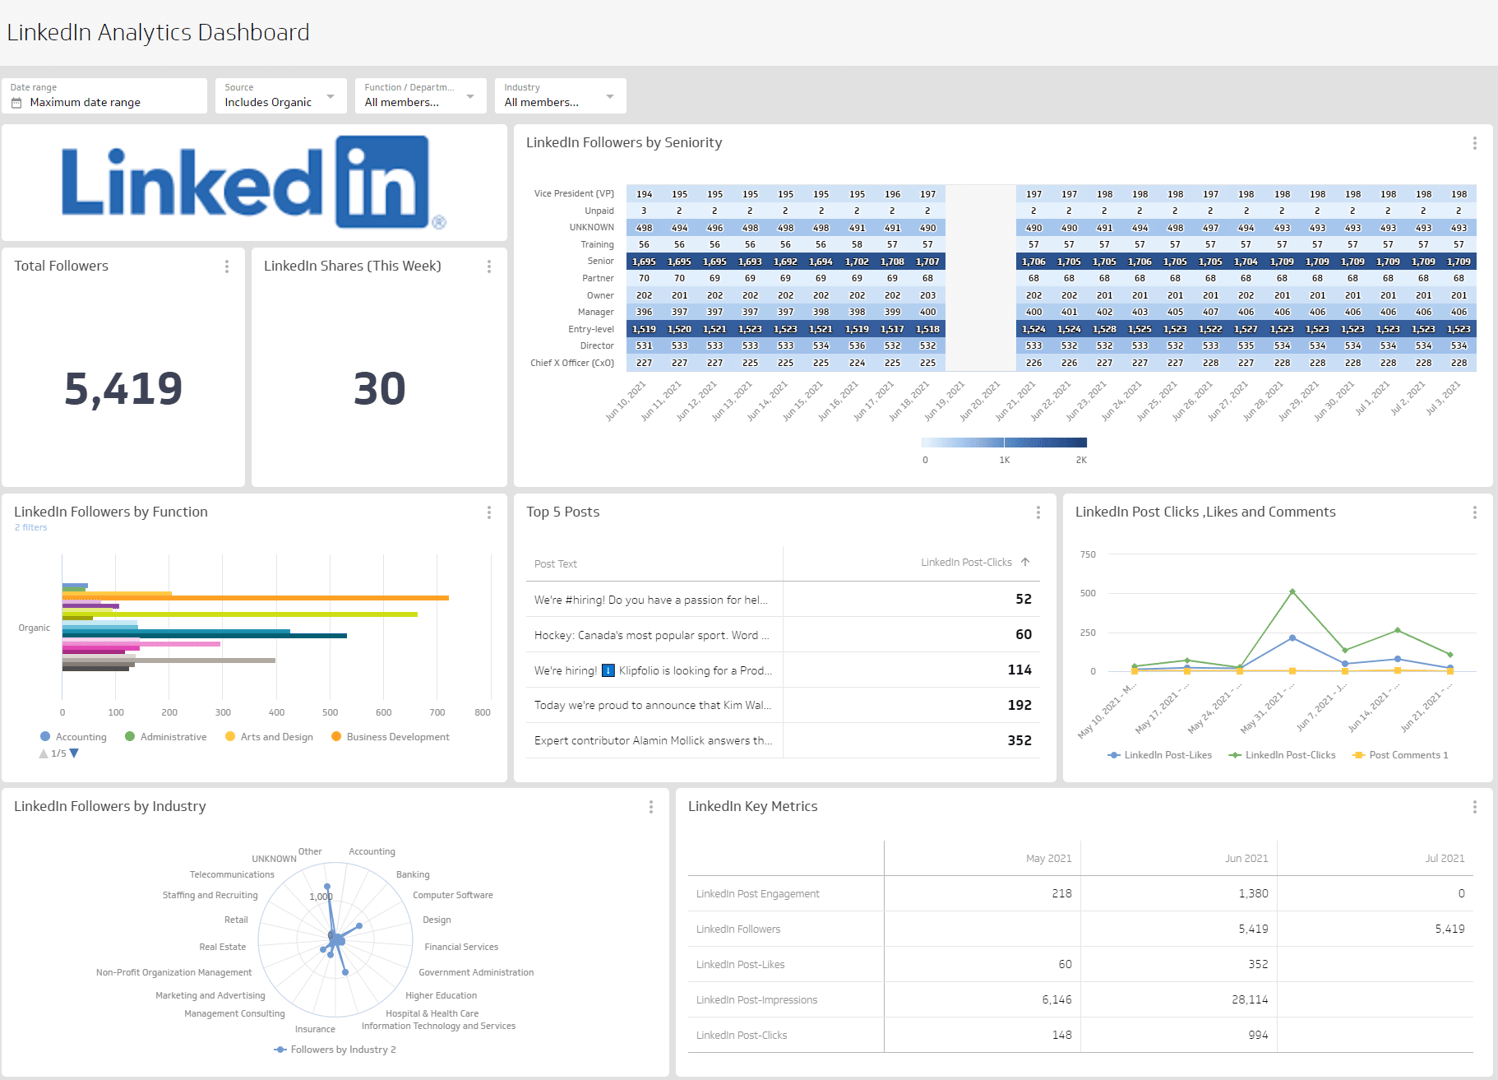
Track it alongside your other social KPIs on a Social Media Dashboard to keep the full picture in one place.
Create custom dashboards for you and your team.
Get started with Klips