
Data from anywhere.
A metric catalog for everyone.
Unlock value in your data for business users. Deliver a catalog of metrics and straightforward metric-centric analytics everyone will love with Klipfolio PowerMetrics.
Get Started FreeMake metrics the bridge between data and business users.
Define your metrics in one place, connect them to your stack or cloud data sources, and get everybody on the same page with a centralized catalog of trusted metrics.
With streamlined metric-centric analytics and dashboards, your business users will finally have everything they need for confident, self-serve BI.
"Leverage data in everyday decision-making with Klipfolio. Users can import, edit and analyze data to get comprehensive and exact insight."
Looking to build pixel-perfect dashboards and reports using cloud data?
Try Klipfolio Klips for your team or your clients.


All your data works
beautifully in Klipfolio.
From spreadsheets, SQL, REST, pre-built metrics and more, there are over a hundred ways to connect your team's data to PowerMetrics. And once connected, you can easily clean up messy, incomplete or complicated data in just a few clicks.


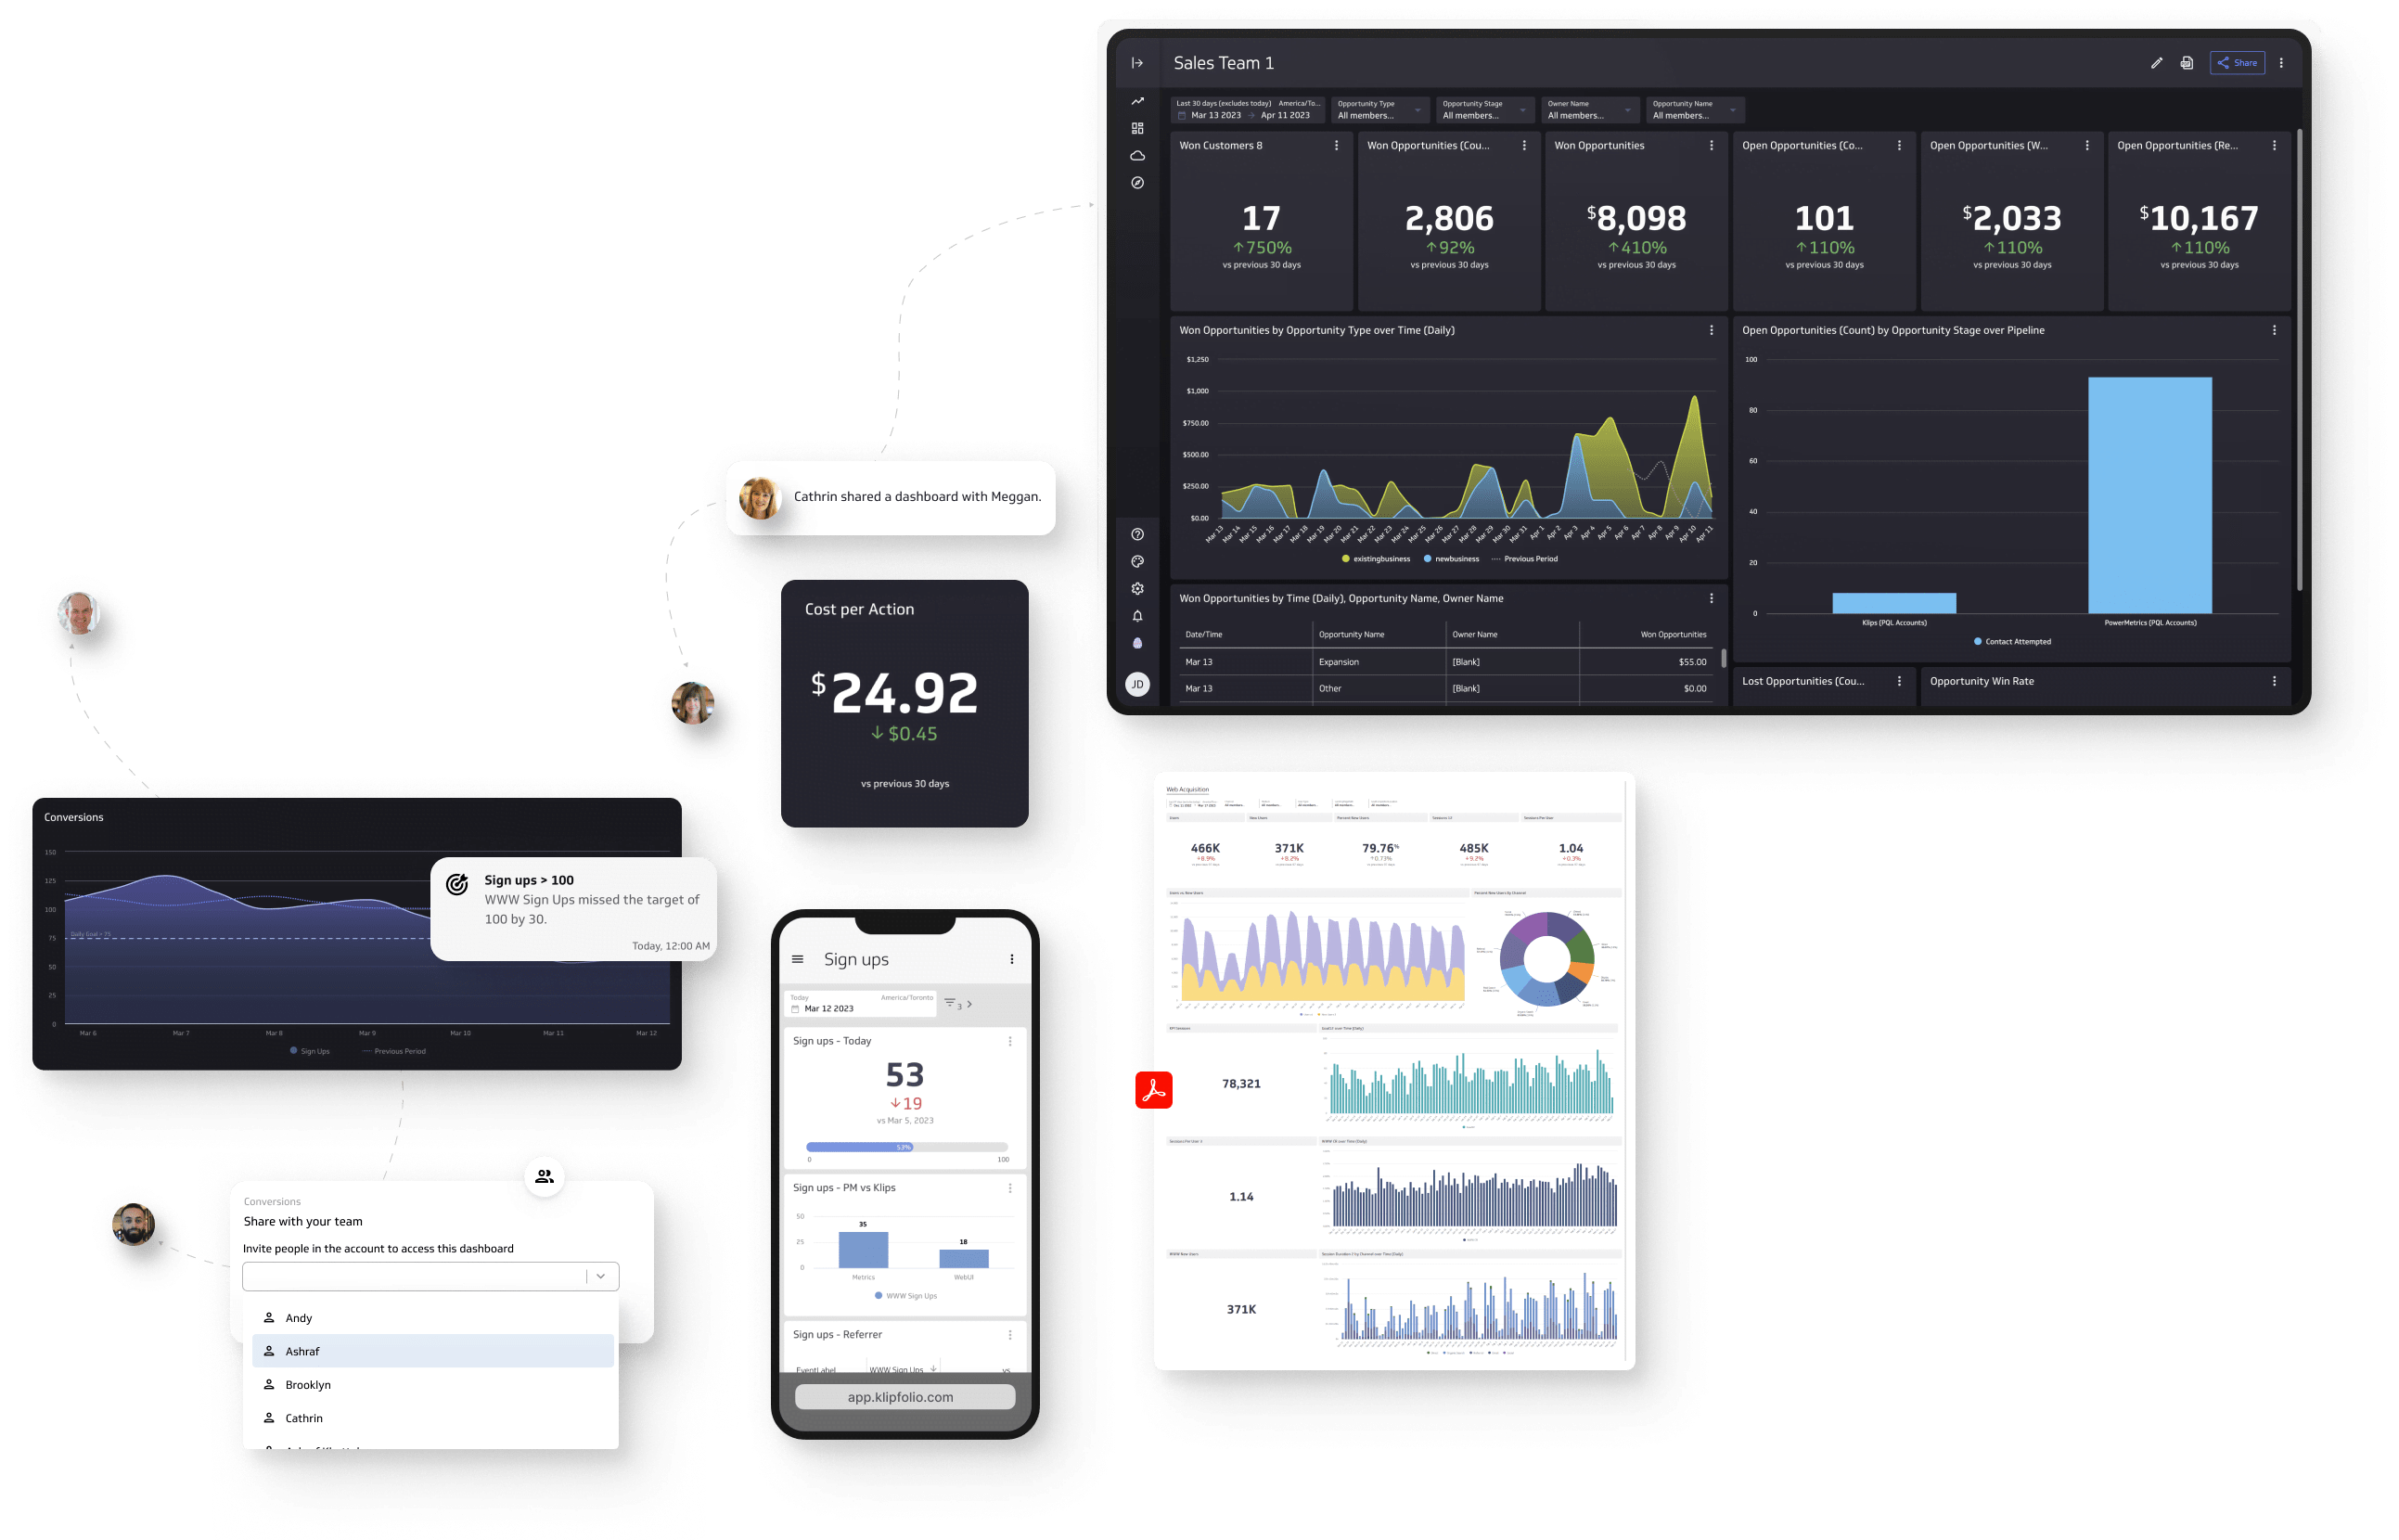
Sharing is caring.
And good business.
Share your dashboards with colleagues so you're all using the same data for decision-making. Better yet, share metrics and empower teams to set up dashboards themselves with their own business logic, dimensionality, granularity, and visualizations.
We love what we do,
and so do our customers
PowerMetrics has been helping teams just like yours organize, visualize, and share metrics since 2019. With extensive docs, an AI-powered help UI, friendly support staff, a free tier, and surprisingly low pricing, now's the time to give us a try.

Klipfolio PowerMetrics
Features
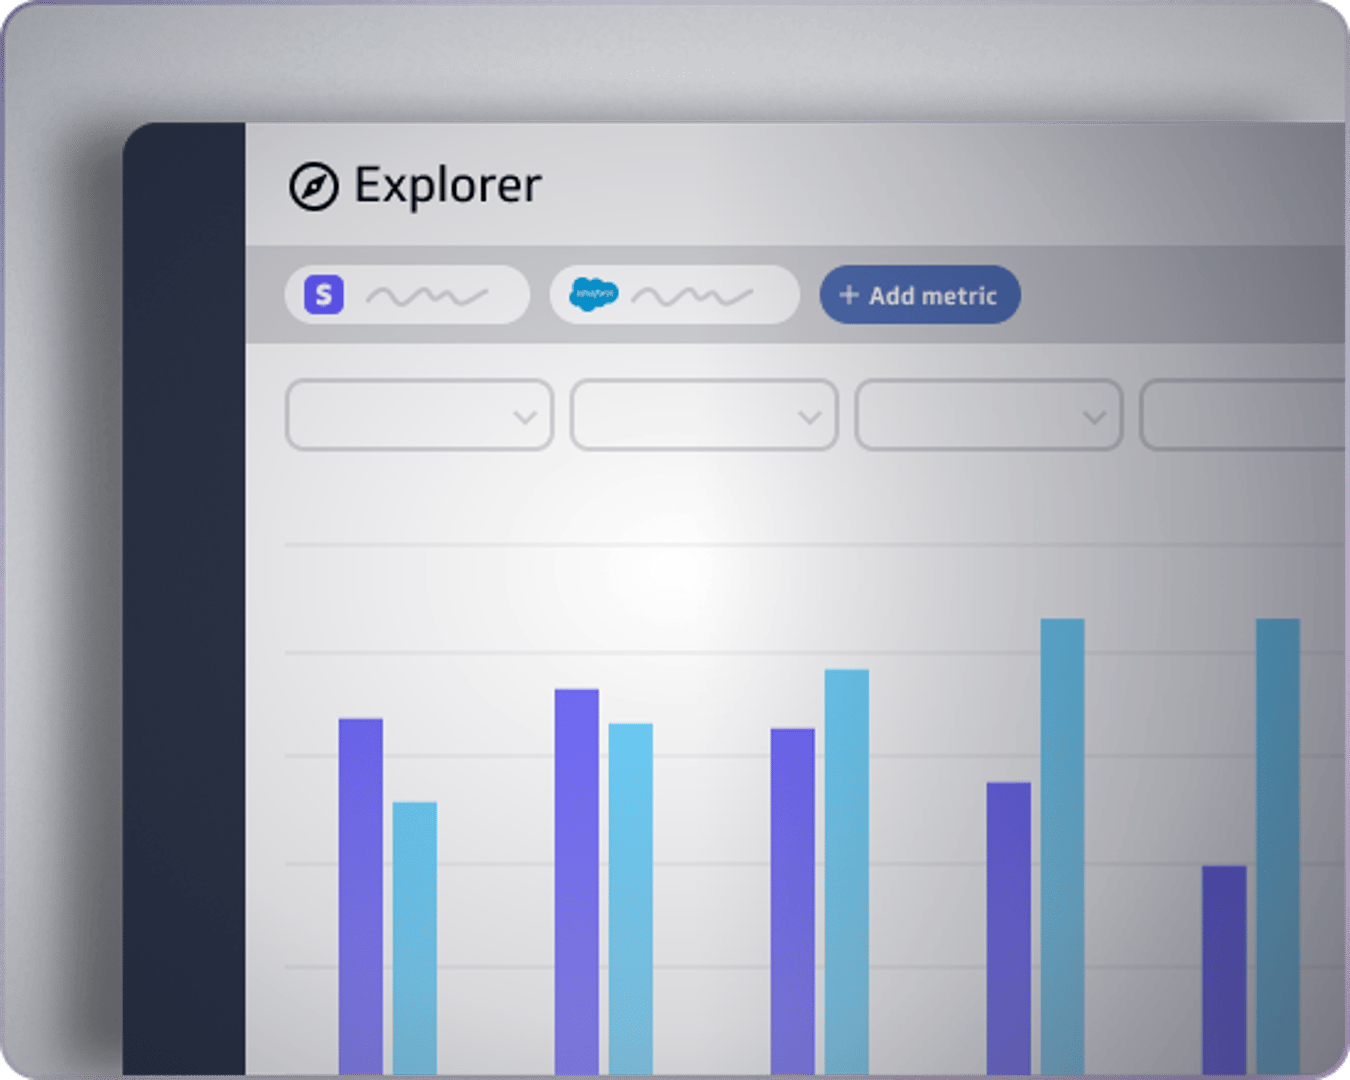
Explorer
A playful environment for deep-dive data analysis. Combine data from different sources and use the full suite of visualization options.
Learn more
Data Storage & History
Store all your data history in PowerMetrics. It's designed for time-series analysis and lets you understand your historical data quickly.
Learn more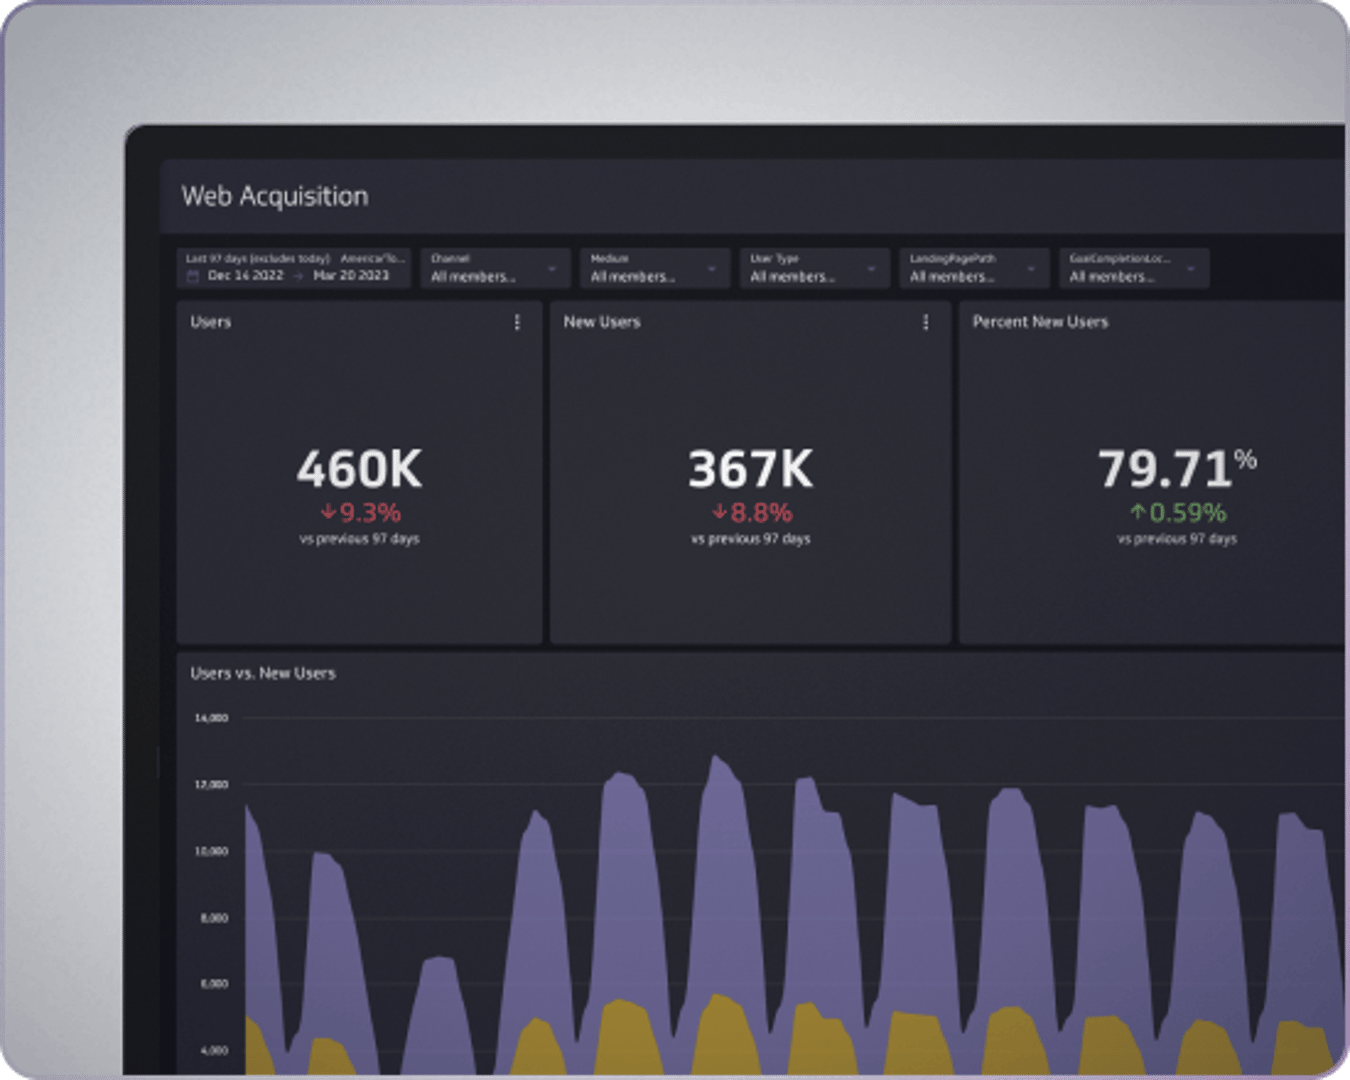
TV Dashboards
Display your dashboards on any screen, including TVs throughout the office, using either light or dark mode.
Learn more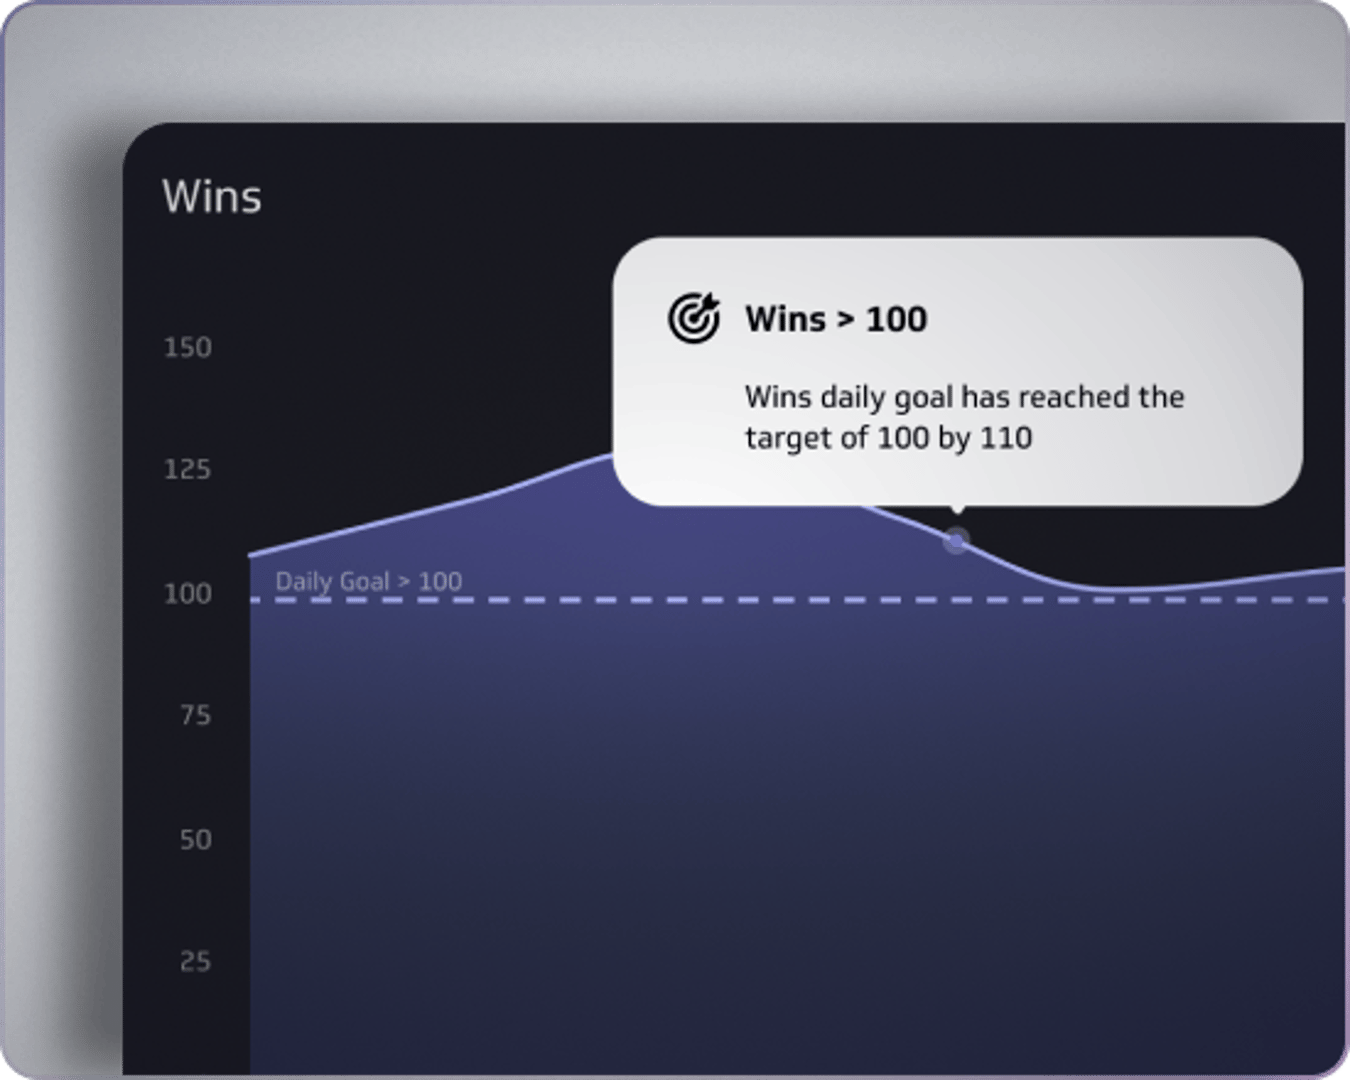
Goals
Track progress by adding up to 10 goals to each metric and display them on your dashboards.
Learn more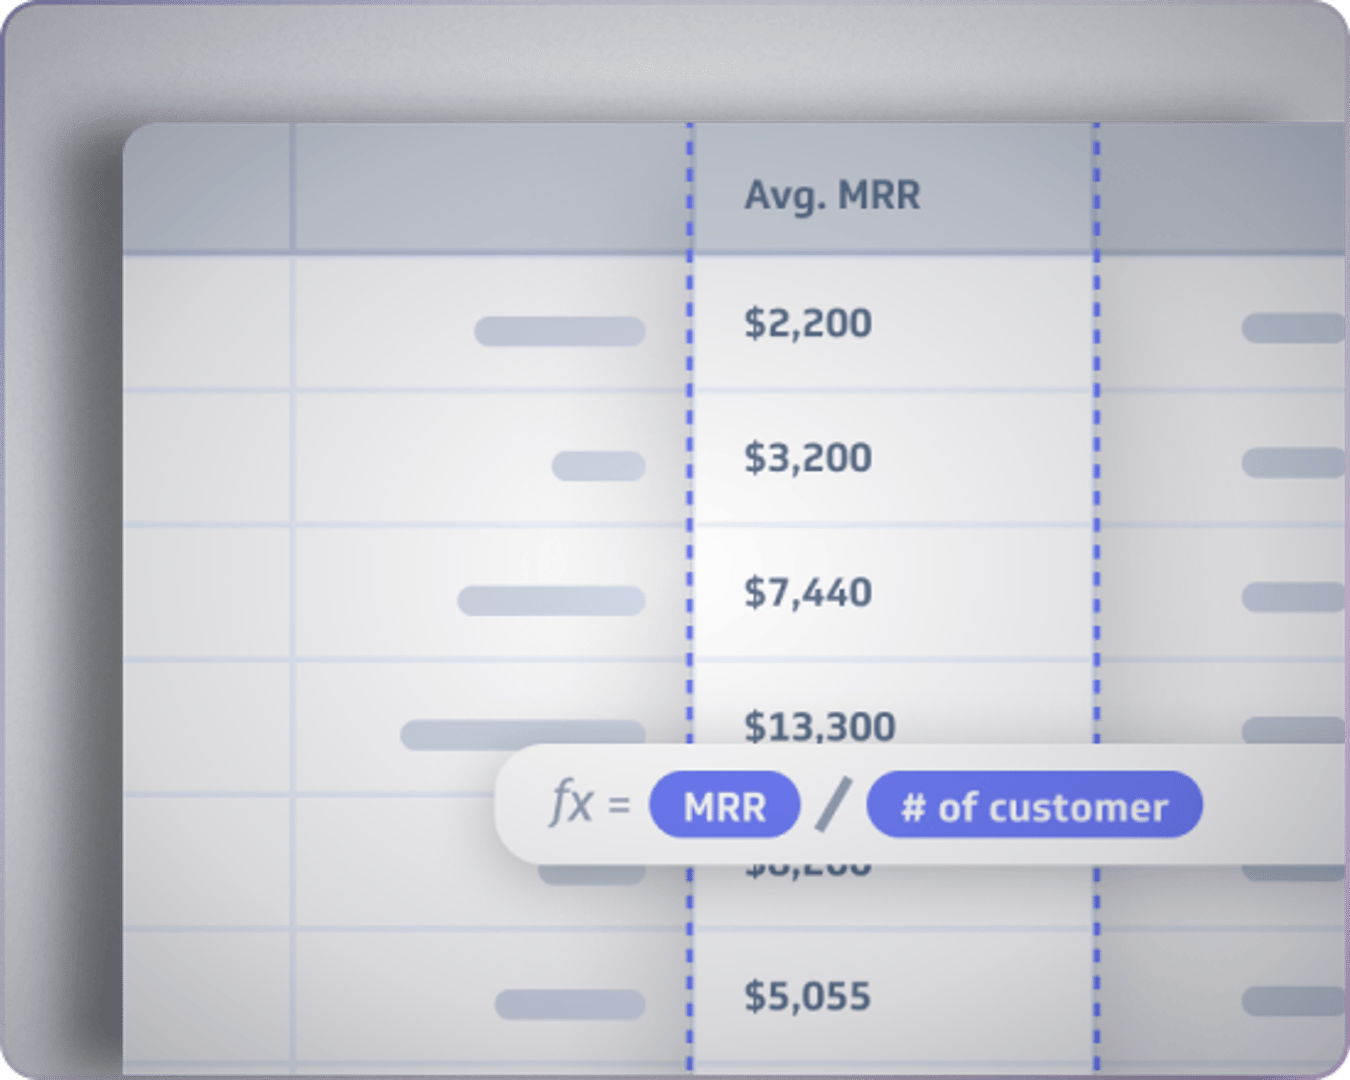
Data Prep
Retrieve and perfect your data using Data Feeds. The all-in-one visual query builder and data transformation tool brings any data into the right shape.
Learn more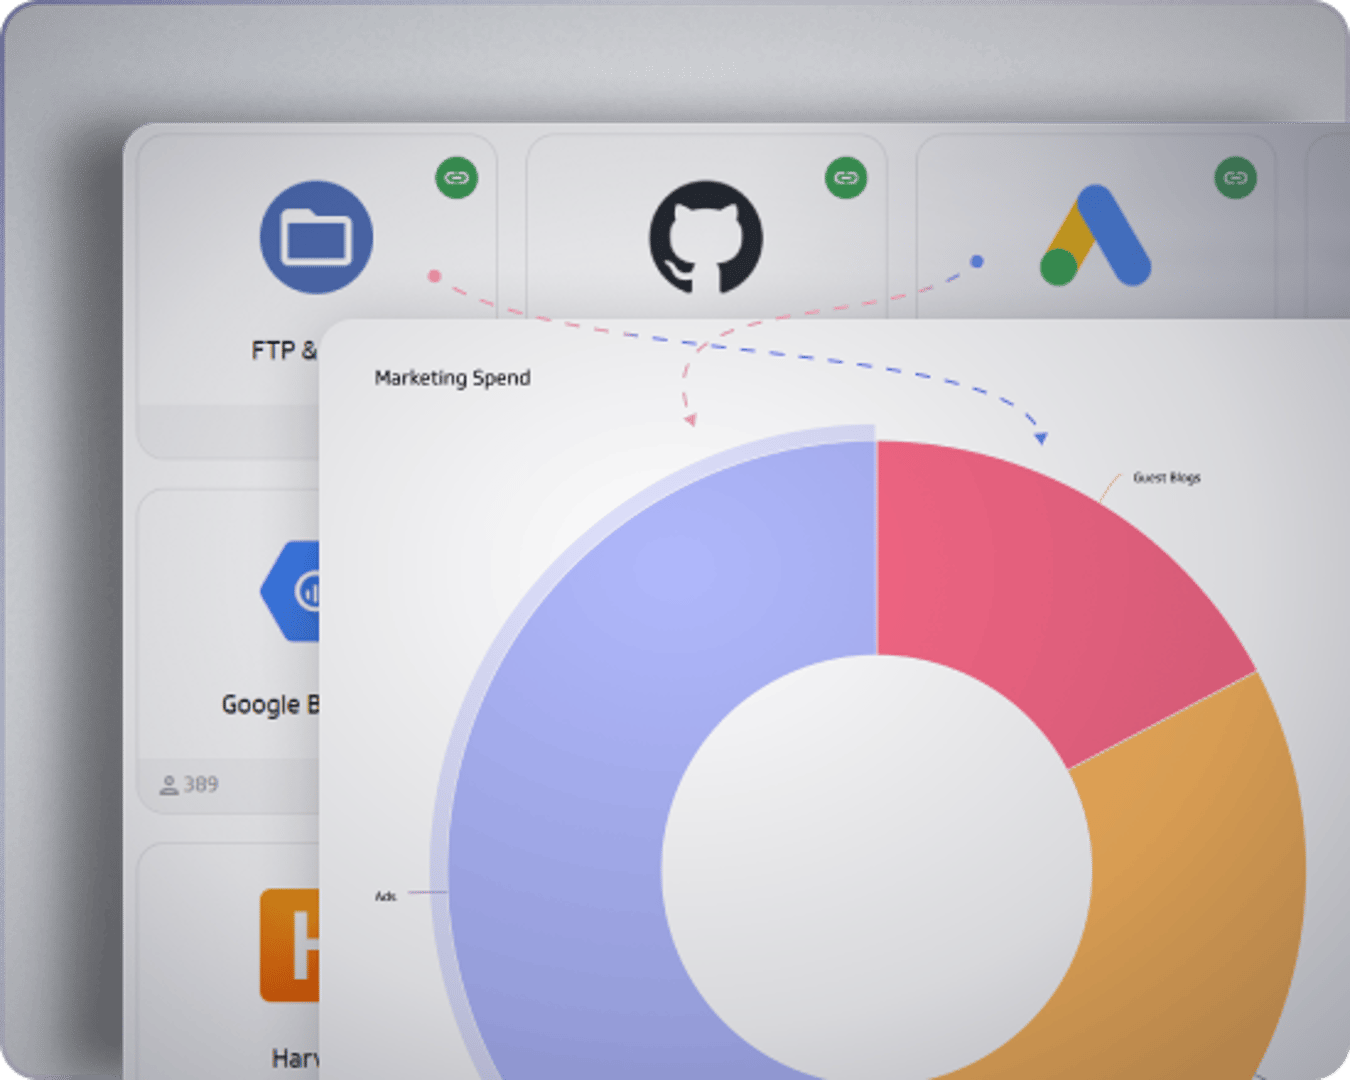
Custom Metrics
Create any metric using any data source and structure. It's intuitive, flexible and you get to explore, make changes and see a live preview.
Learn moreVisualize data directly from the cloud
Build pixel-perfect dashboards and reports
Build real-time visualizations using functions, formulas and advanced customizations with Klipfolio Klips.
- Automated reporting with scheduled PDF reports, published links, TV dashboards, and embedded Klips
- Advanced client management to centralize customer data
Managing clients? Learn more about Klips for partners.