Dashboard Examples and Templates
See over 60 dashboards we’ve curated for Executives, Sales, Marketing, Social Media, and more. Check out our gallery to get inspired in building your own today!
Track all your KPIs in one place
Sign up for a 14-day free trial and start making decisions for your business with confidence.
Dashboard examples in summary
In today's business environment, the tendency is towards more and more data – so much so that it's called Big Data. Managing and extracting real value from all the data that is created and stored from all the apps and systems we use is quickly becoming a "BIG" challenge facing all businesses whether you're small or large.
"A well designed dashboard is a remarkable and simple way to share information when and where needed!"
Through the use of data visualizations and data analytics, data-driven organizations need to simplify complex processes into manageable, digestible chunks of information so that employees can focus on their day to day operations of the business thru flexible business dashboard software. Seeking ways to simplify data analysis and sharing insights to make data driven decisions is no longer a luxury and never been easier with the ease of sharing complex data sets to provide users with at a glance awareness of current performance that can be shared in a multitude of ways including mobile, wallboards, PDF reports, TVs and much more. What will you build today to share within your organization?
How to use these business dashboard reporting examples
The business dashboard examples in this section are designed to provide ideas for setting up KPI reports for your organization. Each example has been curated by the Klipfolio team based on more than 15 years in the data and analytics space.
What is an example of a good dashboard?
A good dashboard provides a comprehensive view overview of business operations by combining data from multiple sources. It should display real-time, accurate data visualizations that are customized to meet your organization’s specific needs.
Moreover, the best dashboards are user-friendly, offering customization through interactive features and dashboard templates, allowing you to drill down into data for deeper analysis. They’re also visually appealing to make data easily digestible regardless of the user’s expertise.
Understanding what goes into a good dashboard is one thing, but knowing where to start is a different matter altogether. These dashboard templates can serve as a starting point in your data visualization journey.
Best dashboard examples
The dashboard examples below make analyzing data easier by integrating different KPIs and performance metrics into a single display. Now, you can get detailed insights at a glance from KPIs that are important for your team to boost your strategies and campaigns.
Each example has been curated by the Klipfolio team based on more than 15 years in the data and analytics space.
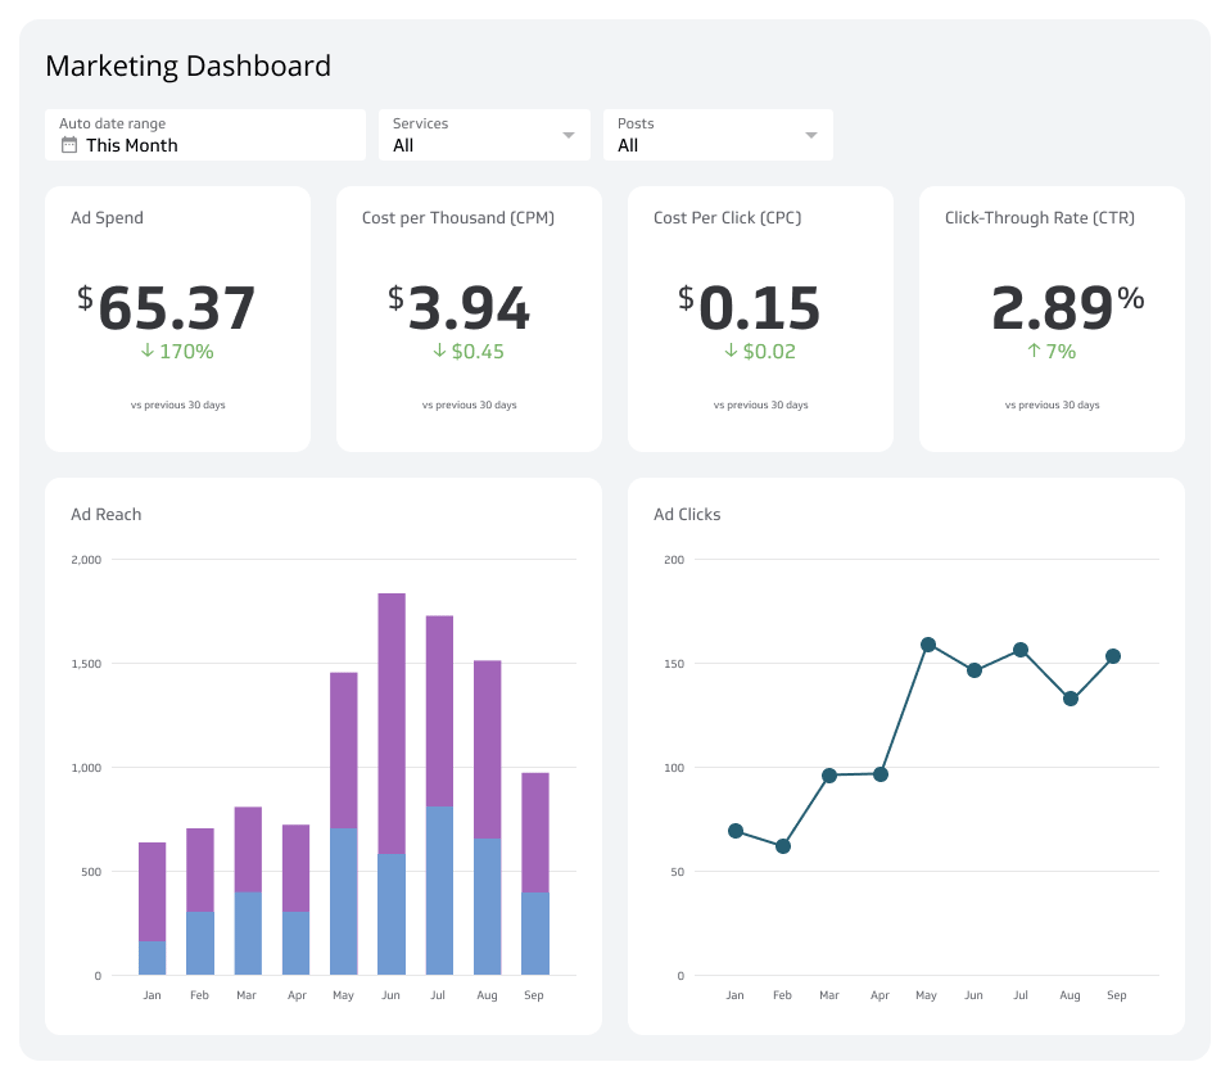
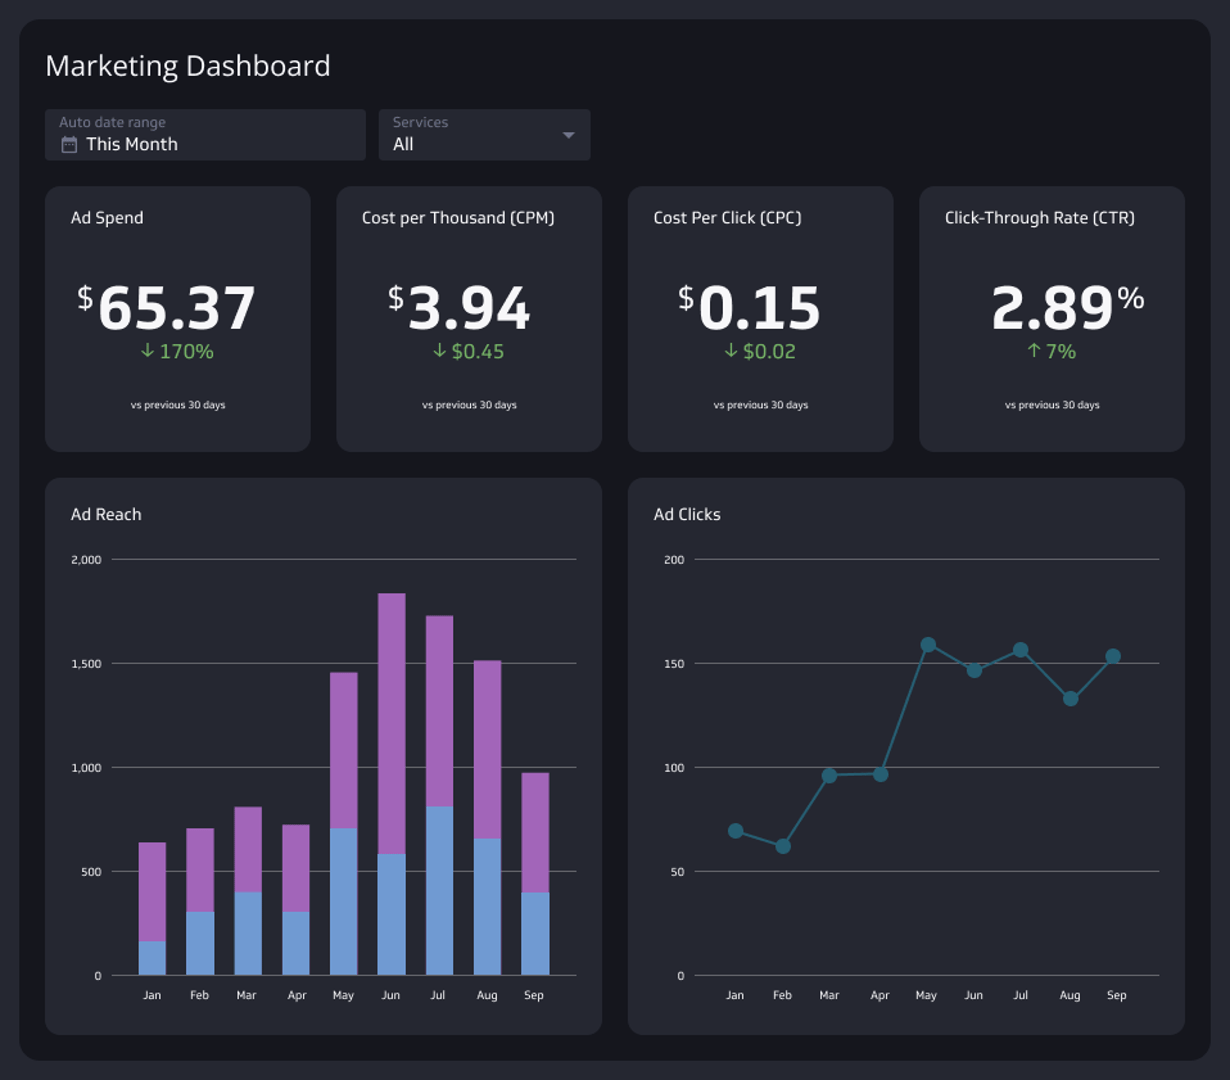
Marketing Dashboard
Harness the power of digital marketing with this dashboard, designed to track your marketing campaigns effectively. Gain valuable insights from your KPIs to reach your target audience across digital channels, from search engines to email, and drive growth in your marketing efforts.
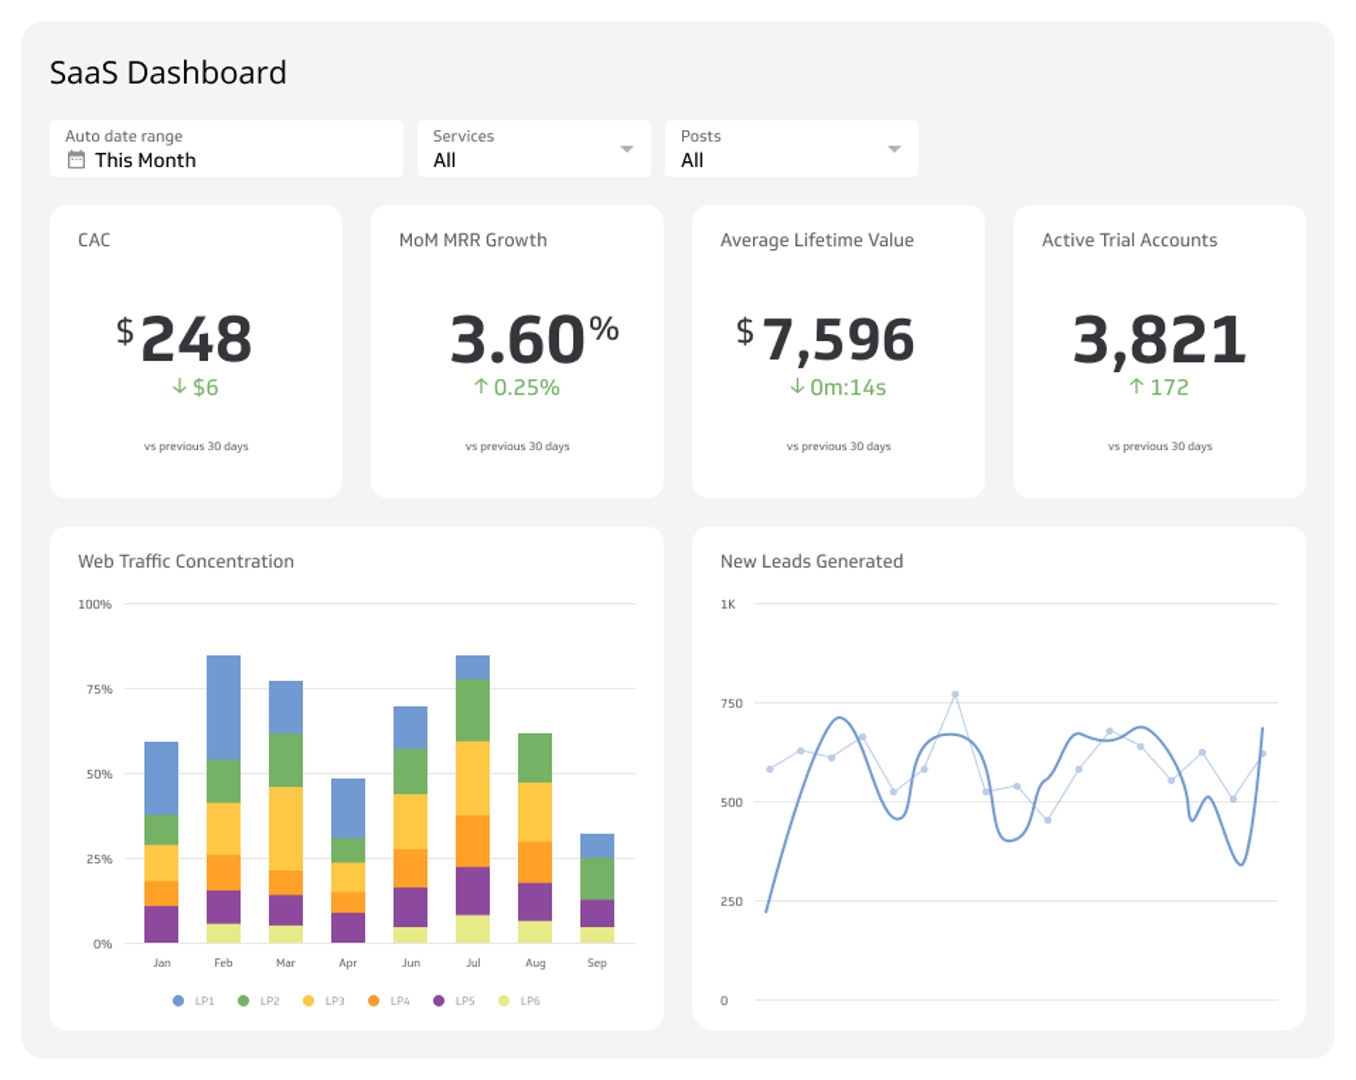
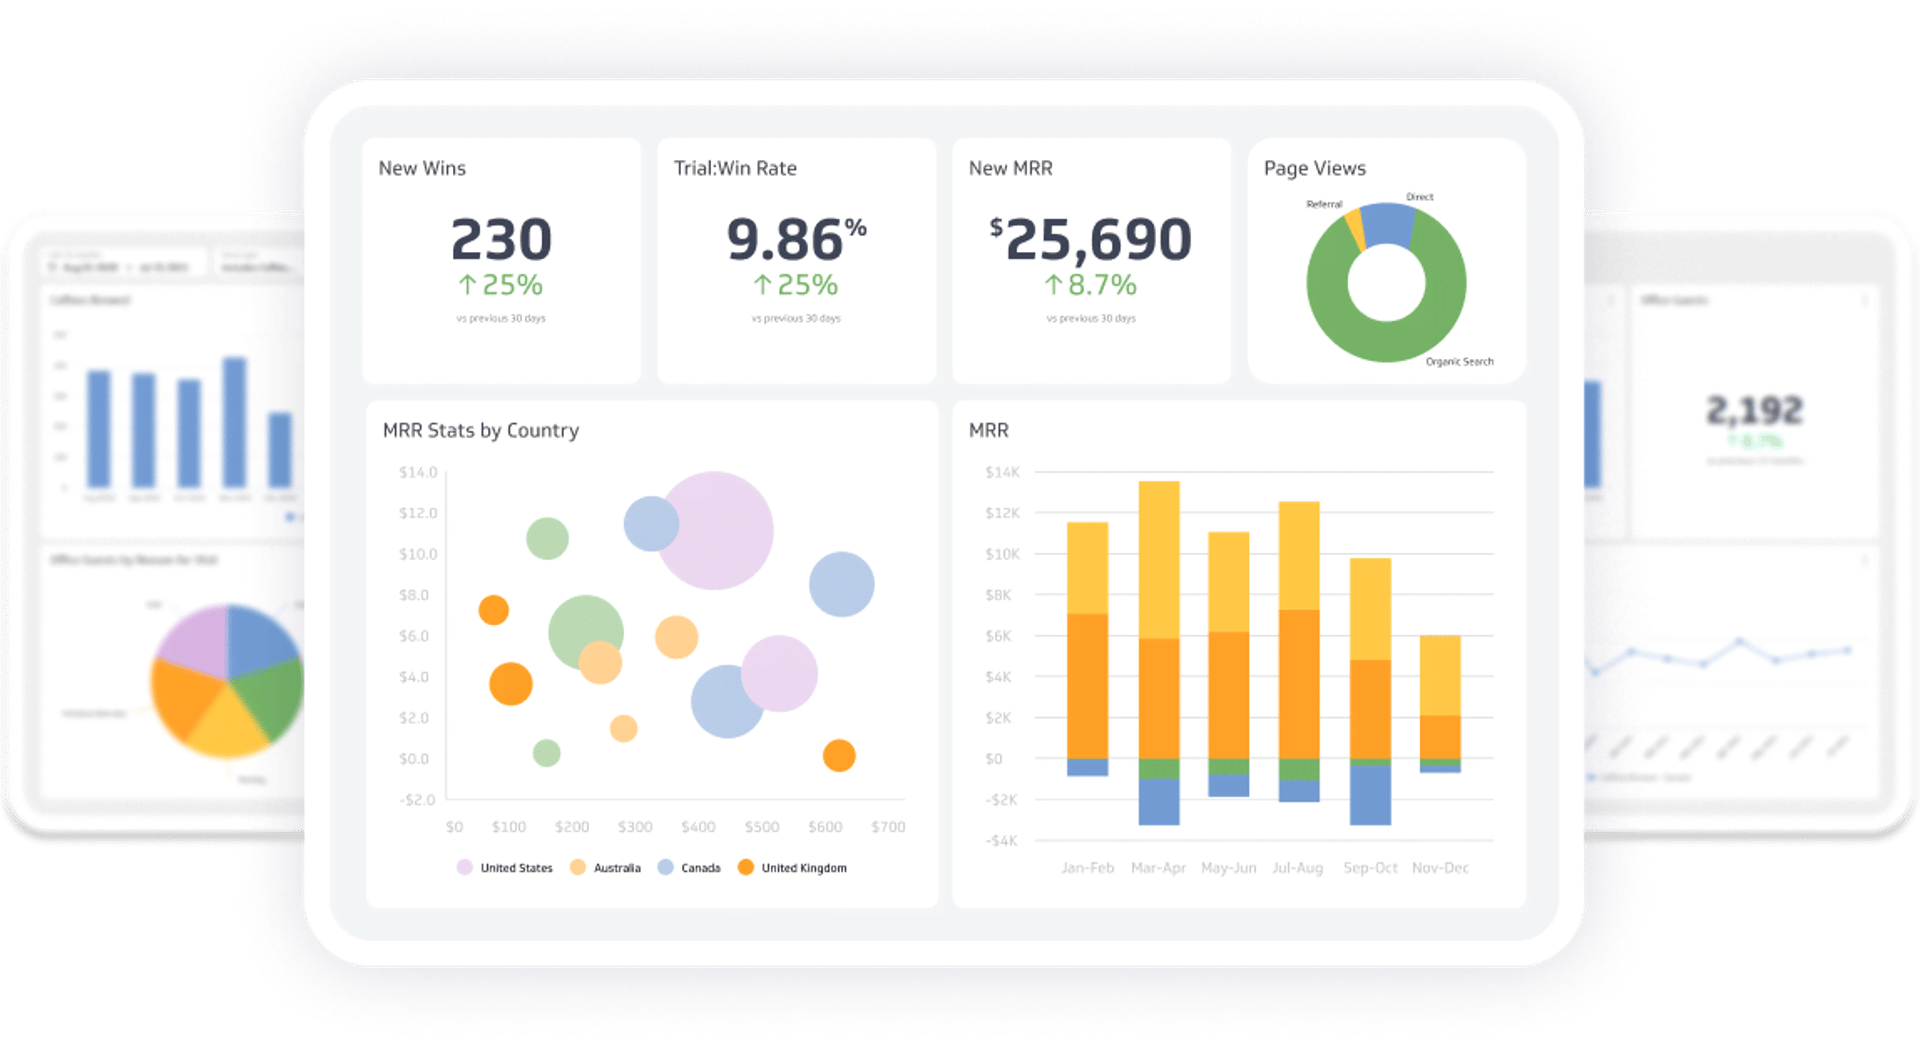
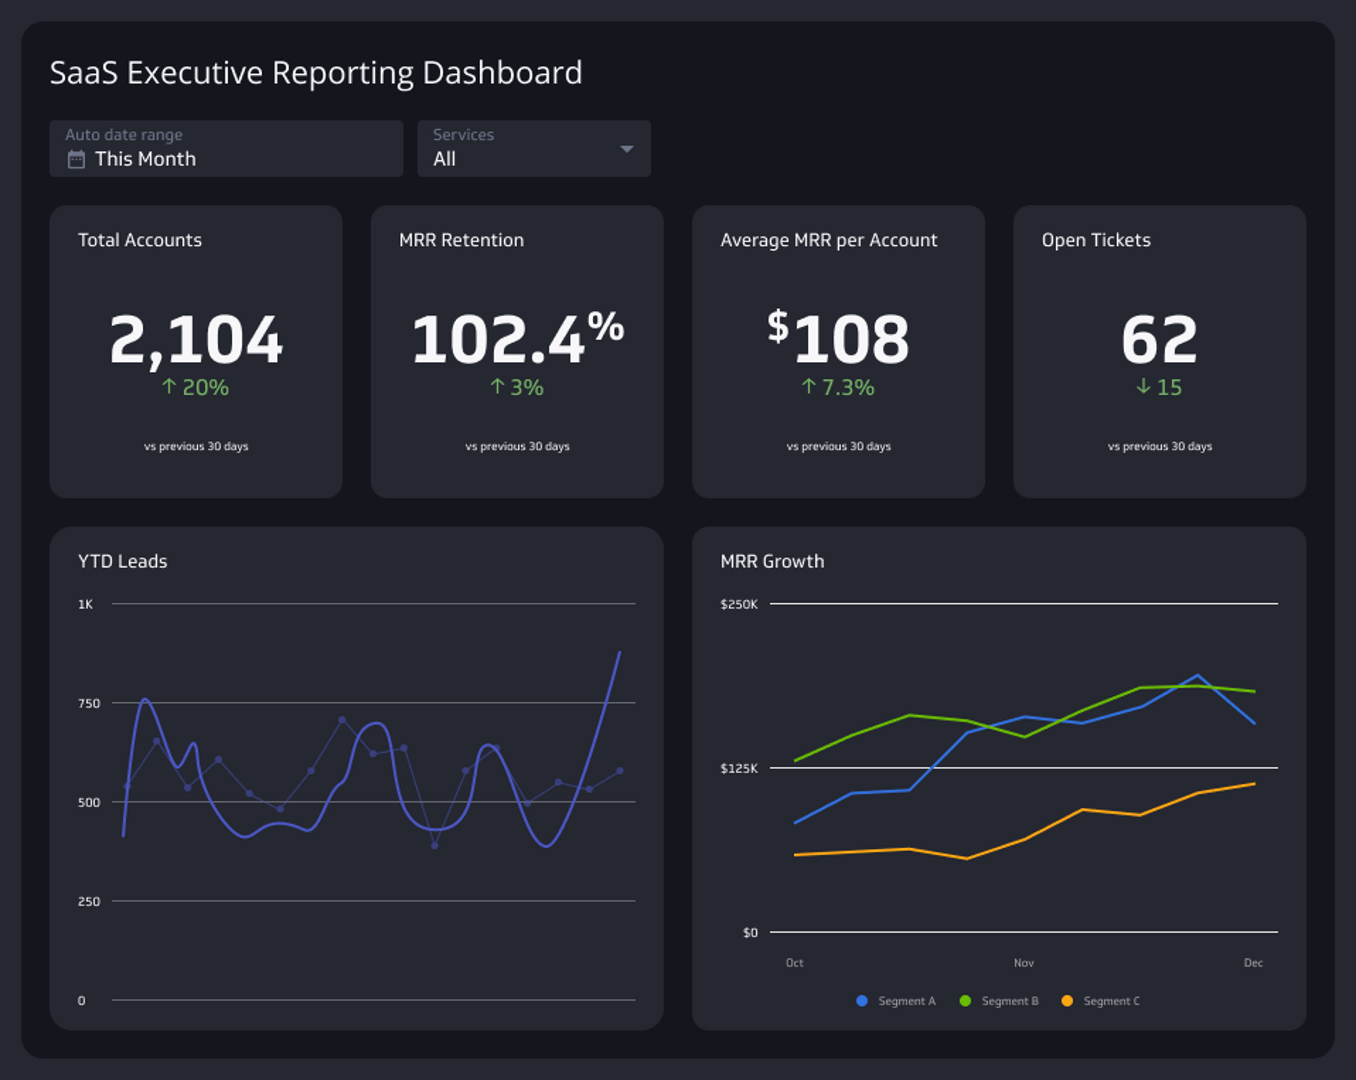
SaaS Dashboard
SaaS (Software as a Service) businesses operate in a fiercely competitive market. A SaaS Dashboard organizes key SaaS metrics from sales, marketing, finance, support, and development teams to give executives a bird’s-eye view of the business.
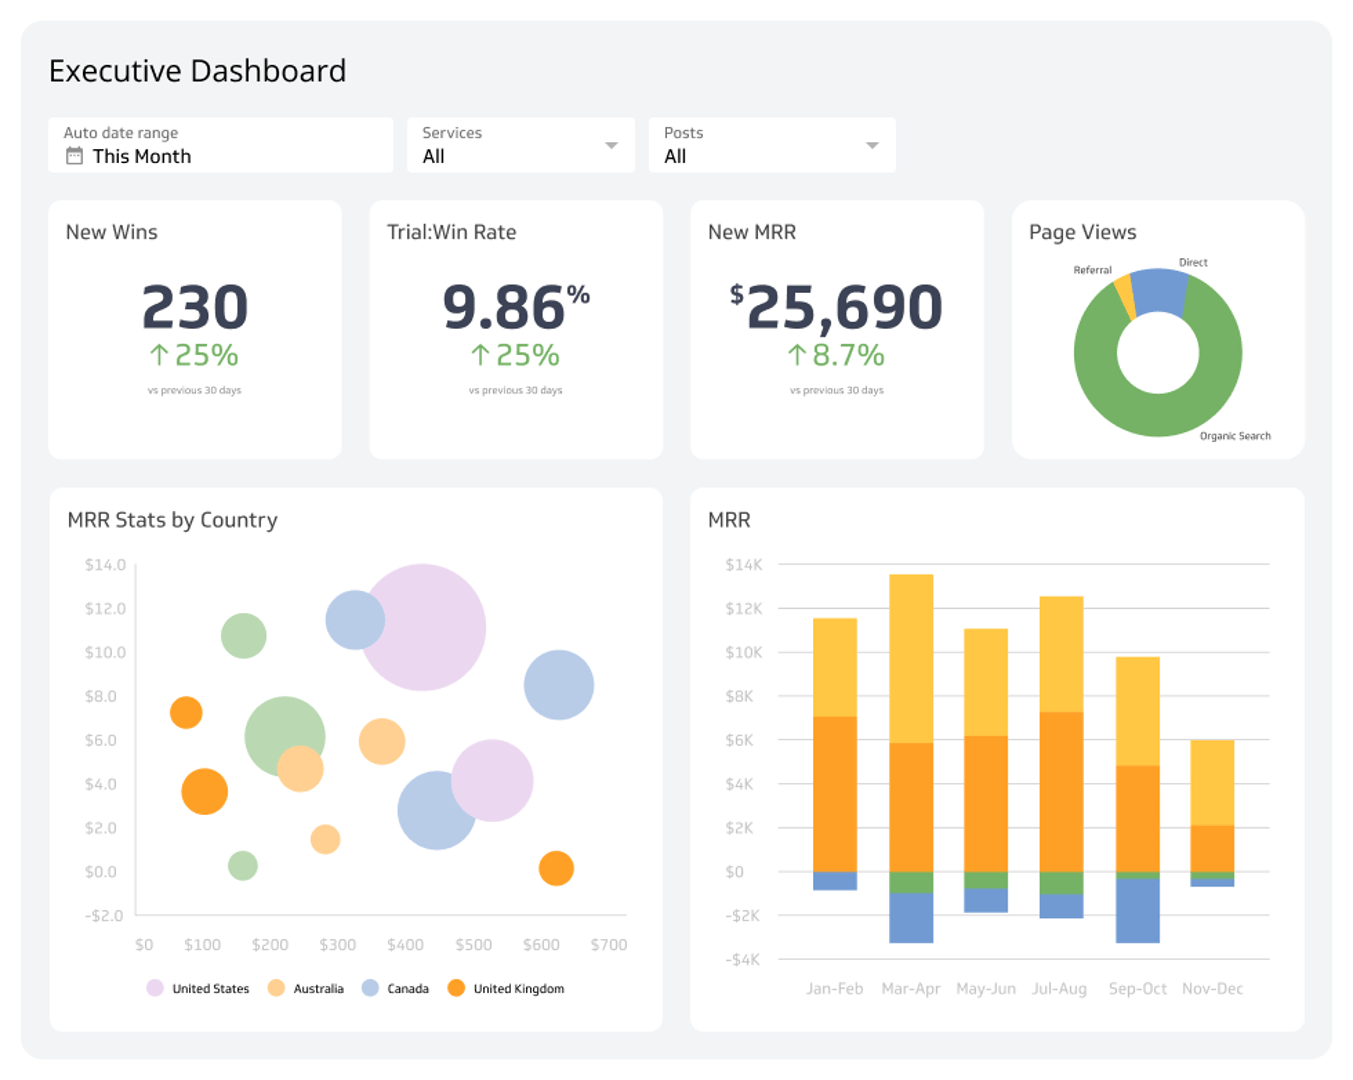
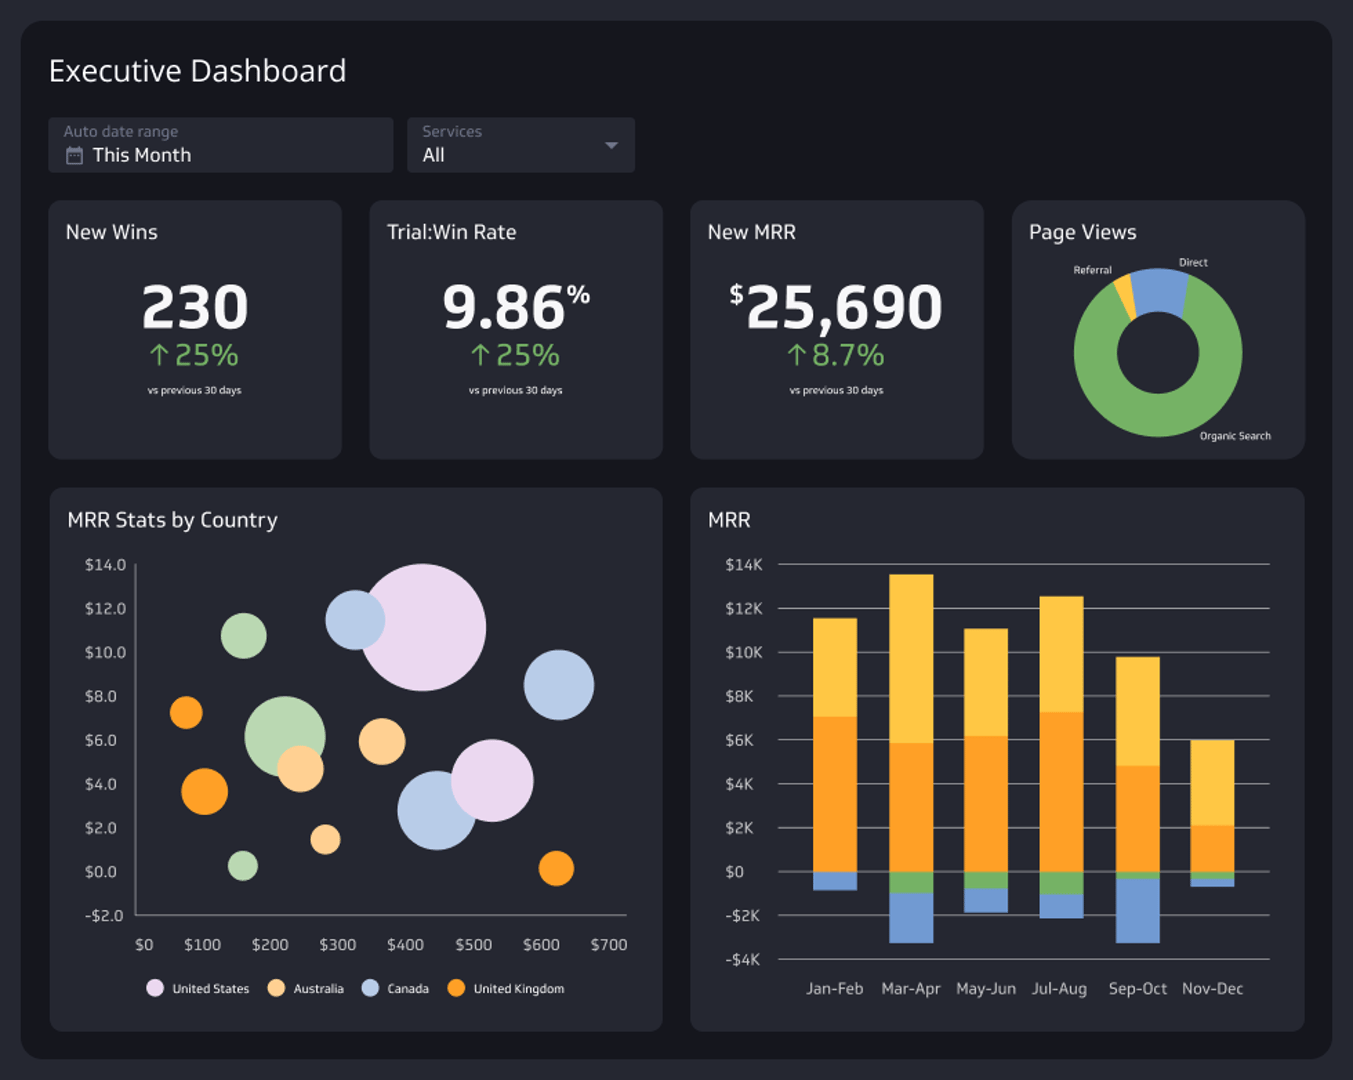
Executive Dashboard
Executive dashboards allow corporate leads to understand critical data points and make strategic decisions that are aligned with corporate objectives. They are composed of KPIs that allow for a quick review of the company’s performance, such as Sales Revenue DeDevelopment Cycle Time.
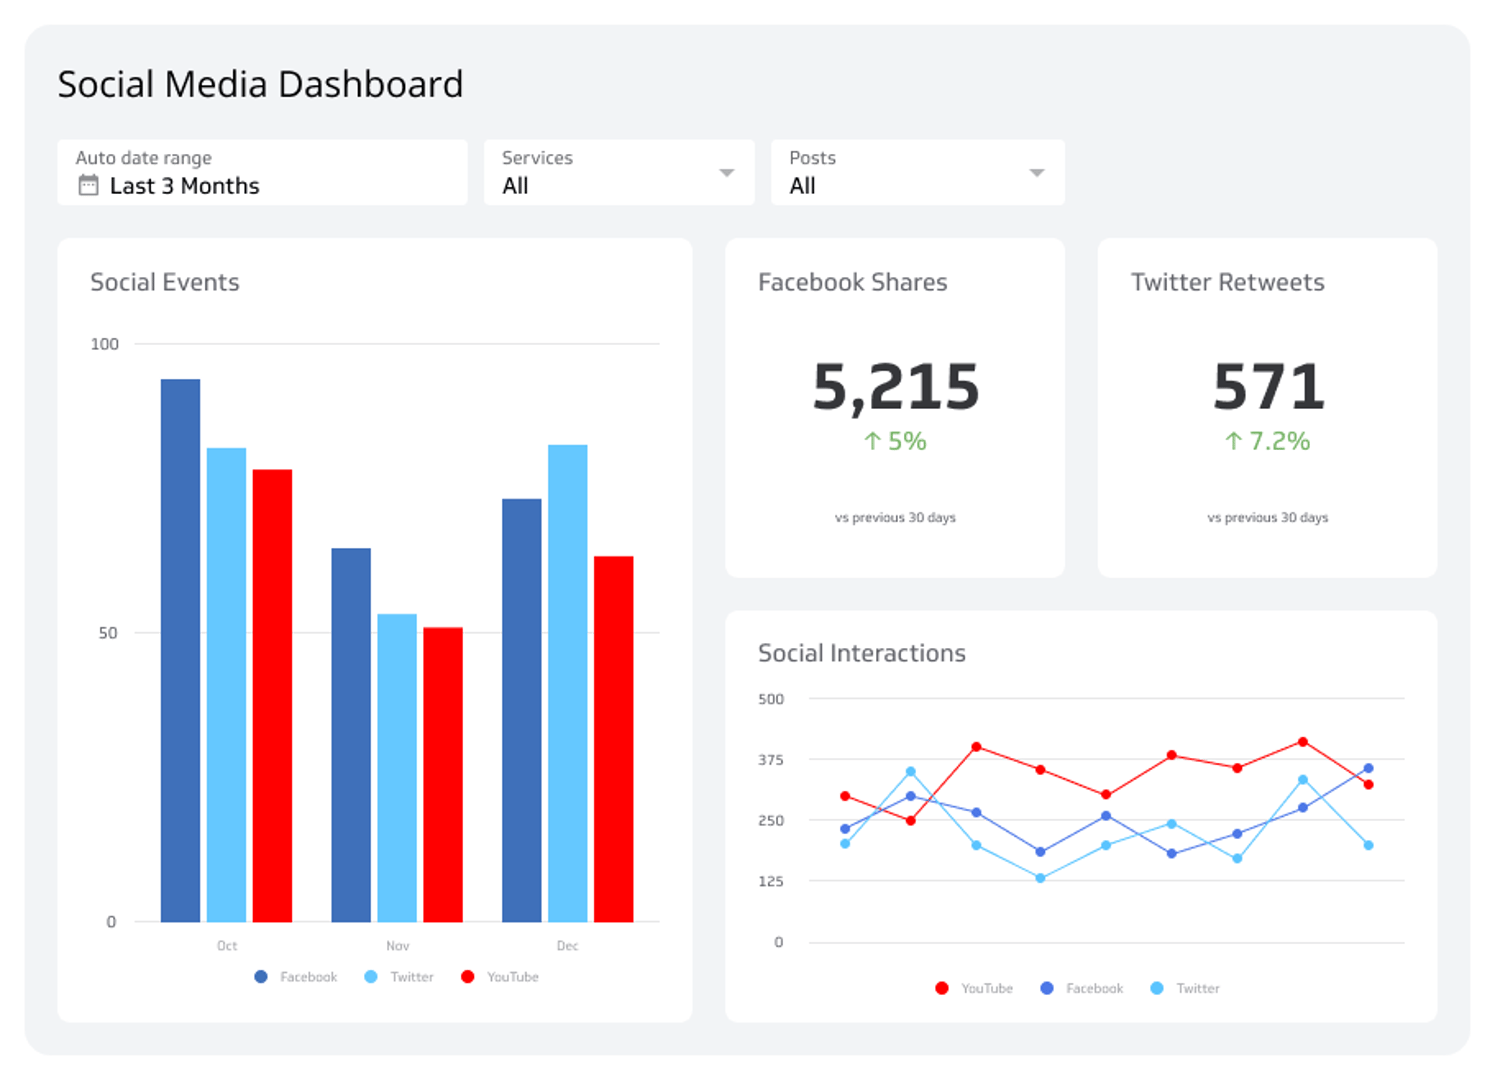
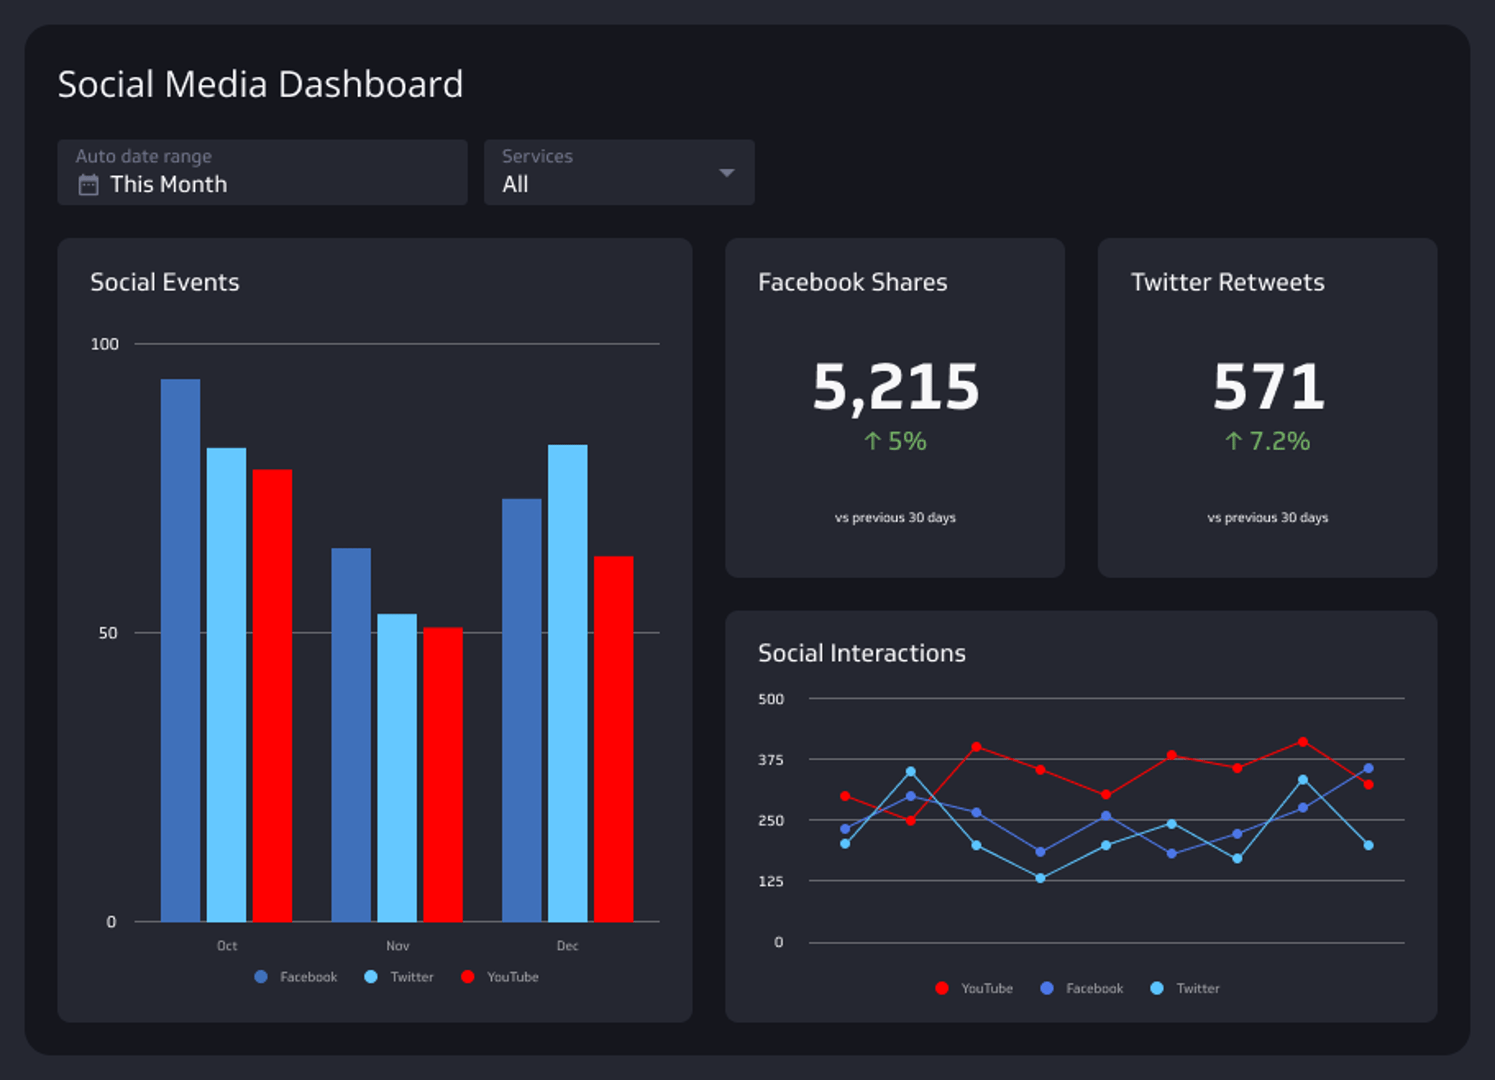
Social Media Dashboard
Stay on top of the latest trends with a comprehensive dashboard that tracks all critical metrics from Facebook, Twitter, Instagram, TikTok, and more in one view. Our tool can help you maximize engagement and refine your marketing tactics in real time.
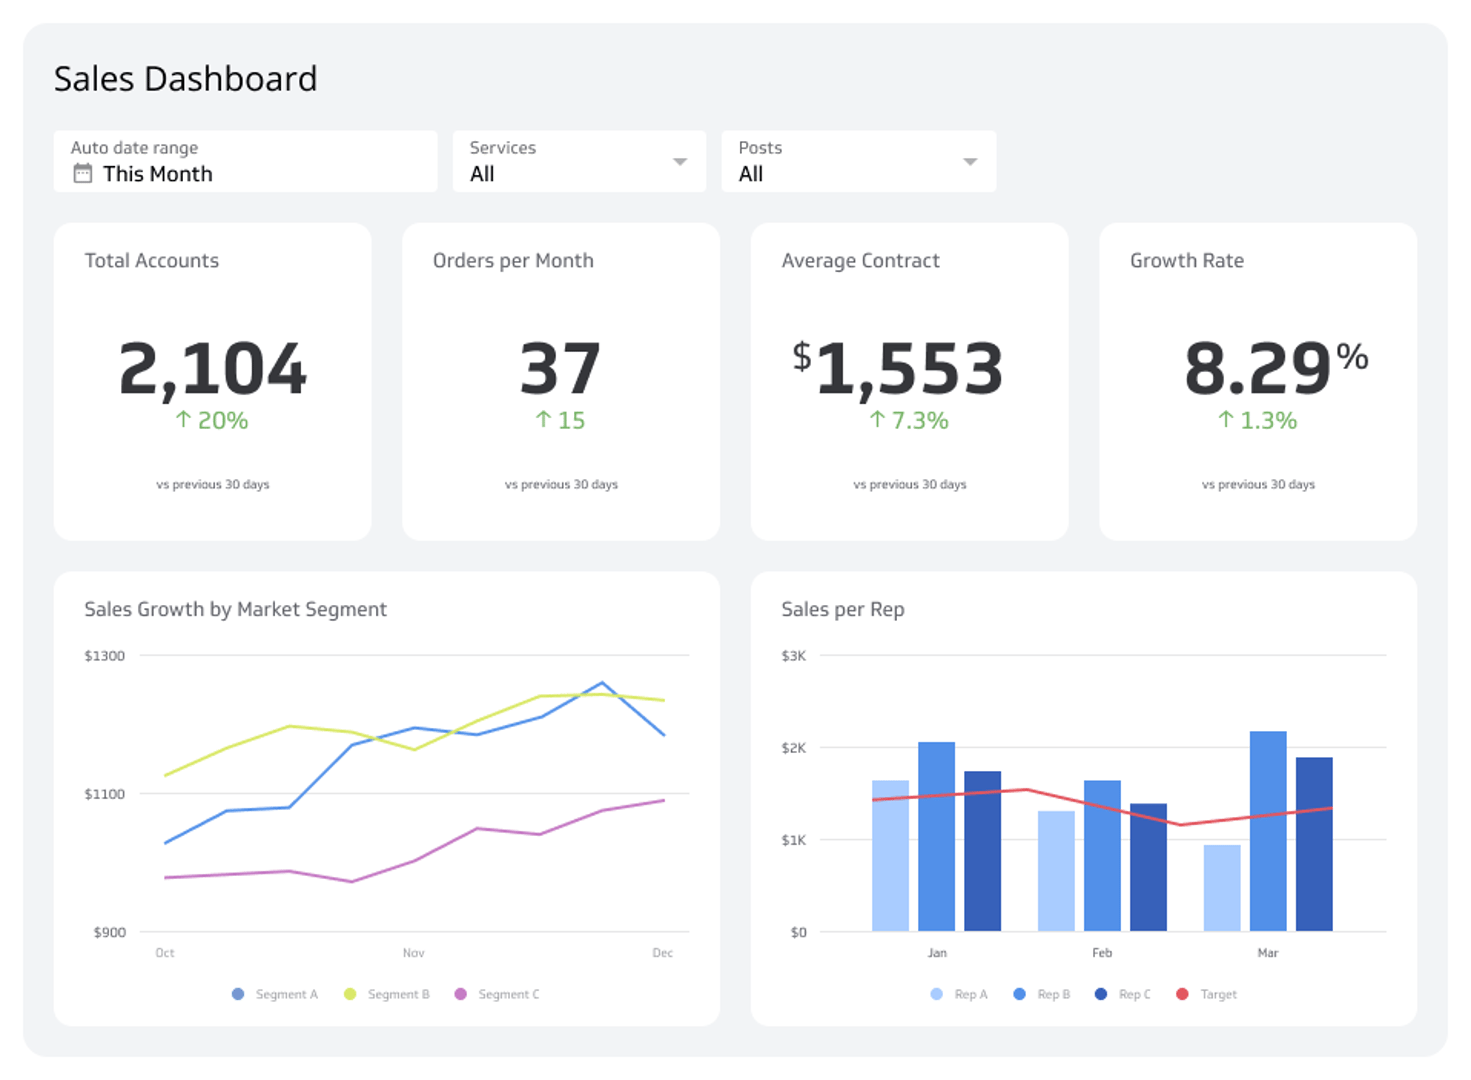
Sales Dashboard
Sales teams operate in a fast-paced, target-oriented environment. Modern, data-driven sales teams closely monitor individual and team performance to adjust and improve strategies in real time.

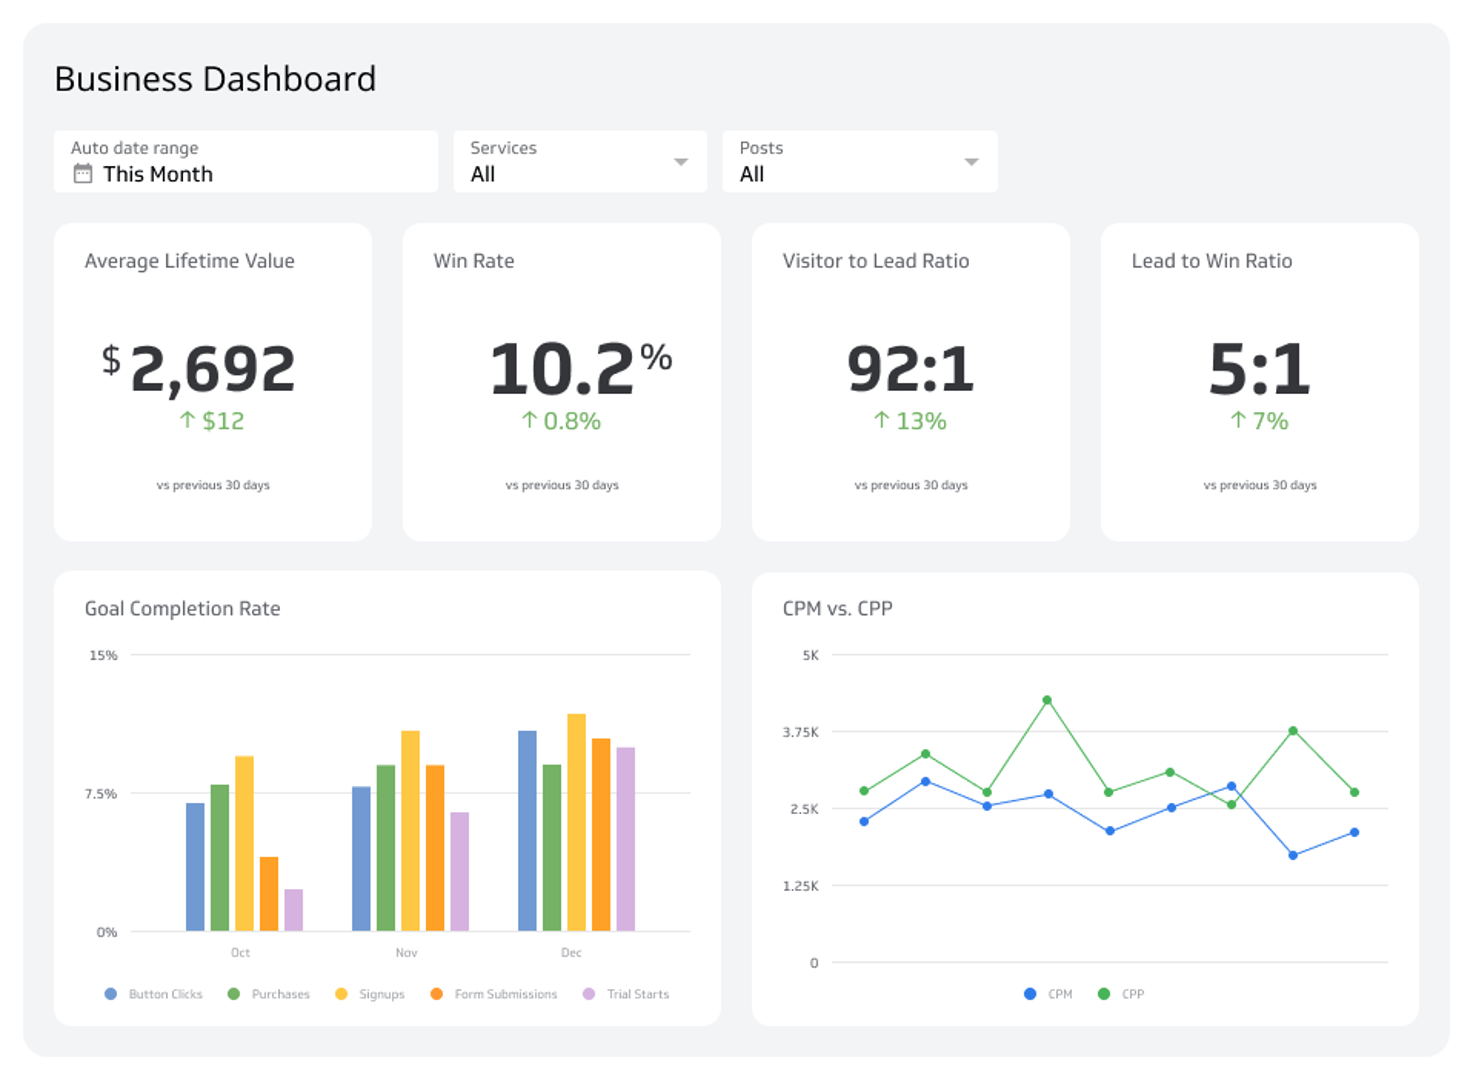
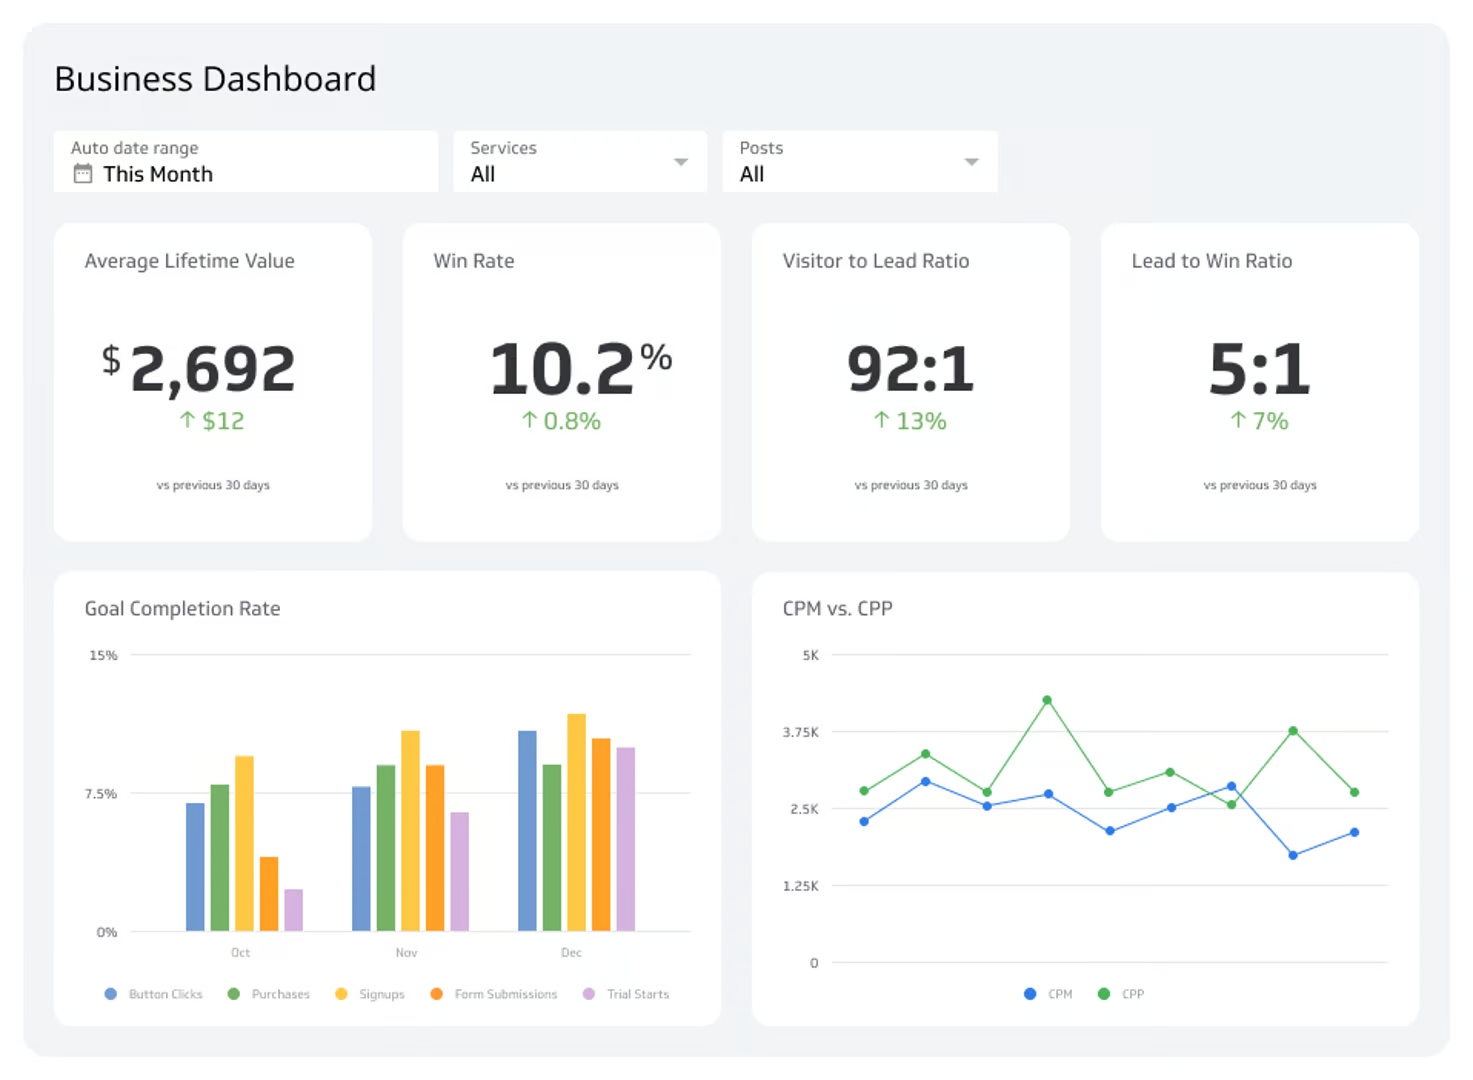
Business Dashboard
Monitor the health of your business in real-time.
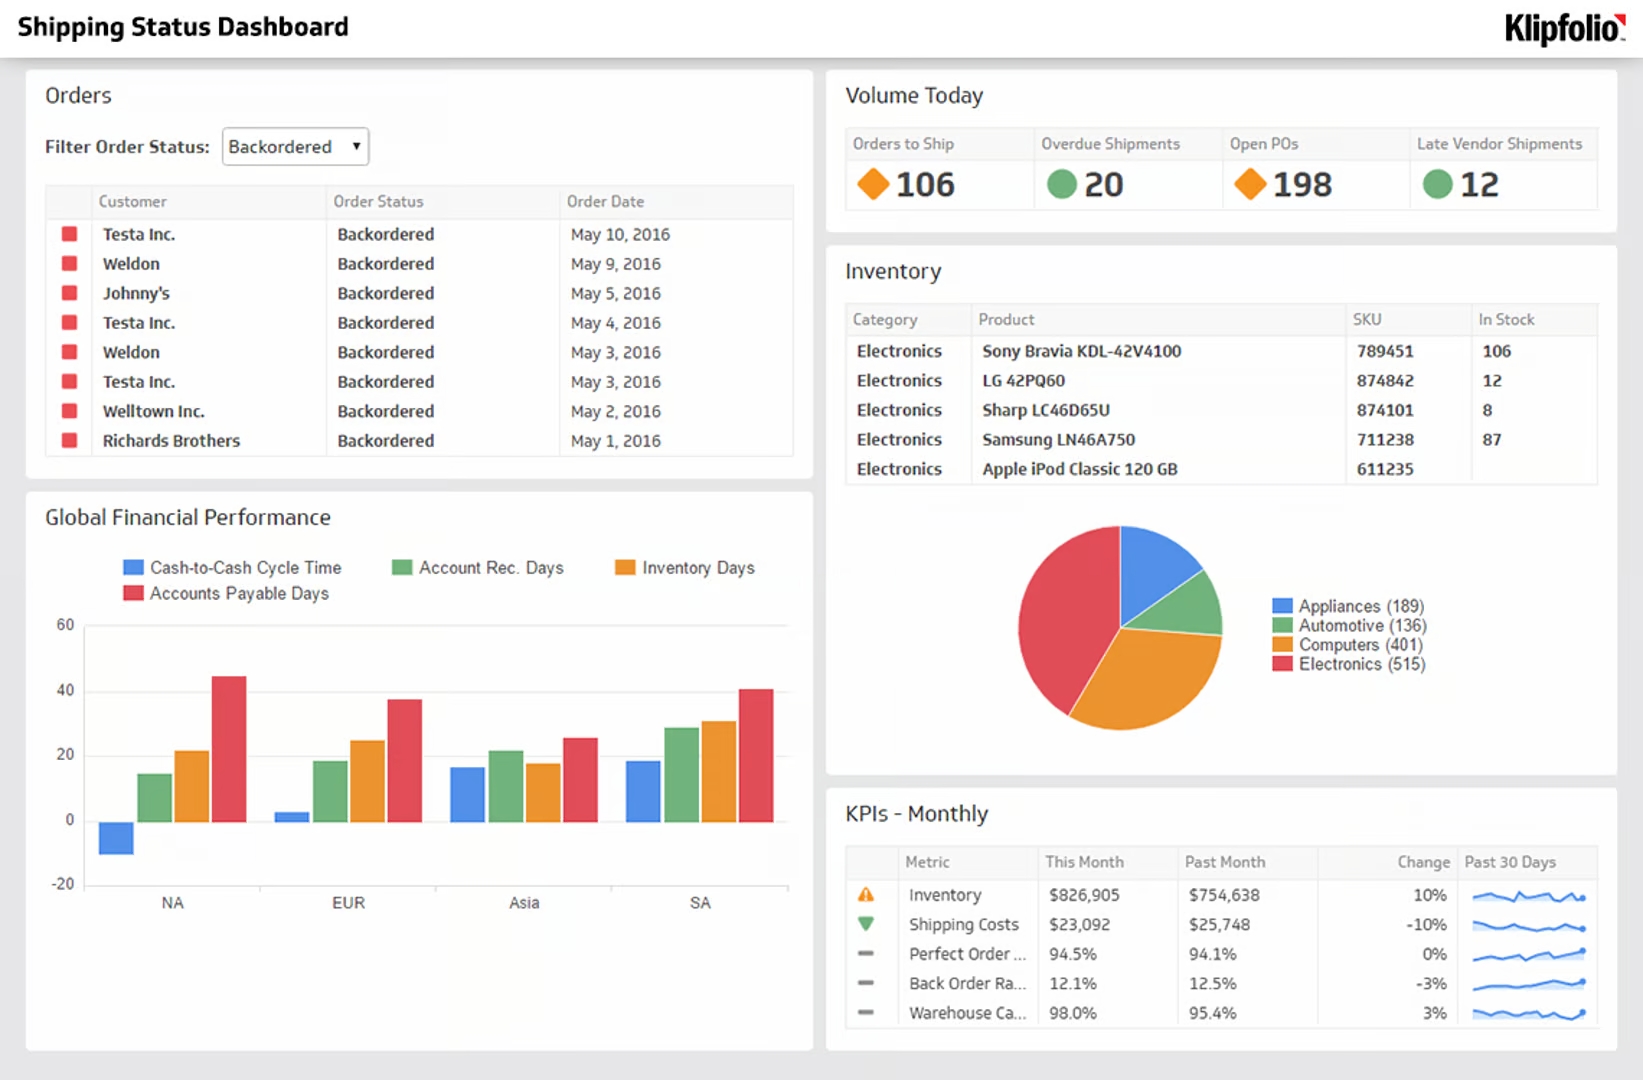
Supply Chain Dashboards
A Supply Chain Dashboard is a reporting tool used to track supply chain KPIs and metrics in a single display or interface. Supply chain dashboards track inventory levels, logistics management, and warehouse operations.
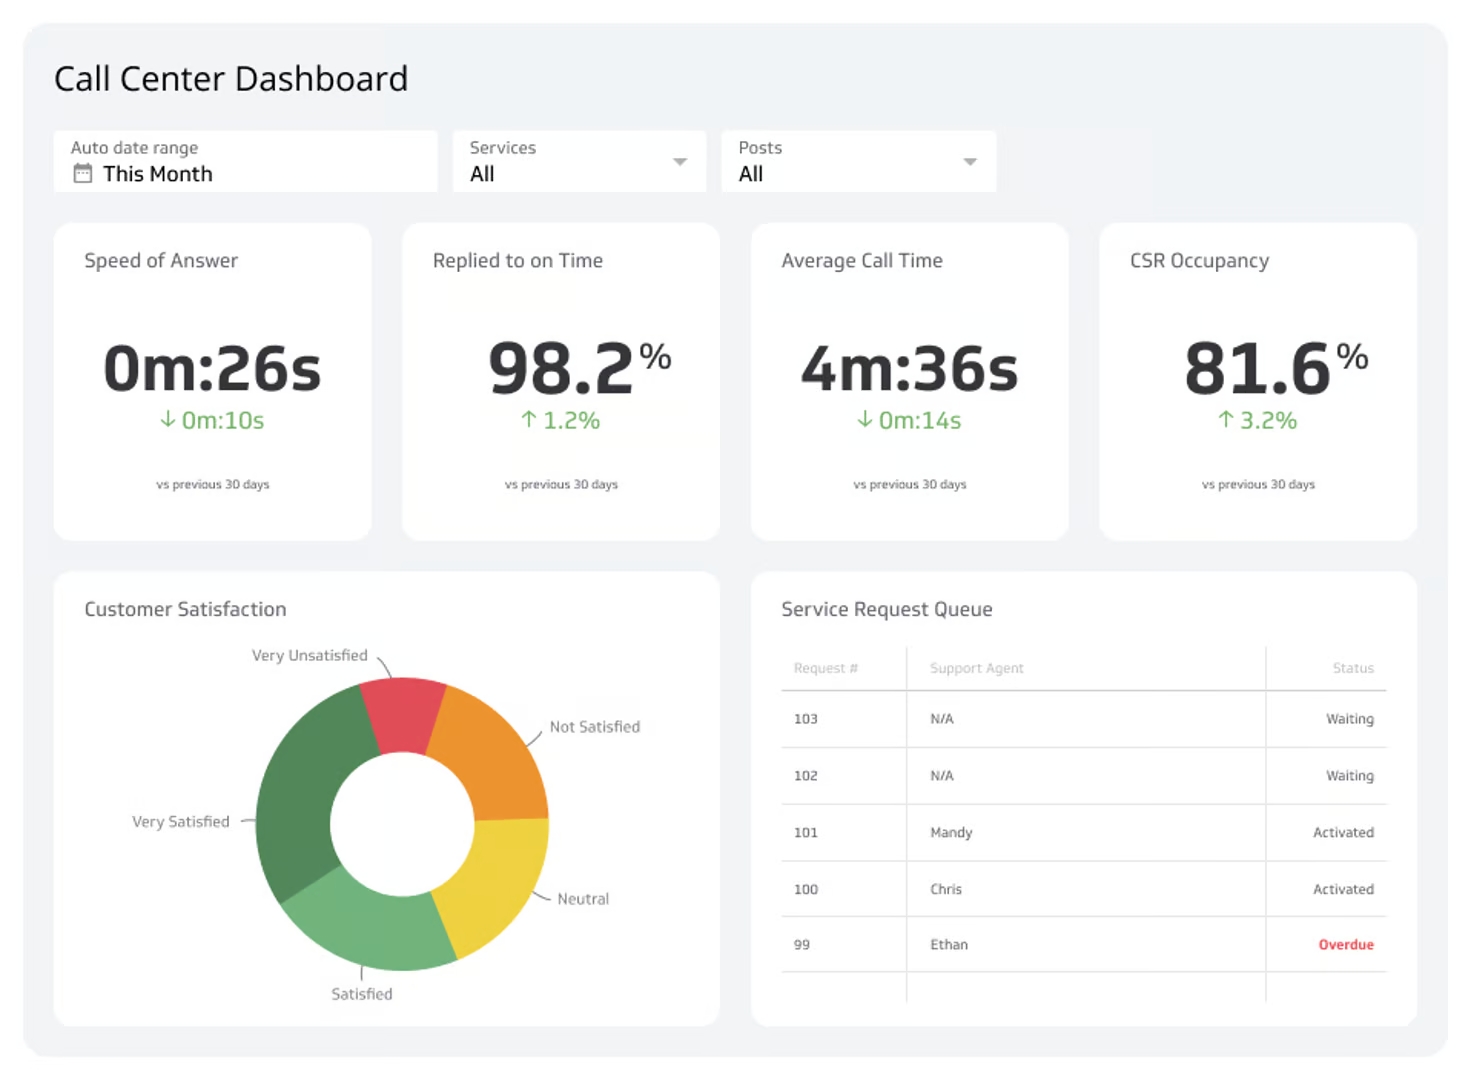
Call Center Dashboard
A call center dashboard increases the visibility of real time, business-critical metrics providing you with the information needed to respond to challenges before they become crises.
Financial Performance Dashboard
Optimize your business's financial health with a financial performance dashboard. This will enable you to monitor financial KPIs, track revenue growth, and assess fiscal stability.
View Financial Performance Dashboards
QuickBooks dashboard
Manage and monitor your accounting data with no hiccups with the QuickBooks dashboard. It consolidates key financial metrics in one place so you can oversee income, expenses, and accounts payable efficiently.
Monthly sales dashboard
Empower your sales team with the monthly sales dashboard, designed to keep track of sales performance and KPIs effectively. This tool simplifies goal tracking for a data-driven approach to achieving sales targets.
A/B Testing Dashboard
Keep customers satisfied with an A/B test dashboard that helps you understand which changes enhance user experience and which might hinder it. Maximize your product’s effectiveness through informed decision-making.
Customer Support Dashboard
Guarantee effective customer service with a comprehensive tool that tracks response times, ticket volumes, and satisfaction scores. The customer support dashboard paves the way for quick resolutions and high customer satisfaction.
View Customer Support Dashboard
Customer Retention Dashboard
Know where you stand with a dashboard that tracks churn, retention rates, and overall customer engagement. Leverage these insights to enhance customer satisfaction and sustain business growth effectively.
View Customer Retention Dashboard
Developer & DevOps Dashboard
Streamline development processes with real-time insights into project progress, bug tracking, and release schedules. The develop dashboard makes sure your DevOps team stays on track and efficient, enhancing product delivery and system stability.
View Developer & DevOps Dashboards
User Experience dashboard
A UX dashboard allows you to monitor and analyze how users interact with your product. By tracking different user funnels, you can gain insights into completion rates for key events, such as purchases or subscriptions.
FAQs
How can I use dashboards to improve business performance?
You can use dashboards to track different KPIs and performance metrics that matter to your business. Whether you’re monitoring sales data, customer interactions, or marketing campaigns, dashboards provide insights that help you improve your strategies and boost overall business performance.
What should be on a dashboard?
The question above can be answered by asking the following key questions:
What is your goal when creating this dashboard? What insights do you want the team to understand when they look at it?
Who is using this dashboard?
What data will you be using? How much?
If you have an answer for all the above, then you already know what you’re putting in your dashboard.
How do I create a simple dashboard?
Don’t think too hard about the information that your dashboards should have. Choose simple designs; make sure your backgrounds and texts contrast each other. The less busy it looks, the easier it will be for the people viewing it to focus.
Next, follow what we like to call the “five second rule.” It simply means that your dashboard needs to be able to get the most important information at a glance (or five seconds).
Finally, stick to one color palette. If you wish for a certain category to be blue, then it should be labeled in blue from start to finish. We prefer only around three colors on our dashboards so stakeholders don’t get too overwhelmed.
How often should I update my dashboard to keep it useful?
To keep your dashboard effective, update it regularly to reflect the most current data available. This way, you make sure to always get the latest insights, keeping your business strategies aligned with real-time market and operational conditions.
With Klipfolio, you don't have to refresh your data or wait for scheduled updates manually. Instead, your dashboards are continuously updated with the latest data as it becomes available.
Why is data visualization through dashboards important?
Data visualization turns complicated data into simple graphs and charts that are easy to understand. It helps you make sense of large amounts of data for better decision-making for different parts of your business.