QuickBooks Dashboard
Your business's financial health at a glance.
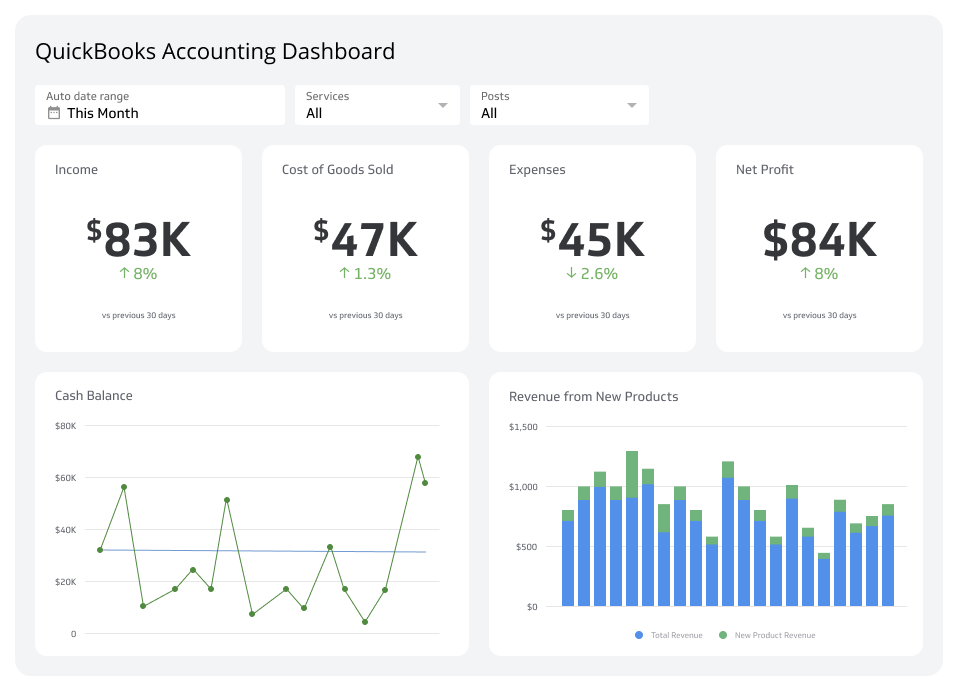
A QuickBooks dashboard gives you a real-time view of your business's financial health, pulling key metrics from QuickBooks into one place so you always know where you stand.
Forget waiting for month-end reports or digging through spreadsheets. When your revenue, expenses, and cash flow are visible at a glance, you can spot trends early, manage finances proactively, and make decisions with confidence, not guesswork.
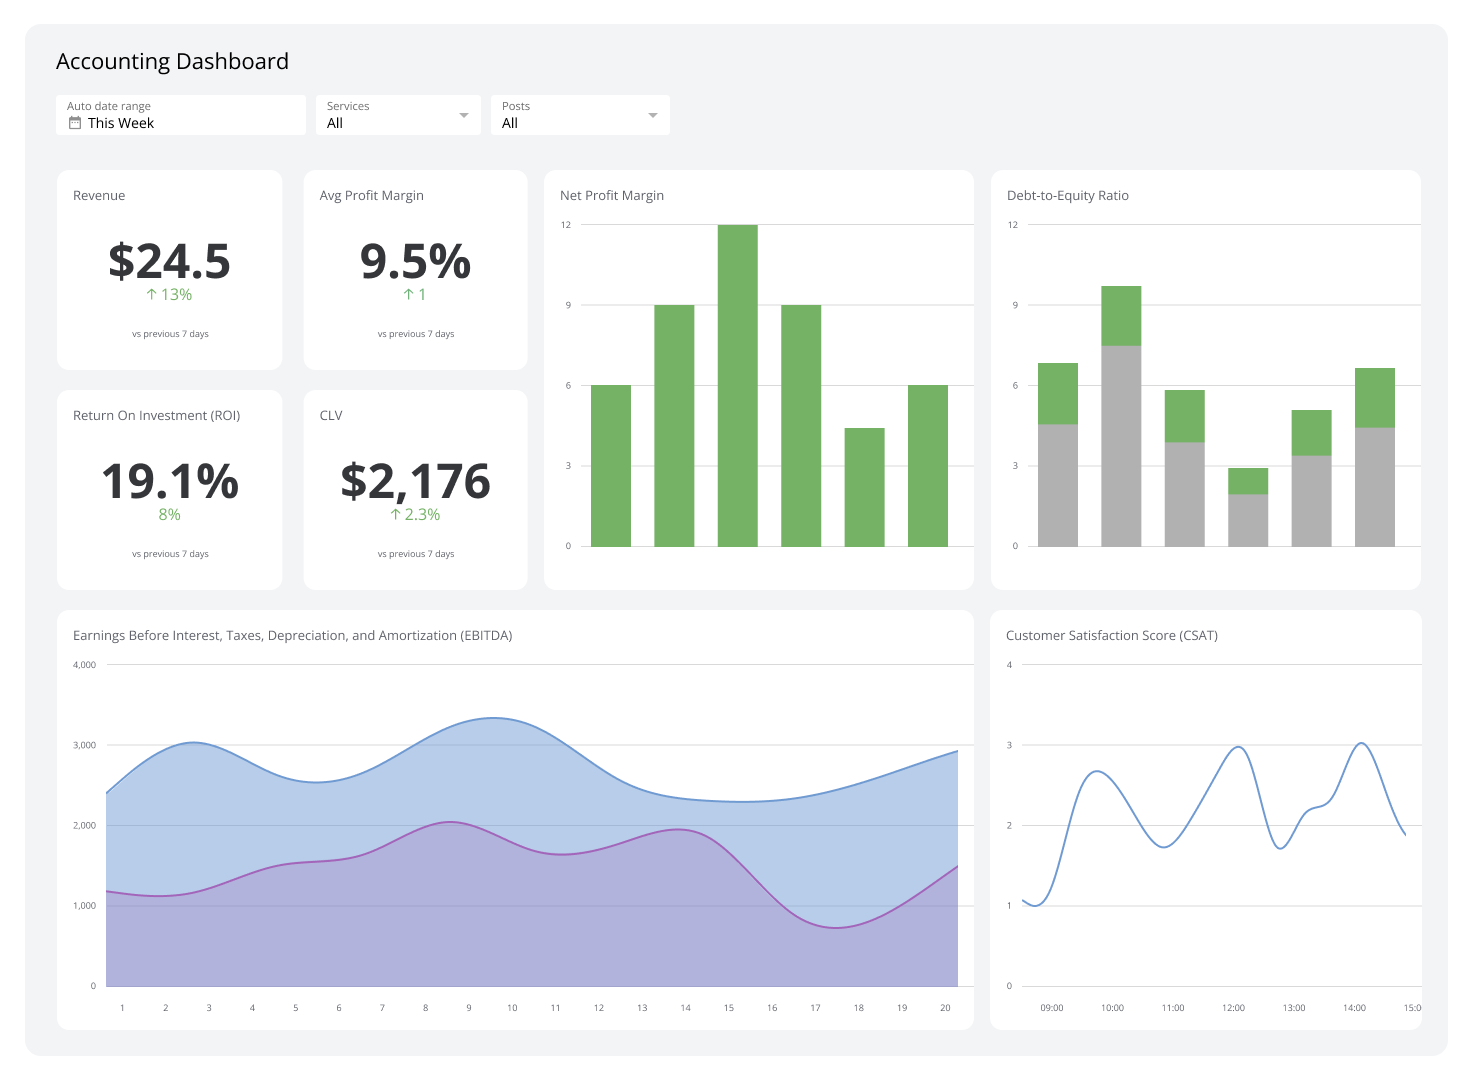
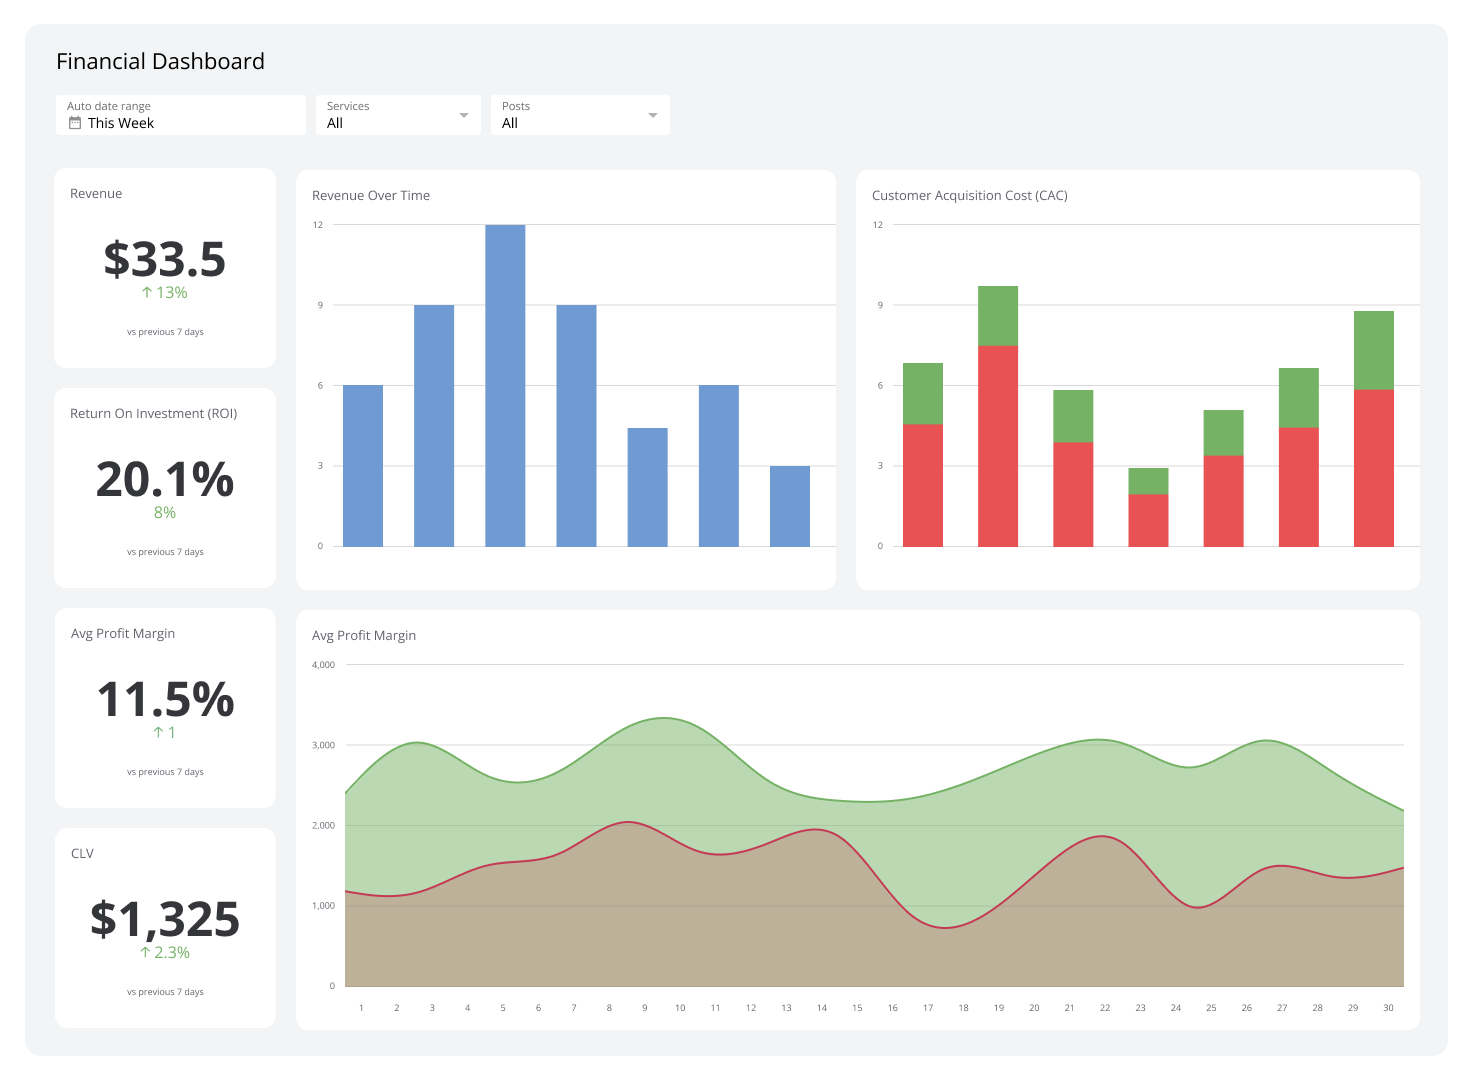
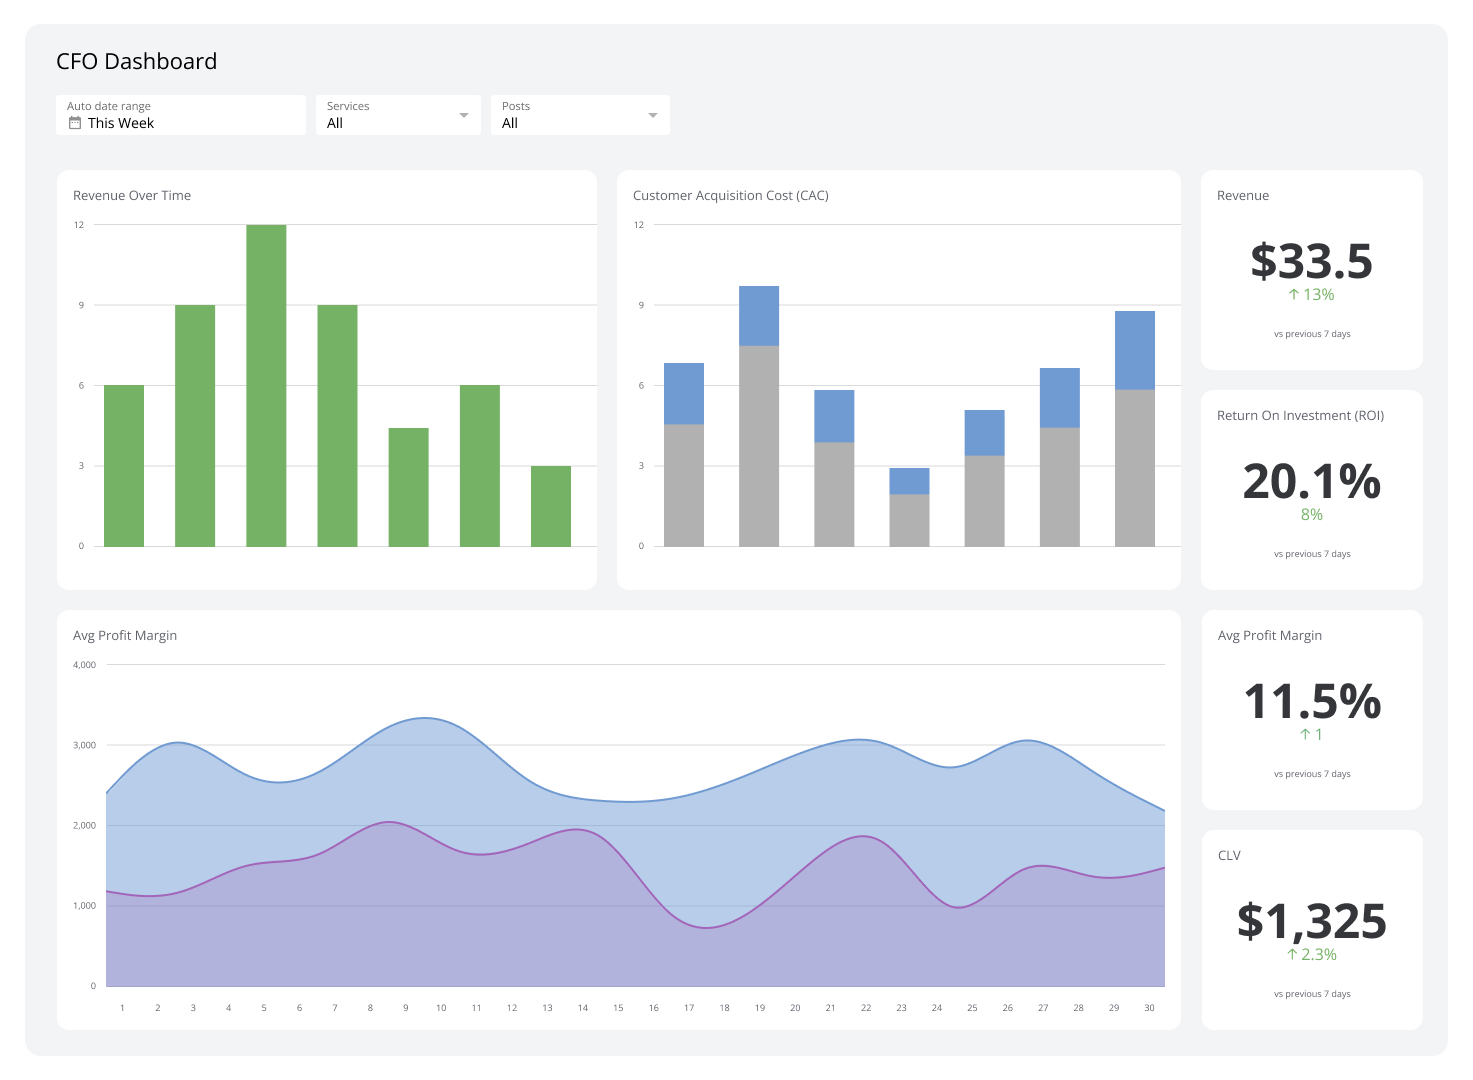
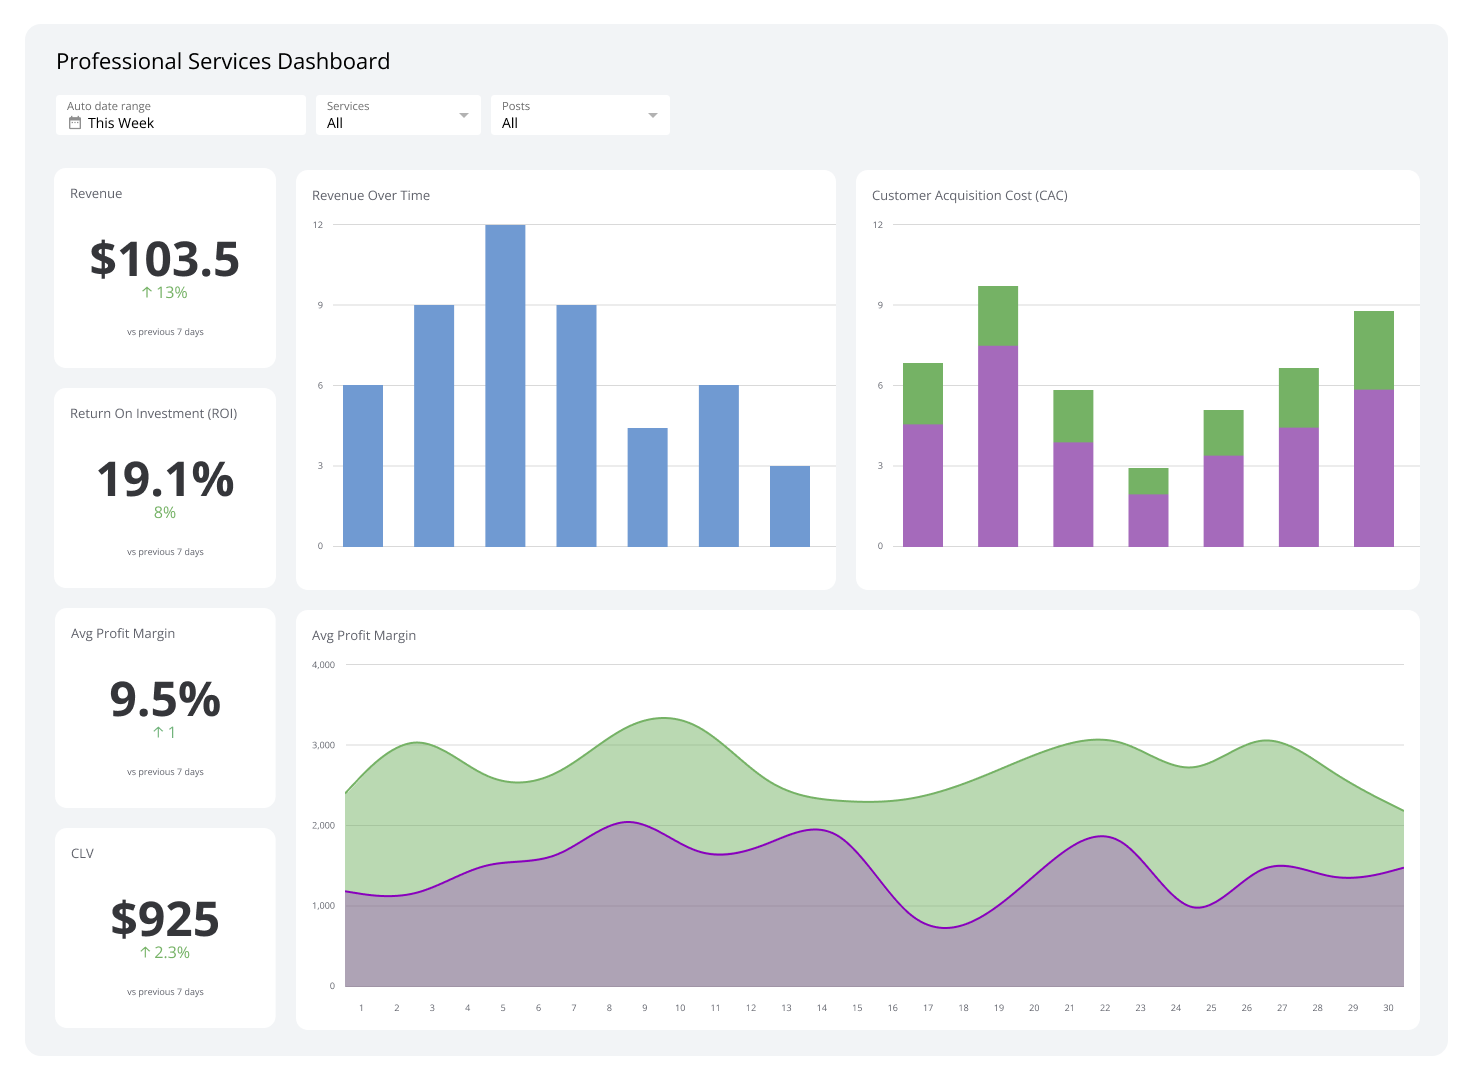
This dashboard example brings together the essential accounting metrics every business owner, bookkeeper, and finance manager needs to monitor.
What is a QuickBooks dashboard?
A QuickBooks dashboard is a live reporting view that connects directly to your QuickBooks data and displays your most important financial metrics and KPIs in one place. It updates automatically, so your team always works from current numbers rather than yesterday's export.
Key metrics for your QuickBooks dashboard
A strong QuickBooks dashboard goes beyond raw numbers. It tells the story of your financial performance so you can act on it. Here are the metrics worth tracking:
Income and expenses: See exactly what's coming in versus what's going out. Tracking this in real time helps you manage profitability and control spending before it becomes a problem.
Accounts Receivable and Accounts Payable: Monitor cash flow with precision. Know who owes you money and what you owe your vendors so you maintain a healthy cash balance.
Sales by product: Understand which products or services drive the most revenue. This helps you focus sales and marketing efforts on what works best.
Vendor expenses: Track where your money is going. Analysing spending by vendor can reveal opportunities to negotiate better terms or consolidate purchasing.
Top customers by income: Identify your most valuable customers. Knowing who they are lets you nurture those relationships and find more like them.
Why build a QuickBooks dashboard?
Manual reporting creates lag. By the time you compile a report, the numbers are already out of date, and by the time someone pastes them into a spreadsheet or explains the context to a colleague, the moment for action has often passed.
A connected dashboard eliminates that gap. Here's what you gain:
Faster decisions: Real-time data means you respond to changes as they happen, not weeks later.
Team alignment: Everyone, from the business owner to the bookkeeper, works from the same numbers.
Less manual work: Automated data retrieval replaces time-consuming exports and copy-paste reporting.
Confidence in the numbers: When your data comes from one consistent source, there's no debate about which version is correct.
Clearer trends: Visualizations make it easier to spot patterns in revenue, expenses, and cash flow over time.
What to include in a QuickBooks dashboard
The right metrics depend on your role and your business. Here's a practical starting point:
| Metric | Why it matters |
|---|---|
| Total Revenue | Tracks top-line performance against targets |
| Net Income | Shows profitability after expenses |
| Accounts Receivable Aging | Flags overdue invoices before they become cash flow problems |
| Accounts Payable | Keeps vendor obligations visible and manageable |
| Gross Profit Margin | Measures how efficiently you deliver products or services |
| Expense breakdown by category | Surfaces where costs are growing |
| Sales by product or service | Identifies your highest-revenue offerings |
| Cash on hand | Gives a snapshot of liquidity at any moment |
Start with the metrics that directly inform your biggest financial decisions, then expand from there.
How to build a QuickBooks dashboard with Klips
Klipfolio Klips connects directly to QuickBooks so you can build a dynamic dashboard without manual data entry. The goal is a single source of truth for your business's financial performance, available to everyone who needs it, without anyone having to pull a report or chase a number.
Connect your QuickBooks account using Klips' native QuickBooks connector.
Choose your metrics based on the table above or your own reporting priorities.
Select your visualizations: line charts for trends, bar charts for comparisons, and scorecards for key totals.
Arrange your layout to match how your team reads financial data.
Set your refresh rate so the dashboard updates automatically throughout the day.
Share with your team using Klips' distribution options: TV mode, scheduled email, public links, or embedded views.
Once it's live, your team stops waiting for updates and starts making calls based on what's actually happening right now.
Create custom dashboards for you and your team.
Get started with KlipsWho benefits from a QuickBooks dashboard?
A QuickBooks dashboard isn't just for accountants. It serves anyone who needs financial visibility to do their job well.
Business owners use it to monitor overall health and profitability without waiting for a report.
Finance managers use it to track cash flow, payables, and receivables in real time.
Operations leads use it to understand how spending aligns with budgets.
Bookkeepers use it to flag anomalies and keep records current.
When everyone works from the same dashboard, financial conversations become faster and more productive. You spend less time reconciling numbers and more time acting on them.