Accounting Dashboard
Your company's financial performance in real-time.
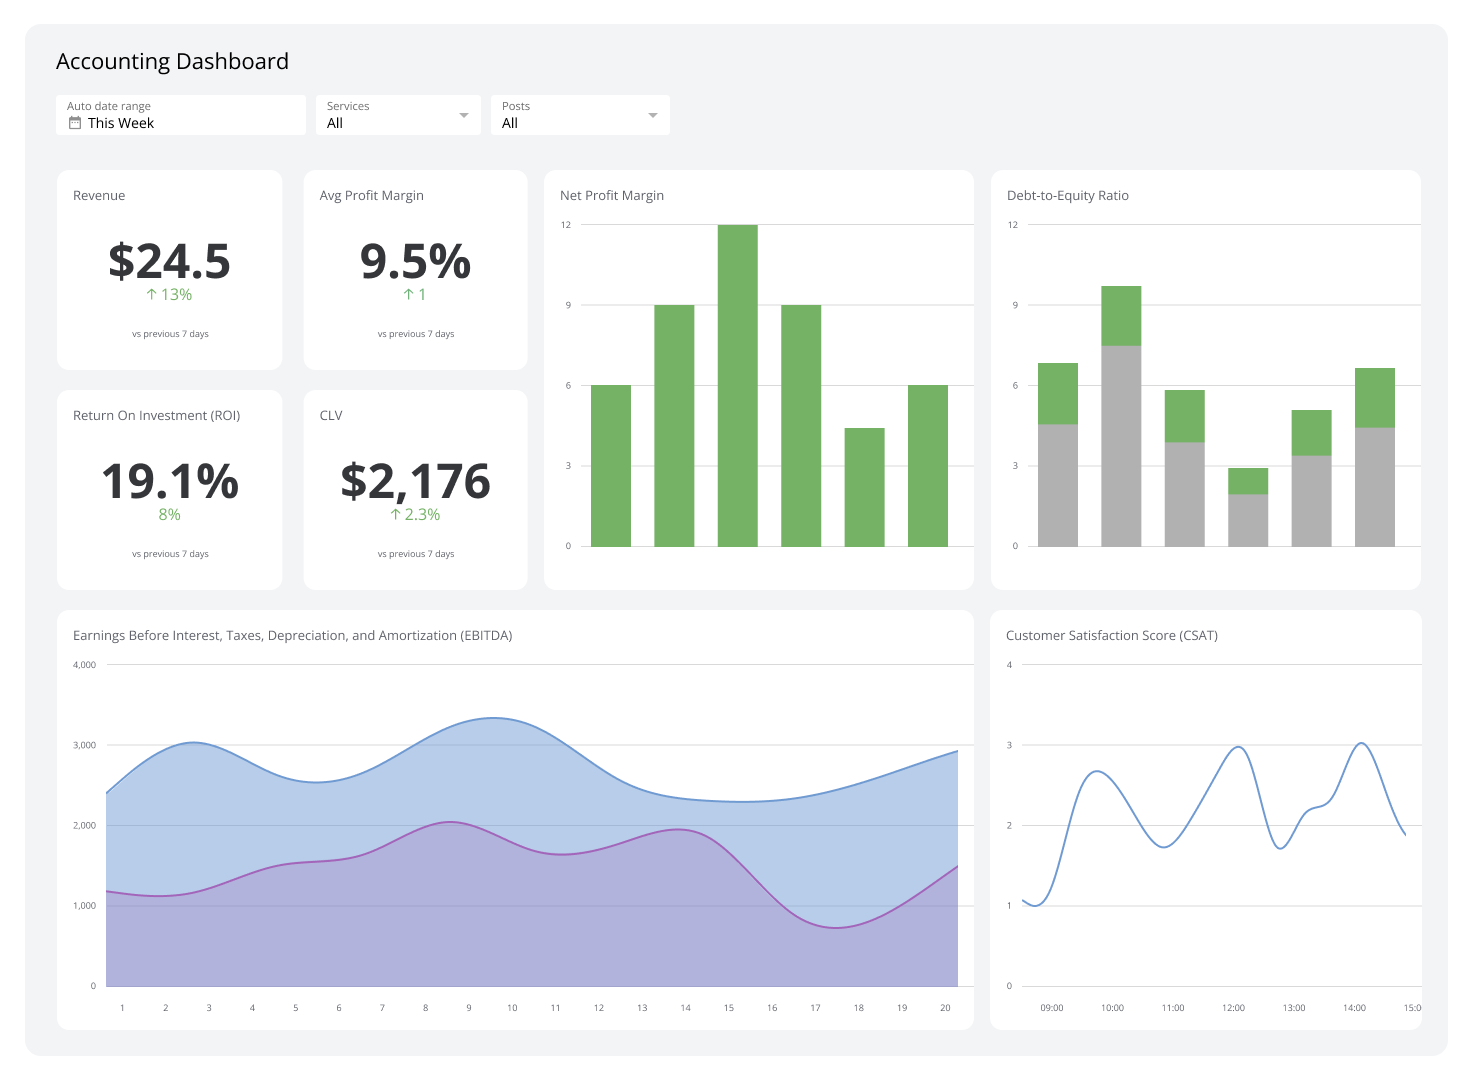
What is an accounting dashboard?
An accounting dashboard is a real-time display of your most important financial metrics, all in one place.
Most financial surprises aren't really surprises. The signs were there, buried in a report nobody saw until month-end. An accounting dashboard changes that. It pulls your critical financial data together so you can see exactly where things stand right now, not three weeks from now when it's too late to act.
This dashboard example helps business owners, bookkeepers, and accountants stay informed at all times. By centralizing data on invoices, cash flow, and profitability, you replace guesswork with a clear, current picture of your business.
Key metrics for your accounting dashboard
A strong accounting dashboard gives you at-a-glance answers to your most pressing financial questions. The metrics below form the foundation of any reliable setup.
Here are the essential metrics to include:
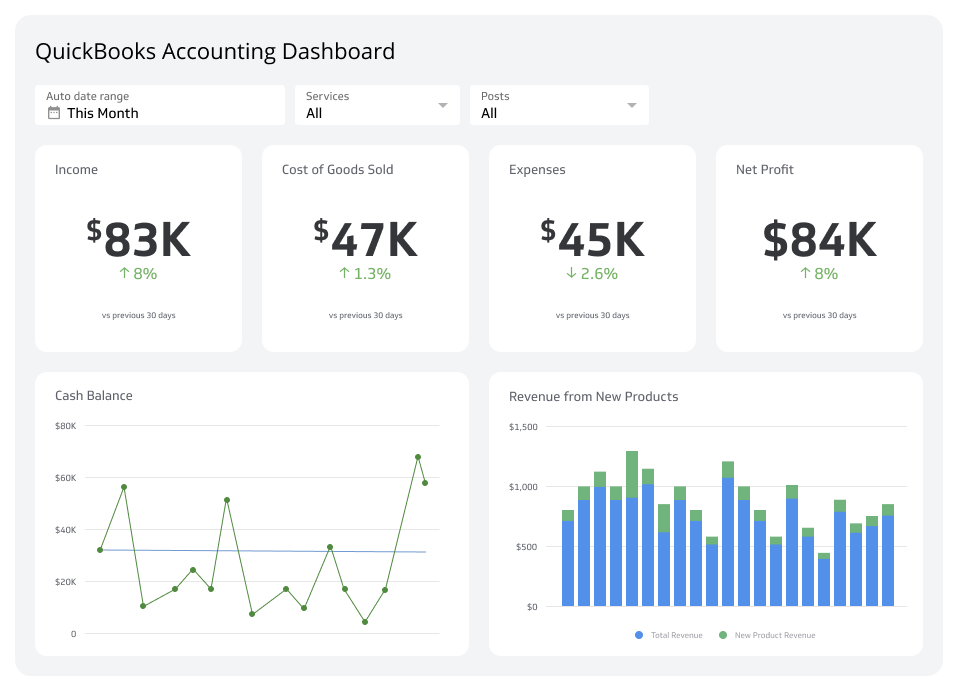
Income and Expenses: Track profitability over time to understand your financial trajectory. Monitoring this closely lets you manage your budget and catch small issues before they become costly ones.
Accounts Receivable and Accounts Payable: Get a clear view of your cash flow. See how much money is coming in versus going out so you always have the cash on hand to pay bills and invest in growth.
Recent Payments: Monitor payments as they happen. This gives you an immediate sense of daily cash flow and helps you spot unexpected shifts in payment patterns before they compound.
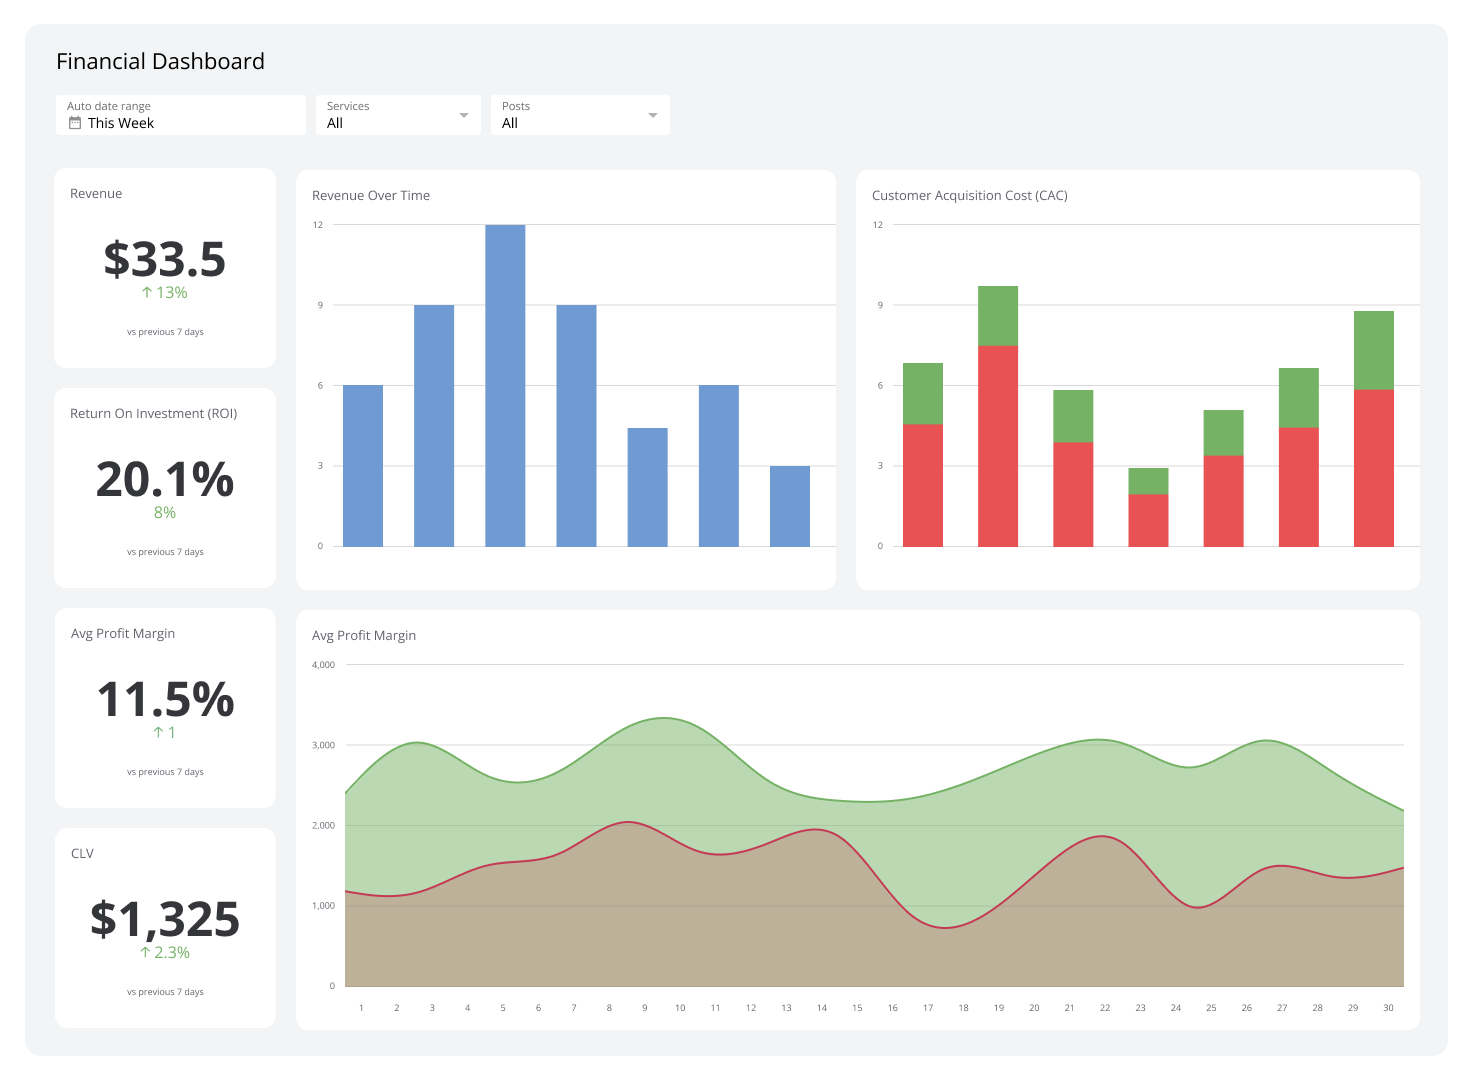
Profit and Loss: Summarize revenues, costs, and expenses for a specific period. This is the clearest measure of whether your business is generating profit, and by how much.
Why use a real-time accounting dashboard?
Spreadsheets and static reports have a fundamental problem: they show you where you were, not where you are. By the time a monthly report lands in your inbox, the numbers are already out of date, and the window to act has often closed.
A real-time accounting dashboard connects directly to your data sources and refreshes automatically. You see current figures, which means faster decisions, fewer surprises, and less time spent waiting for someone to pull a number.
Here are the main benefits:
Faster decisions: Current data lets you act on trends as they emerge, not weeks after the fact.
Fewer errors: Automated data pulls replace manual copy-paste workflows. You stop second-guessing whether the number in the spreadsheet is the right one.
Team alignment: When everyone looks at the same dashboard, finance conversations become more focused. There's one version of the truth, not three.
Proactive cash management: Seeing Accounts Receivable and Accounts Payable side by side helps you spot cash flow gaps before they become urgent.
The payoff isn't just better-looking reports. It's the confidence to make a call on Monday morning without waiting for your bookkeeper to send a file.
What to look for in accounting dashboard software
Not all dashboard tools are built the same way. When choosing software for your accounting dashboard, look for these capabilities:
Direct data connections: Your dashboard should pull from your accounting software (such as QuickBooks or Xero), your bank feeds, and any other relevant sources automatically. If you're pasting numbers in manually, you've already lost the benefit.
Flexible visualizations: Charts, tables, and summary tiles should be easy to configure so you can display each metric in the format that makes the most sense for your business.
Scheduled refresh rates: Financial data changes throughout the day. Look for refresh rates that match the pace of your business, from real-time to daily.
Sharing and distribution: Finance dashboards often need to reach multiple stakeholders. Look for role-based access, PDF exports, and scheduled email delivery so the right people always have the right numbers.
Custom formulas: Your business may have unique ways of calculating margins or categorizing expenses. Formula support lets you model data your way, not the software's way.
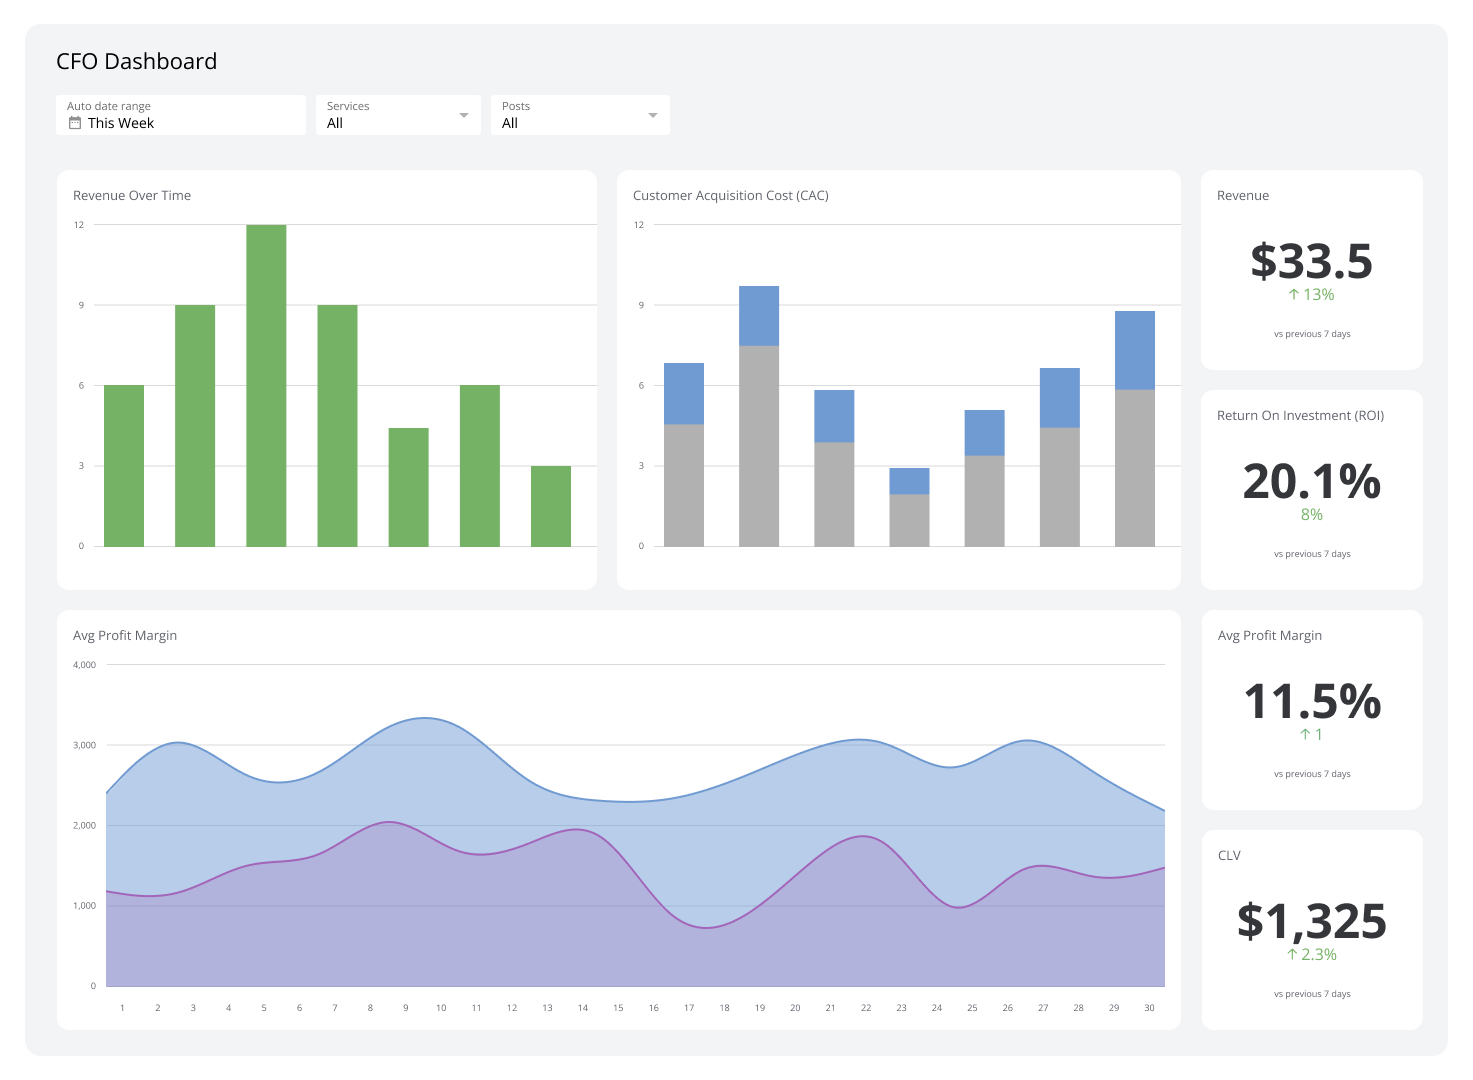
An executive dashboard often draws on these same accounting metrics to give leadership a high-level view of company performance. Connecting the two keeps finance and strategy aligned without anyone having to manually bridge the gap.
Create custom dashboards for you and your team.
Get started with KlipsBuild your accounting dashboard with Klipfolio Klips
Klipfolio Klips is dashboard software built for growing companies that need reliable, real-time financial visibility. With 130+ data connectors, Excel-like formulas, and flexible distribution options, you can build an accounting dashboard that fits your workflow exactly.
Connect to your accounting tools, model your data the way your business works, and share results with your team automatically. No more waiting for reports. No more manual spreadsheet updates. No more wondering whether the number you're looking at is current.
Try Klips free and build your first accounting dashboard today.