Business Metrics: Definition & Examples

A business metric is a quantifiable measure used to track and assess the status or performance of a specific business function. Metrics are used to measure progress toward short and long-term goals and objectives.
Every area of the business has specific metrics to monitor:
- Finance teams track revenue metrics like MRR or customer acquisition cost
- Executive teams track big-picture business metrics like customer lifetime value or annual recurring revenue
- Marketing teams track campaign performance and program statistics with engagement rates and marketing-qualified leads
- Sales team track won opportunities and expansion revenue
Metrics allow businesses to steer their ship in the right direction with data-backed decisions. Moreover, as competition intensifies, staying on top of the right metrics can shed light on opportunities and weaknesses alike. It can facilitate the growth of companies by maximizing the right strategies.
Business Metric vs. Key Performance Indicator: What's The Difference?
What's the difference between a metric, a measure, and a KPI? Metrics are the units of measurement used in KPIs. KPIs, or key performance indicators, are metrics with a target and timeline baked into them. KPIs are the action; metrics are the measurement.
Business metrics are most effective when they are compared against established benchmarks or business objectives. Benchmarks can be internal, external, performance, or industry-established. This provides context for the metric.
Context is where the biggest difference lies between metrics and key performance indicators. Context inspires action and impact. For example, $20M in Q4 sounds like an impressive figure, but if you're a Fortune 500 company, that figure might have you worrying.
Here’s the difference:
- Business metrics are used to track performance across all areas of the business
- KPIs track your progress toward a specific goal with defined targets and deadlines
In action, this would look like:
A metric measures that web traffic increased 15% this quarter. A KPI measures whether web traffic is on track to increase 20% by Q4 to support your goal of generating 500 qualified leads.
Here are a few additional resources to answer any KPI questions, like what is a KPI? and why are KPIs important?
What Are Business Metrics?
Business metrics are standardized quantitative measurements used to track, assess, and analyze specific data, performance, or conditions in various fields and industries. They provide critical insights and help stakeholders make informed decisions based on tangible evidence.
The business metrics you track will depend on your company and your areas of focus. Check out the performance metrics for industry verticals and departments below to get started.
- Finance Metrics
- Marketing Metrics
- Sales Metrics
- SaaS Metrics
- Social Media Metrics
- SEO Metrics
- Email Marketing Metrics
- HR Metrics
- Bonus Business Metrics
For more inspiration and deep dives into specific metrics, check out MetricHQ.
Finance Metrics
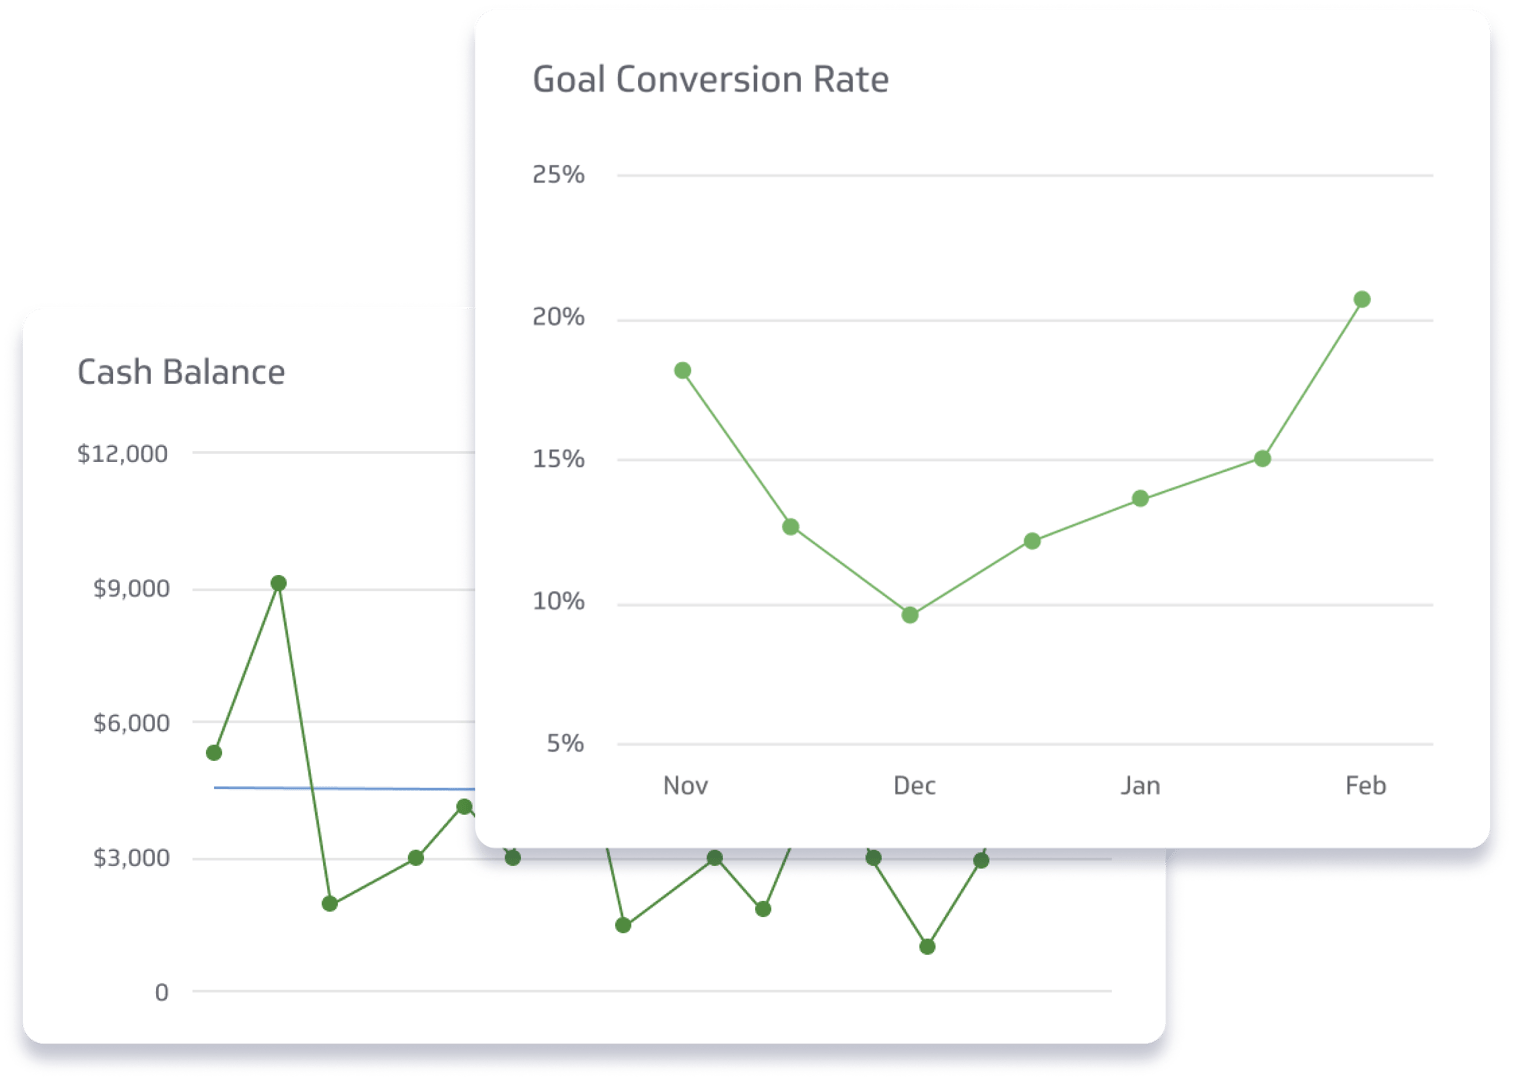
Companies rely on revenue to stay in business, and managing and tracking that revenue is a core function of your finance team. Financial metrics carry weight outside your team, too. Potential investors, stakeholders, and customers will be curious about your financial data.
Fiscal health is a key aspect of any business. Here are the financial metrics to monitor and track the health of your business and your bank account:
Current Ratio
The Current Ratio is a liquidity metric used to determine a company's ability to cover its short-term obligations with its short-term assets. Monitoring the Current Ratio provides insights into your company's short-term financial health.
Gross Margin
Gross margin represents the percentage of total revenue that exceeds the cost of goods sold (COGS). This metric is an indicator of production efficiency and profitability.
Net Burn
Net burn rate measures the amount of money a company is losing per month, especially pertinent to startups. For businesses, particularly those not yet profitable, understanding net burn is crucial. It indicates how long a company can operate before it needs additional funding or becomes profitable.
Net Profit
Net profit is also often referred to as the bottom line. It represents the amount of revenue remaining after all operating expenses, taxes, and additional costs have been deducted from gross revenue.
Revenue
Revenue, also known as sales, refers to the total income generated from goods sold or services provided during a specific time frame. Many businesses consider this as the starting point of assessing business performance.
Marketing Metrics
Marketing metrics are used by companies to monitor and display the overall performance of social media channels and marketing campaigns like email or advertising.
Marketing is a data-driven practice with any number of channels and platforms. Depending on the channels your team uses and your goals and objectives with each, the metrics you monitor will vary.
Here are a few examples of KPIs and key marketing metrics:
Average Time on Page
This metric refers to the average duration a visitor spends on a particular webpage. A longer average time indicates that visitors find the content compelling, leading to better engagement. Average Time on Page can be used to fine-tune content strategy.
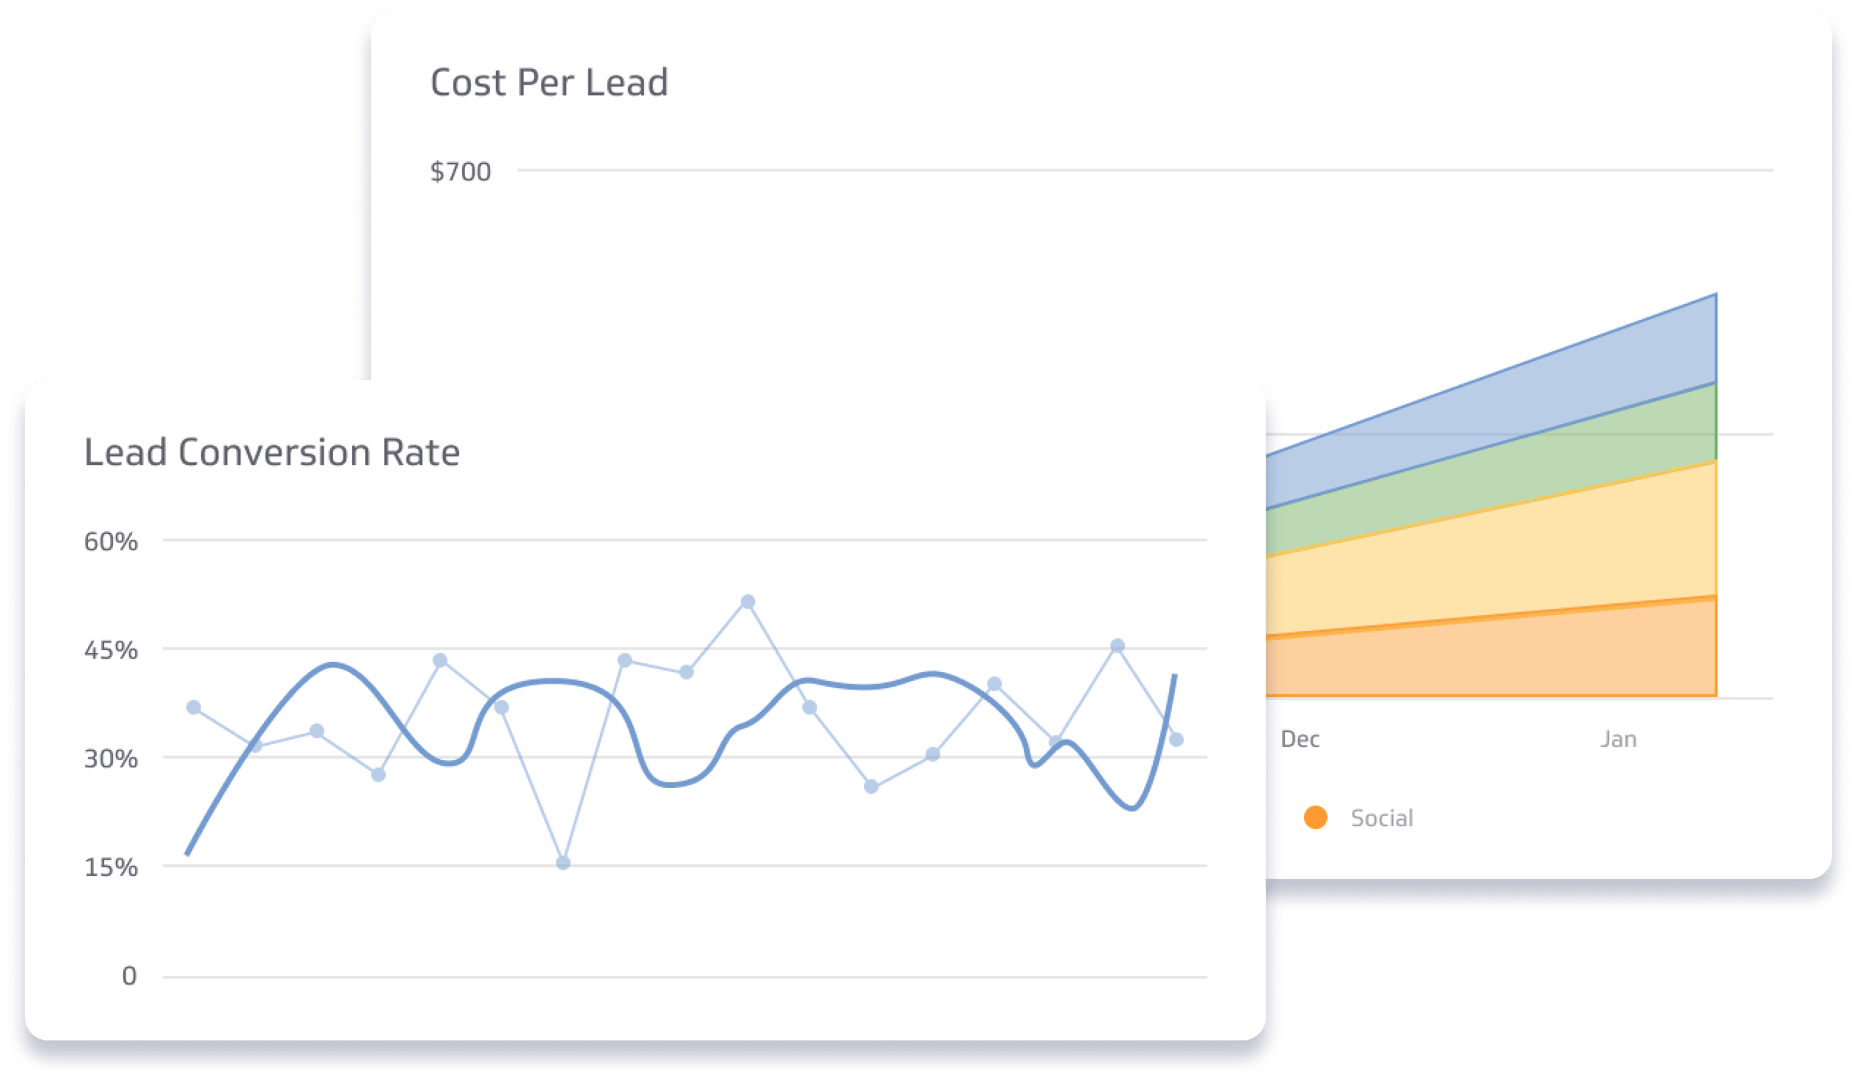
Lead Conversion Rate
Lead Conversion Rate measures the percentage of leads that turn into customers. A high conversion rate indicates a strong alignment between marketing efforts and customer needs, while a low rate may suggest room for improvement in messaging or targeting.
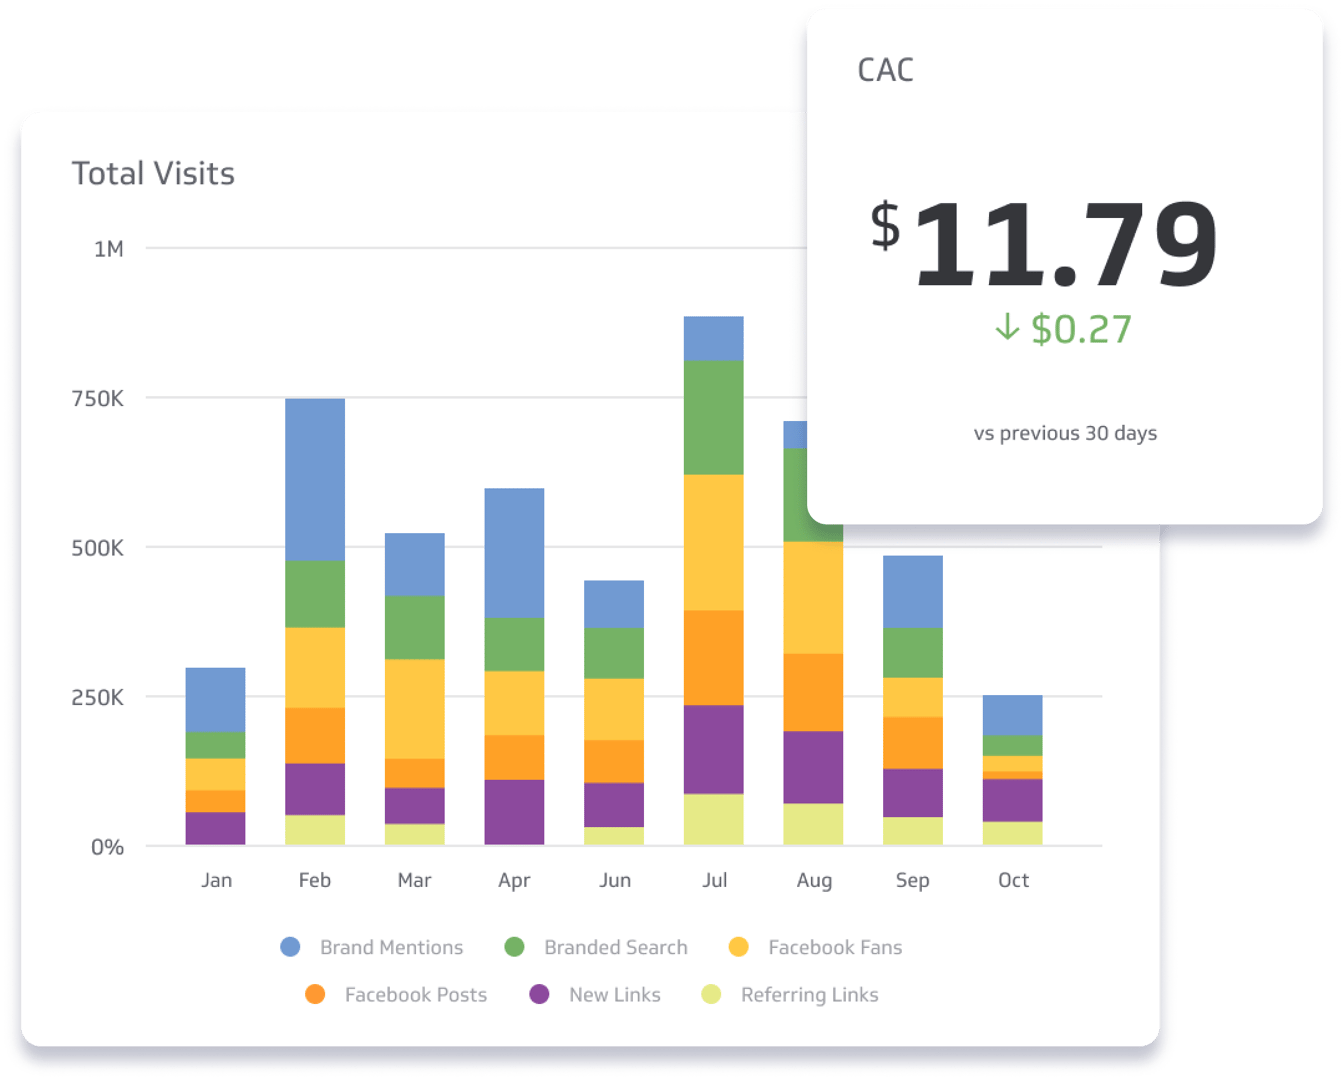
Customer Acquisition Cost
CAC represents the total cost to acquire a new customer, considering all marketing and sales expenses. If it exceeds the value a customer brings (Customer Lifetime Value), then your profitability is at risk. It's essential to balance marketing investments with the revenue potential of acquired customers.
Marketing Qualified Leads
These are individuals who've engaged with a company's marketing efforts and are more likely to become customers compared to other leads. Identifying these qualified leads helps you prioritize them, ensuring sales efforts are directed toward the most promising prospects.
Return on Marketing Investment
With this metric, you calculate the return on marketing activities by dividing the net profit from these activities by the associated costs. A positive return on marketing investment indicates a successful strategy. Conversely, a low or negative return may suggest a need for re-evaluation or adjustment.
Sales Metrics
Sales teams, like marketing, rely on data to make decisions and develop their sales strategy. Sales teams need to monitor their pipeline, track their sales-qualified leads (SQLs), and watch MRR grow and expand.
Sales is a competitive business environment, so being in control of your data is key. Tracking the right metrics and KPIs will put you on the path to success.
Here are the sales metrics measured by world-class sales teams:
Leads
Leads are your potential customers. Thus, a steady influx of leads indicates effective marketing efforts. Meanwhile, a drop might signal a need to revisit marketing strategies or channels.
Lead to Win Rate
This rate measures the percentage of leads that result in a successful sale. Understanding it helps sales teams refine their approach and prioritize efforts. A high lead-to-win rate showcases efficient sales processes since more leads become paying customers.
Won Opportunities
This refers to the number of sales leads or prospects that convert into paying customers. Tracking won opportunities gives insight into sales team performance and strategy effectiveness.
MRR Growth Rate
This measures the rate by which Monthly Recurring Revenue (MRR) increases or decreases over a given period. Tracking the MRR Growth Rate will allow you to gauge their success in acquiring new customers and retaining existing ones.
Revenue
Tracking revenue as a sales metric directly reflects the team's effectiveness in closing deals and capturing market share. An increase in sales revenue often signifies successful sales strategies and a strong product-market fit. However, stagnant or declining revenue can prompt you to review your sales tactics and market positioning.
SaaS Metrics
SaaS (software as a service) companies pay close attention to the metrics that monitor customer retention, recurring revenue, and user engagement in their product.
Here are five SaaS metrics that cross-functional teams track:
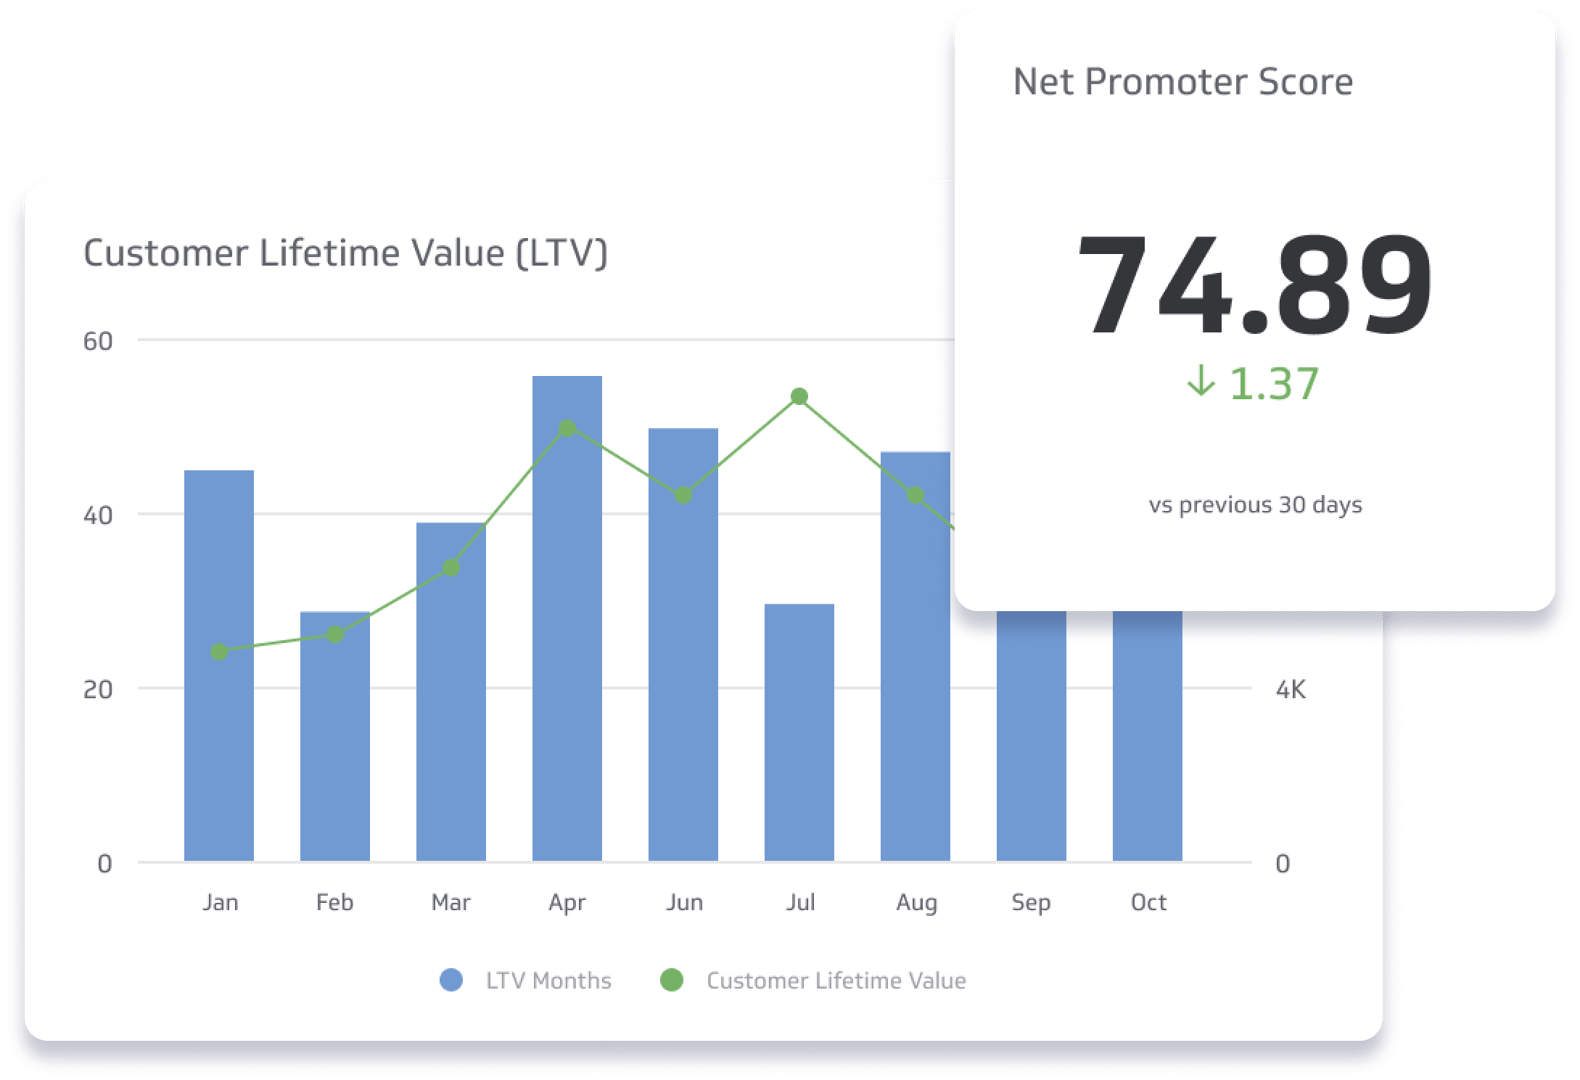
Customer Lifetime Value (LTV)
LTV calculates the total projected revenue a company expects from a customer throughout their relationship. A higher LTV indicates strong customer loyalty and informs businesses about potential profitability and how much they can invest in customer acquisition.
Churn
Churn represents the percentage of customers that stop using a SaaS product within a specific timeframe. A lower churn rate signifies customer satisfaction and product stickiness. Meanwhile, a high rate may signal areas in need of improvement to retain customers.
Monthly Recurring Revenue (MRR)
MRR tallies the total predictable revenue a SaaS business generates each month from subscriptions. Tracking MRR helps you understand your business’ growth rate and financial health, making it easier to make data-informed decisions.
Customer Retention Rate
This metric shows the percentage of customers a company retains over a specific period. A higher retention rate indicates an equally high product value and user satisfaction, while a decline might suggest issues that need addressing to keep clients engaged.
Daily Active Users or Monthly Active Users
These metrics gauge the number of individuals actively using a SaaS product daily or monthly. A rising DAU or MAU suggests strong user engagement and product-market fit, making it a key indicator of a SaaS product's success and vitality.
Social Media Metrics
Social media metrics track performance and engagement on platforms like Twitter, Instagram, TikTok, or Facebook. Social media marketing is a fundamental component of any marketing strategy. Awareness and engagement campaigns are used to drive traffic to your website, generate leads, and at its core: get people talking about your brand.
With so many platforms to monitor, however, it can be challenging to measure performance across all of them. Here are five key metrics you can track across all channels:
Account Reach
Account reach signifies the number of unique users who've seen any content from your social media profile over a specific period. It provides insight into the spread of your brand's message and helps determine your potential audience size.
Followers
This represents the total number of individuals who've chosen to receive updates from your social profile. An increasing follower count is indicative of growing brand loyalty and interest, making it a benchmark for brand popularity and resonance.
Comments
Comments on social media posts are direct feedback from your audience, signaling deeper engagement than mere likes or shares. Tracking comments helps businesses understand audience sentiments, gather feedback, and engage in direct conversations with their community.
Post Engagement Rate
This metric measures the percentage of your followers or viewers who interact with your content, either through likes, shares, comments, or clicks. A high engagement rate often indicates high audience relevancy and campaign effectiveness, which can help guide your content strategy moving forward.
Video Views
In an era where video content is a crowd-favorite, tracking video views helps businesses gauge content effectiveness, audience preferences, and potential areas for content enhancement.
SEO Metrics
Search Engine Optimization (SEO) plays a crucial role in boosting a website's visibility and driving organic traffic. Ultimately, monitoring these metrics fosters business growth.
Here are five key SEO metrics you should track for your website:
Pageviews
Pageviews represent the total number of times a specific webpage has been viewed by visitors. This metric helps you gauge the popularity of individual pages, which is essential to understand the effectiveness of your content, helping you spot areas that may need optimization.
SEO Click-Through Rate
This is the percentage of users who click on a link to your site after it appears in search engine results. A high rate usually indicates that your meta titles and descriptions are compelling and relevant to search queries, making it a key indicator of your SEO effectiveness.
Domain Authority
Domain Authority (DA) is a score developed by Moz that predicts how well a website will rank on search engine result pages (SERPs). A higher DA suggests greater chances of ranking higher in search engines, making it an important metric for gauging the overall strength and reputation of your website.
Organic Traffic
Organic traffic counts the number of visitors that come to your site through unpaid search results. Tracking this metric helps businesses understand the effectiveness of their SEO efforts, as increasing organic traffic typically indicates successful SEO strategies and high-quality content.
SEO Keyword Ranking
This metric shows where your website ranks on search engines for specific keywords. Regularly monitoring keyword rankings lets businesses understand their competitive standing in the market and refine their SEO strategies for better search visibility.
Email Marketing Metrics
Email marketing continues to be a valuable tool for building customer relationships, driving sales, and nurturing leads. Monitoring specific metrics provides concrete data on campaign performance, which can be used to refine marketing strategies. Here are five essential email marketing metrics to keep track of:
Click-to-Open Rate (CTOR)
CTOR represents the percentage of recipients who clicked a link within an email out of the total who opened it. It's a direct indicator of the email's content effectiveness, revealing if the message successfully engaged those who viewed it.
Email Marketing Engagement Score
This metric consolidates various engagement indicators, such as opens, clicks, and shares, to provide a comprehensive view of an email's performance. A higher score often signals content relevance and effective targeting.
Email Website Traffic Metrics
Email website traffic metrics track the number of visitors arriving at your website directly from your email campaigns. It helps determine the efficacy of email marketing in driving web traffic and potential conversions.
Email Bounce Rate
Just like website bounce rates, email bounce rates measure the percentage of sent emails that could not be delivered to the recipient's inbox. A high rate could signal issues with the email list quality or possible server problems.
Email Click Through Rate (CTR)
CTR calculates the percentage of recipients who clicked on at least one link in an email. It offers insights into the email's effectiveness in prompting user action.
HR Metrics
HR metrics measure the efficiency and effectiveness of HR practices, processes, and activities in a quantifiable manner. These metrics are crucial to measuring employee productivity, talent management, and the overall health of an organization's human capital.
Here are five key metrics to consider:
Applications Received per Vacancy
This metric quantifies the number of applications received for each job opening. It helps HR teams gauge the attractiveness of a company position and the effectiveness of their job marketing.
Cost per Hire
Cost per Hire shows you the total expenses involved in hiring a new employee, including advertising, interviewing, screening, and onboarding. You need to know this for budgeting and evaluating the efficiency of the recruitment process.
Job Offer Acceptance Rate
This represents the percentage of candidates who accepted a job offer. A lower rate might indicate uncompetitive compensation or that the hiring process is lengthy and complicated.
Open Job Requisitions
With this, you track the number of current open job positions within the company. Monitoring this can help assess the company's growth rate and talent acquisition needs.
Recruiter to Open Requisitions Ratio
This metric evaluates the workload of recruiters by comparing the number of open job requisitions to the number of recruiting staff. A high ratio could indicate the need for additional recruiting resources or improved processes.
Bonus Business Metrics
Every business has data that is critical to monitor to capture your full business funnel. MetricHQ is a full library of metrics that you can explore for inspiration and start tracking in PowerMetrics.
How To Choose the Right Metrics For Your Projects
While the array of potential metrics and KPIs to track can be overwhelming, choosing the right ones can be a game-changer for businesses. Let's delve into how you can fine-tune your approach:
Align Metrics with Business Goals
Every metric you track should have a direct correlation with your business's broader goals. Whether it's increasing revenue, expanding into new markets, or enhancing customer satisfaction, your metrics should offer insights into your progress toward these objectives. If you find a metric doesn’t serve a strategic purpose, it's time to reconsider its relevance.
It's not just about numbers but what those numbers represent. Having clarity on why you're tracking a metric helps in prioritizing resources and efforts.
Prioritize Actionable Metrics
While it might be interesting to know that your website received visitors from 50 different countries last month, it's not necessarily actionable. Focus on metrics that can directly influence decision-making processes and subsequent actions. For instance, a high cart abandonment rate on an e-commerce platform would require immediate attention.
Data without action is a missed opportunity. When reviewing metrics, always think about the next steps. How does this information shape strategy or refine tactics? This way, you can ensure your business is more agile and responsive to changing conditions.
Embrace Tools
Modern businesses have a myriad of tools at their disposal to track metrics. From Google Analytics to CRM systems, leverage technology to automate and simplify metric tracking, ensuring accuracy and timeliness.
Among these tools, Klipfolio Klips stands out as a powerful dashboard and reporting platform. It allows businesses to integrate multiple data sources seamlessly, visualizing key metrics in real time.
Klipfolio's customizable dashboards ensure that teams have immediate access to their most pertinent data, aiding in quick decision-making processes. Incorporating software dashboards like Klipfolio Klips into your metric tracking strategy lets you efficiently consolidate, visualize, and interpret data, streamlining your business operations.
Be Consistent
It’s essential to measure metrics consistently. If you're tracking monthly sales figures, for instance, make sure you're capturing data for the same duration each month using the same methodology. This ensures that comparisons over time are valid.
Consistent data tracking cultivates trust in the figures presented. Irregularities or deviations in tracking can lead to misleading interpretations. Thus, standardizing your measurement approach is more than a best practice. It's a necessity.
Ensure Data Integrity
Your decisions are only as good as the data you base them on. Regularly clean and maintain your databases, ensure data sources are reliable, and cross-check figures where possible. This guarantees your metrics offer an accurate picture of business performance.
Data is the foundation of informed decisions. If compromised, it can cause misguided strategies. Keeping data accurate strengthens the foundation of your business.
Regularly Review and Adjust
Business landscapes are ever-evolving. The metrics you track today might not be relevant tomorrow. Regularly review your metrics to ensure they remain pertinent to your business objectives. If certain metrics no longer serve a purpose, don’t hesitate to pivot.
Remember, the only constant in business is change. Just as markets and strategies evolve, the metrics you prioritize should reflect those shifts. A periodic review ensures your metrics remain as dynamic as the business itself.
Monitor Your Performance With a Business Dashboard
Business performance metrics keep teams, executives, investors, and customers informed and aware of performance and growth. The easiest and most effective way to stay on top of your company’s performance is by having your key metrics on a business dashboard. Different departments need to keep an eye on different metrics, so what the right business dashboard is will vary from department to department and from company to company.
Check out our Starter Guide series for everything you need to build a business dashboard: