
Social media KPIs and metrics
Explore the top metrics and KPIs for modern social media marketing teams
Facebook Page Likes
Facebook Ads: Cost per Conversion
Social Media Metrics & KPIs
Facebook Ads Campaign Performance
Make sure your message is reaching the right audience by measuring your Facebook Ads campaign performance for the date range of your choice.
Facebook Ads: CPM and CPP
Track your Facebook Ads cost per impressions and cost per conversion to understand your ad performance and make smart, data-driven advertising decisions.
Facebook Ads Impressions and Reach
Understand the difference between impressions and reach — and what each one tells you about your Facebook Ads performance.
Facebook Ads Today's Summary
Drill down into today's campaign metrics and monitor your Facebook Ads objectives.
Facebook Page Demographics
Understand the makeup of your audience.
Facebook Engagement
Are you connecting with your audience on Facebook? Track your Facebook engagement metrics on a dashboard to measure the impact of your brand messaging and value.
Facebook Likes
Measure the total number of Facebook accounts that like your Page, track growth momentum, and connect audience size to real business outcomes.
Facebook Page Likes
Understand the effectiveness of your company's Facebook Page.
Followers Growth
Track your follower growth against your goals on a social media dashboard
Instagram Followers
Track the total number of Instagram accounts following your profile and measure audience growth over time.
Key Social
How effective is your website at building an audience?
New Followers
How many social media followers are your campaigns attracting?
Social Events
Monitor interactions on your social channels to understand audience engagement and grow your reach.
Social Media Followers
Measure the total number of users following your accounts across social media platforms.
Social Interactions
Measure the engagement levels of your social media campaigns
Social Sentiment
A measure of the overall emotional tone of public conversations about your brand, drawn from social media posts, reviews, and comments.
Social Shares
Measure the total number of times your content has been shared across social media platforms.
Social Visits and Leads
The effectiveness of social campaigns at driving visitors and leads to your website.
Social Traffic and Conversions
Measure traffic and goal completions from social sources.
X (Twitter) Engagement
Understand which posts are most effective in your X (Twitter) campaigns.
X (Twitter) Followers
Understand the effectiveness of your company's presence on X (formerly Twitter).
YouTube Channel Subscribers
Measure the total number of YouTube accounts following your channel and receiving updates each time you post new content.
Facebook Engagement Rate
Facebook Engagement Rate measures the proportion of your audience that actively interacts with your content — likes, comments, shares, and reactions — relative to your total followers.
Post Engagement
Post Engagement measures how many people interact with a specific social media post through likes, comments, and shares, expressed as a percentage of your total followers.
Retweets
Retweets are X's built-in sharing feature, republishing a post to all of your followers and extending its reach beyond the original audience.
Social Media Mentions
Social media mentions are posts, tags, images, and comments that reference your brand on social platforms, created by users rather than your own team.
Social Media Dashboard Examples
- Social Media
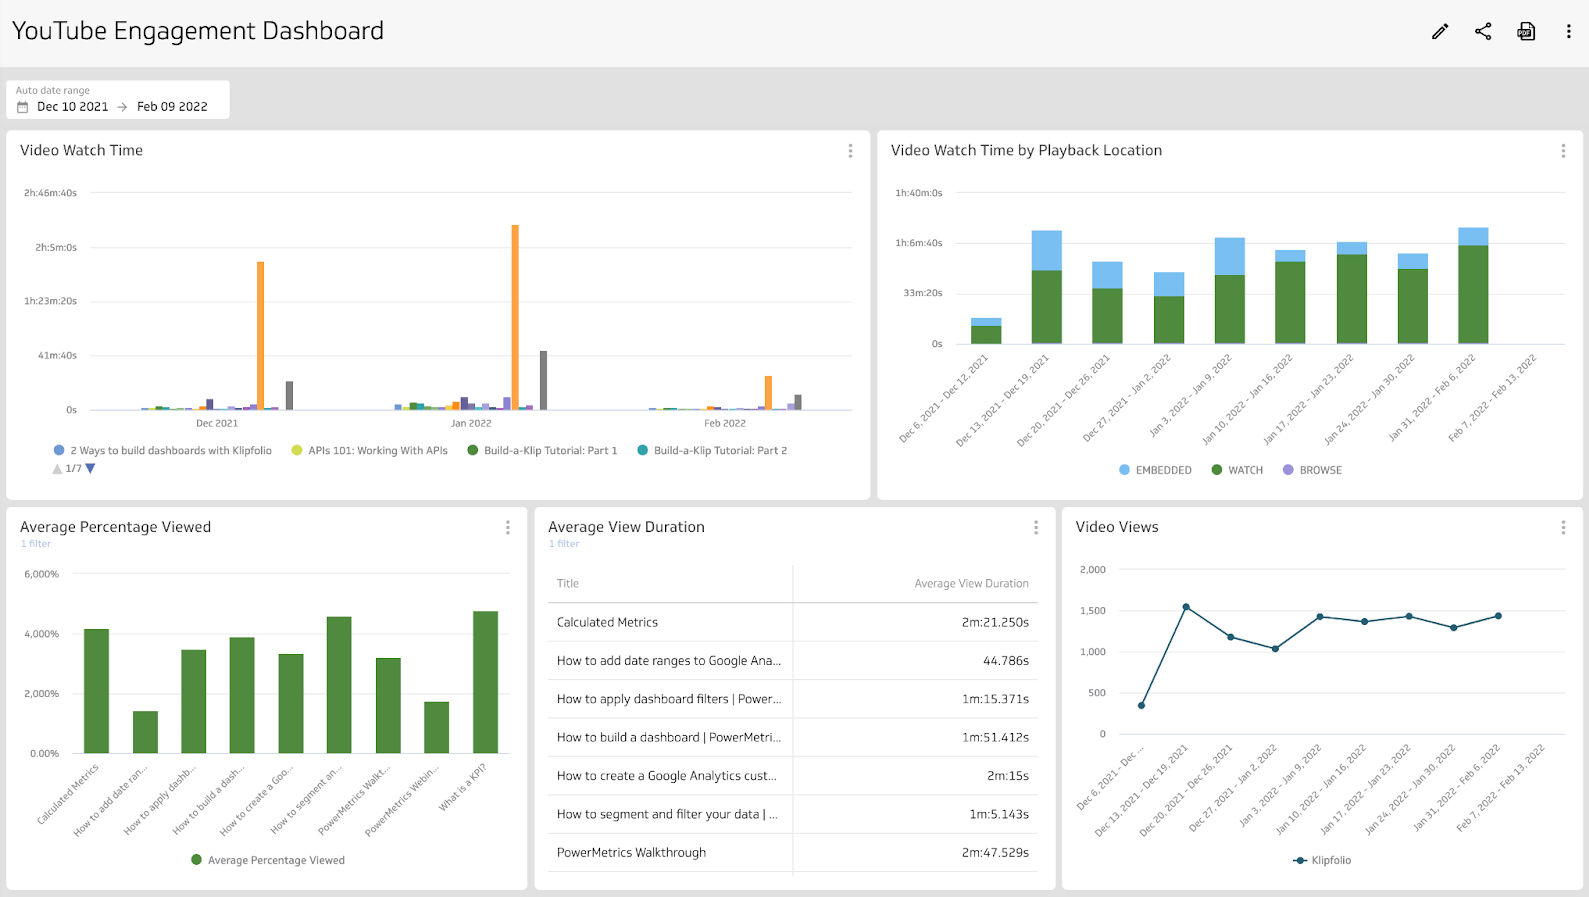
YouTube Analytics Dashboard
Track views, watch time, and subscriber growth in a clear YouTube dashboard.
- Social Media
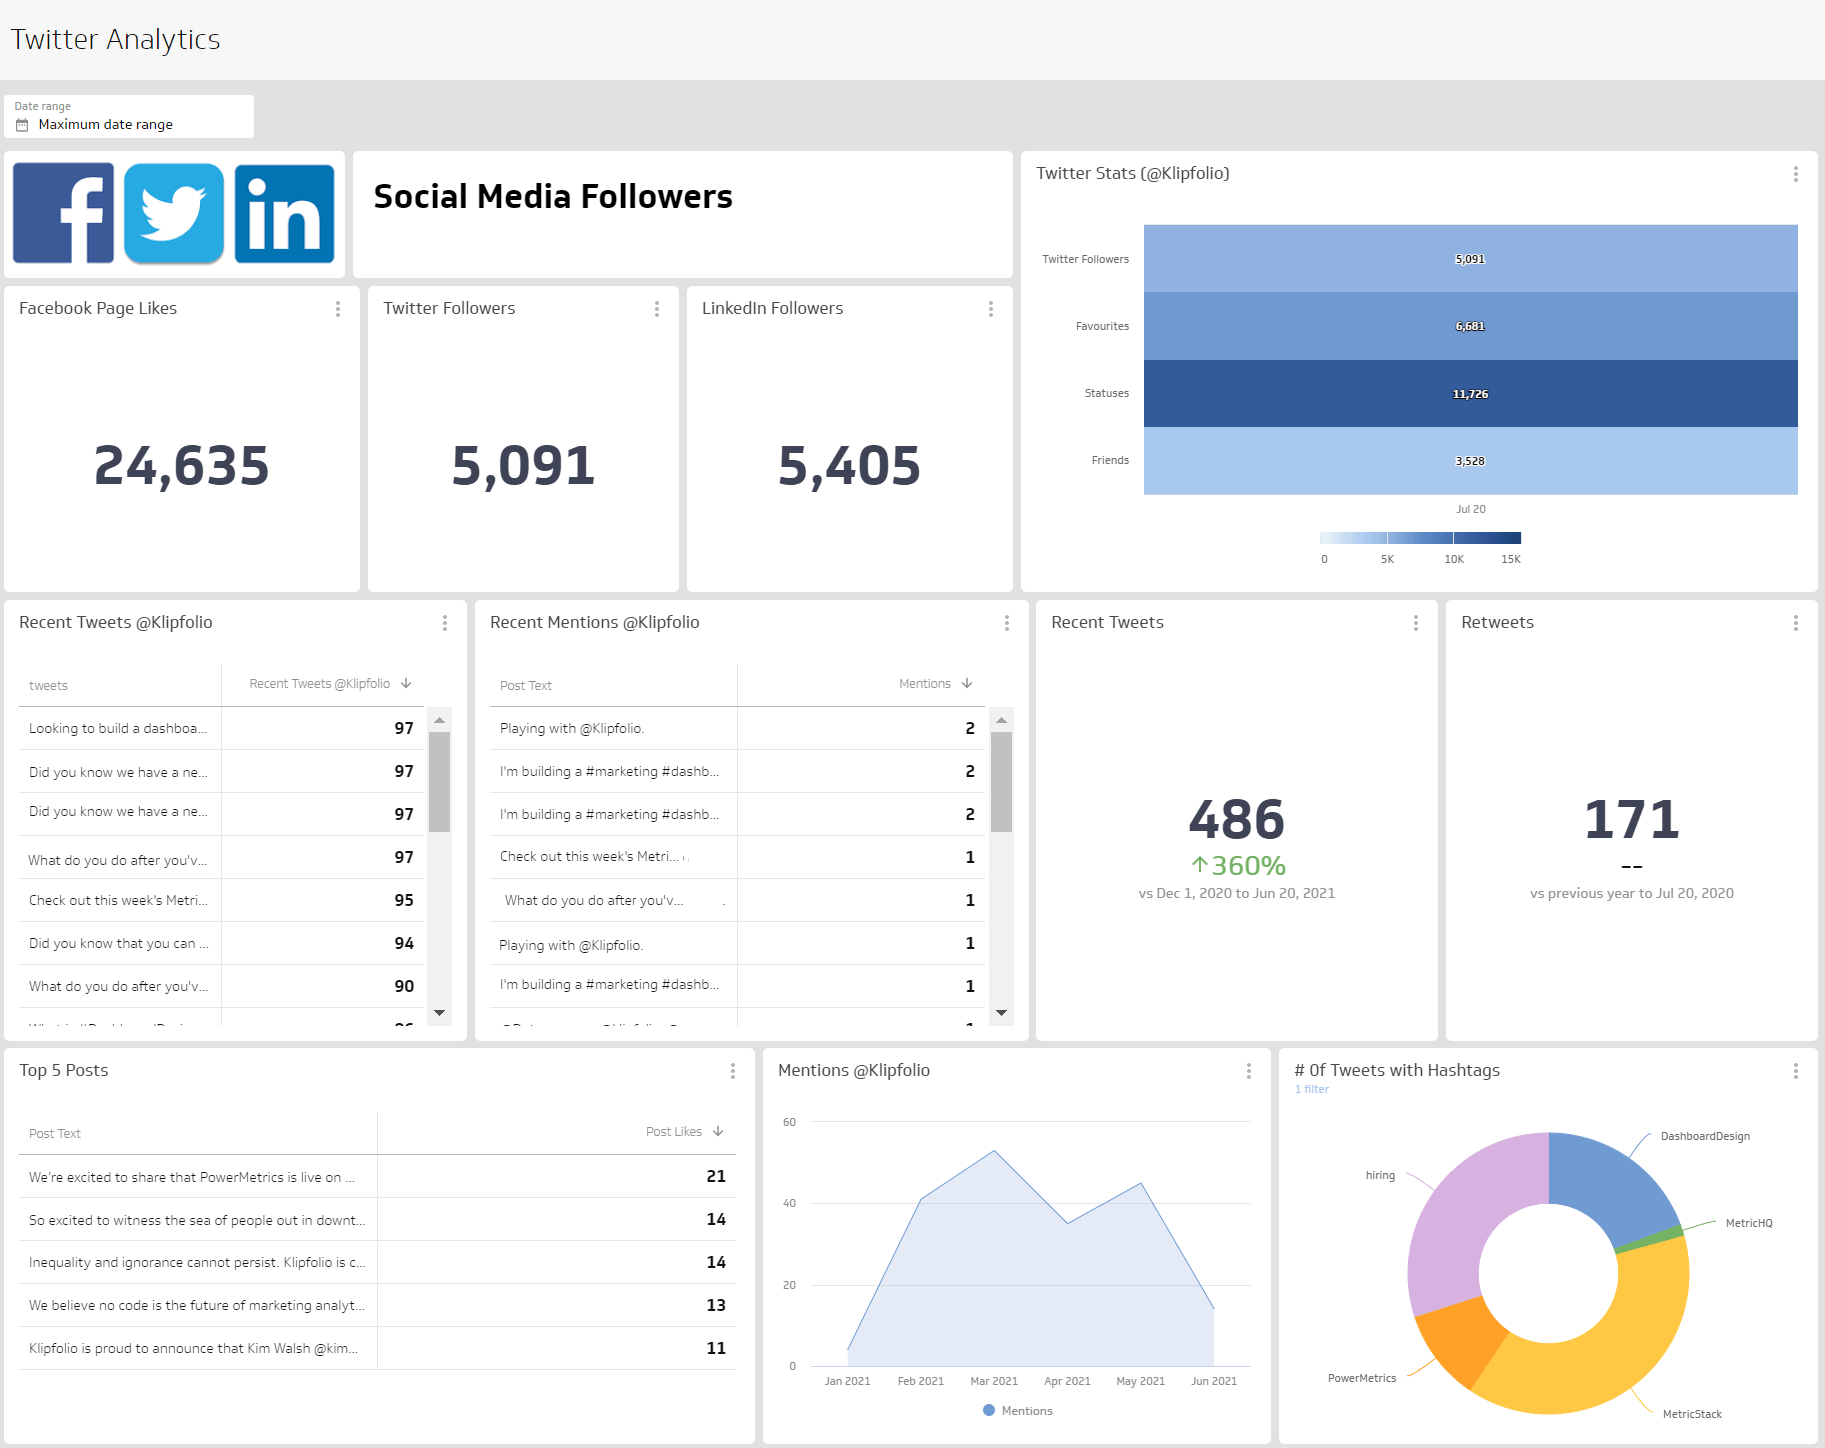
X analytics dashboard
Track reach, engagement, and follower growth on X with a live dashboard that keeps your whole team on the same page.
- Social Media
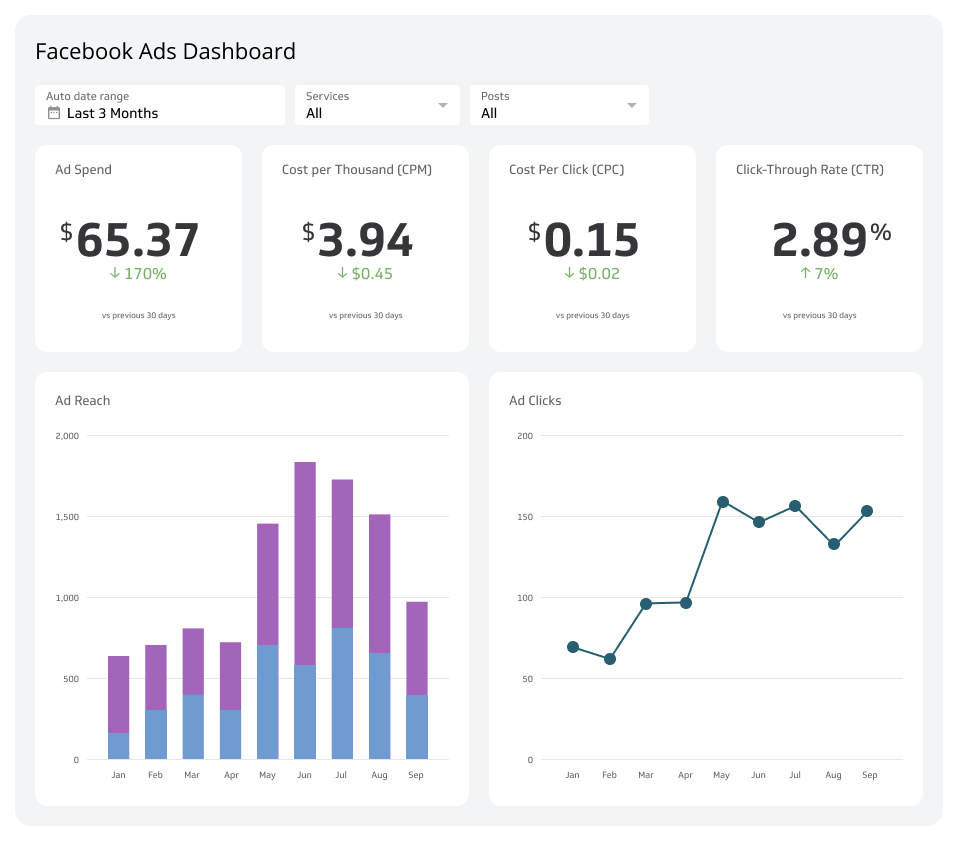
Facebook Ads Dashboard
Track campaign performance, ad spend, and ROI with a Facebook Ads dashboard built for your whole team.
- Social Media
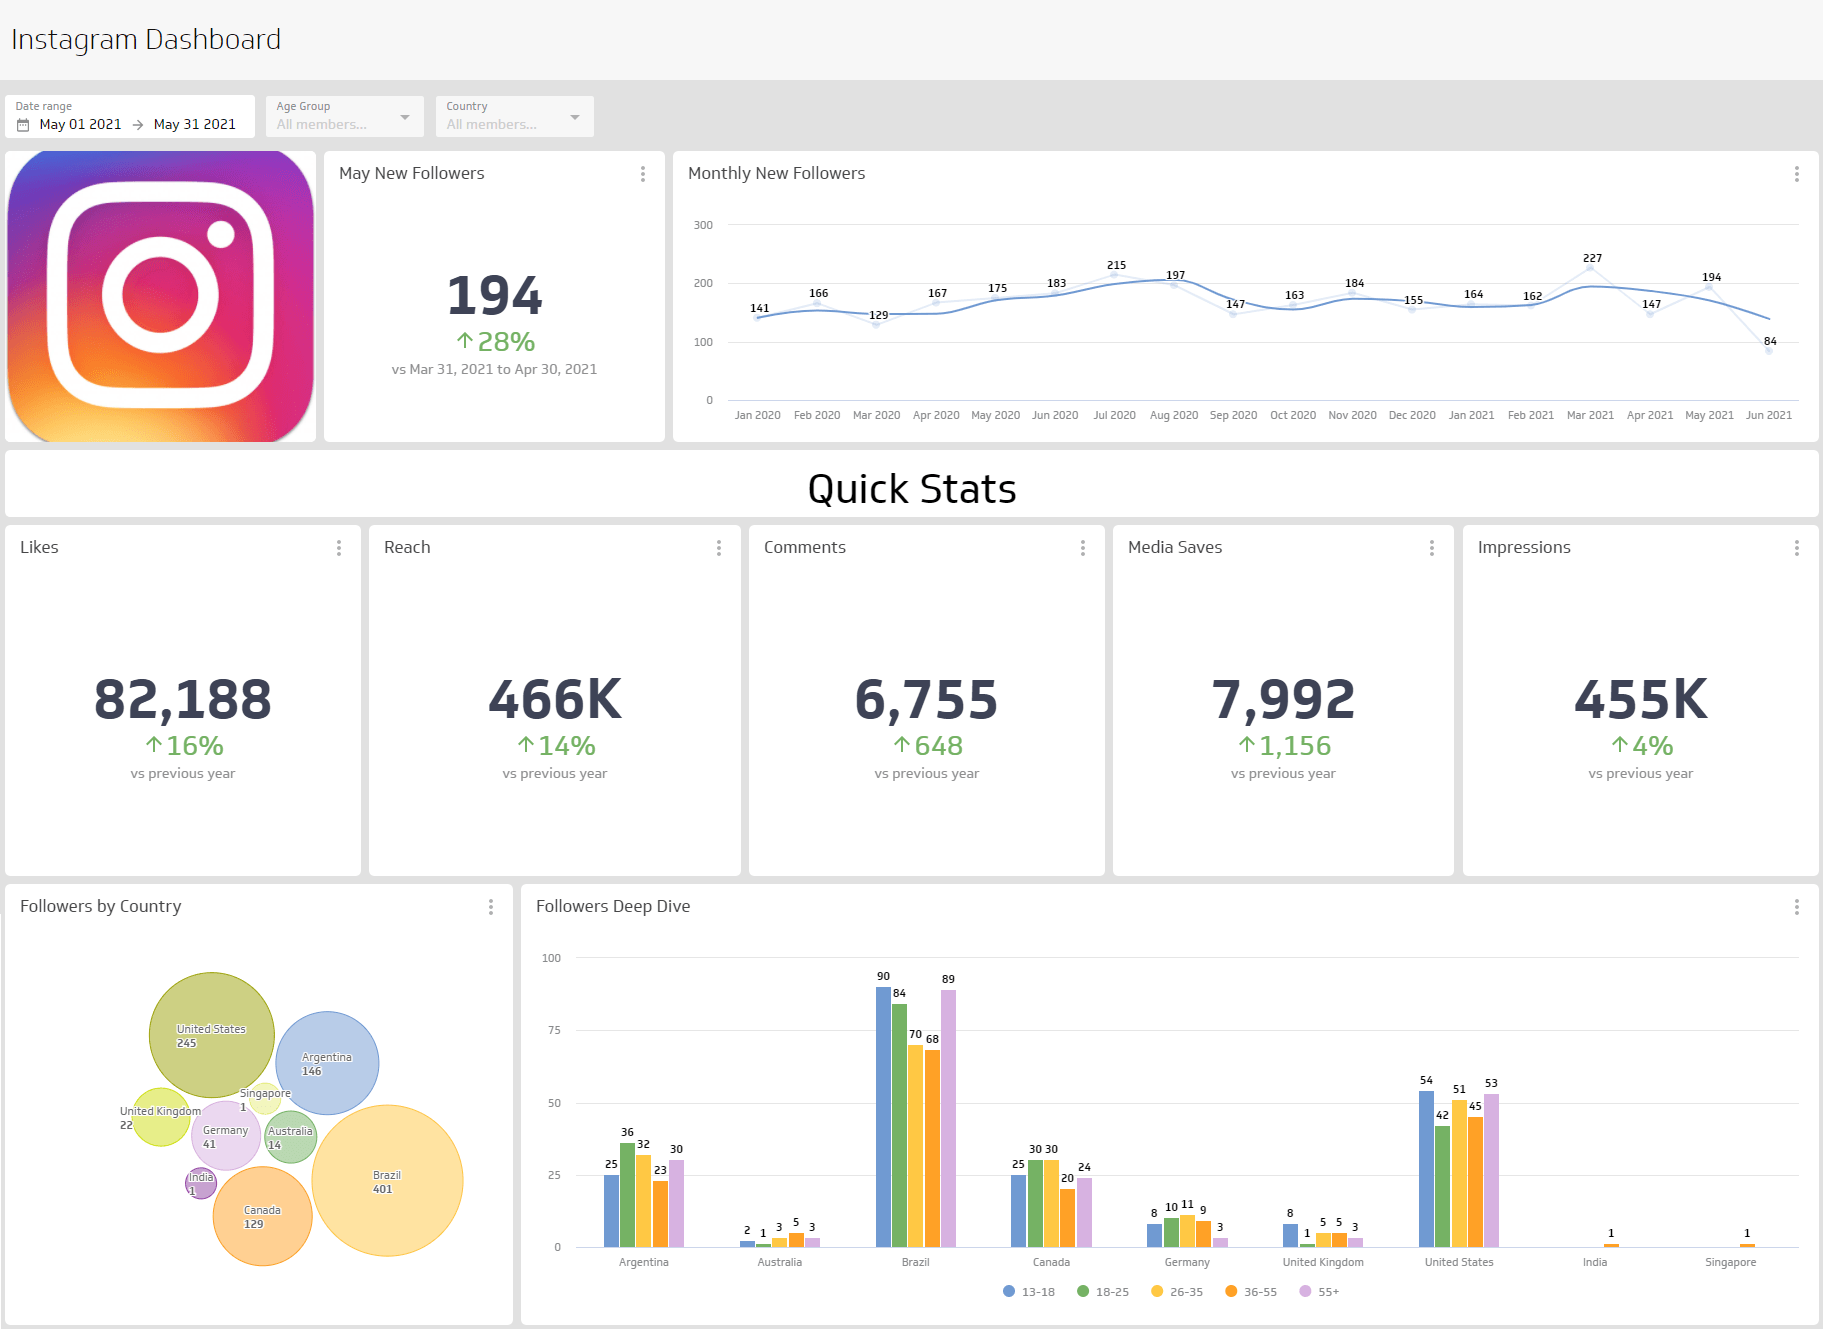
Instagram Dashboard
Track reach, engagement, and growth in one clear Instagram dashboard.
- Social Media
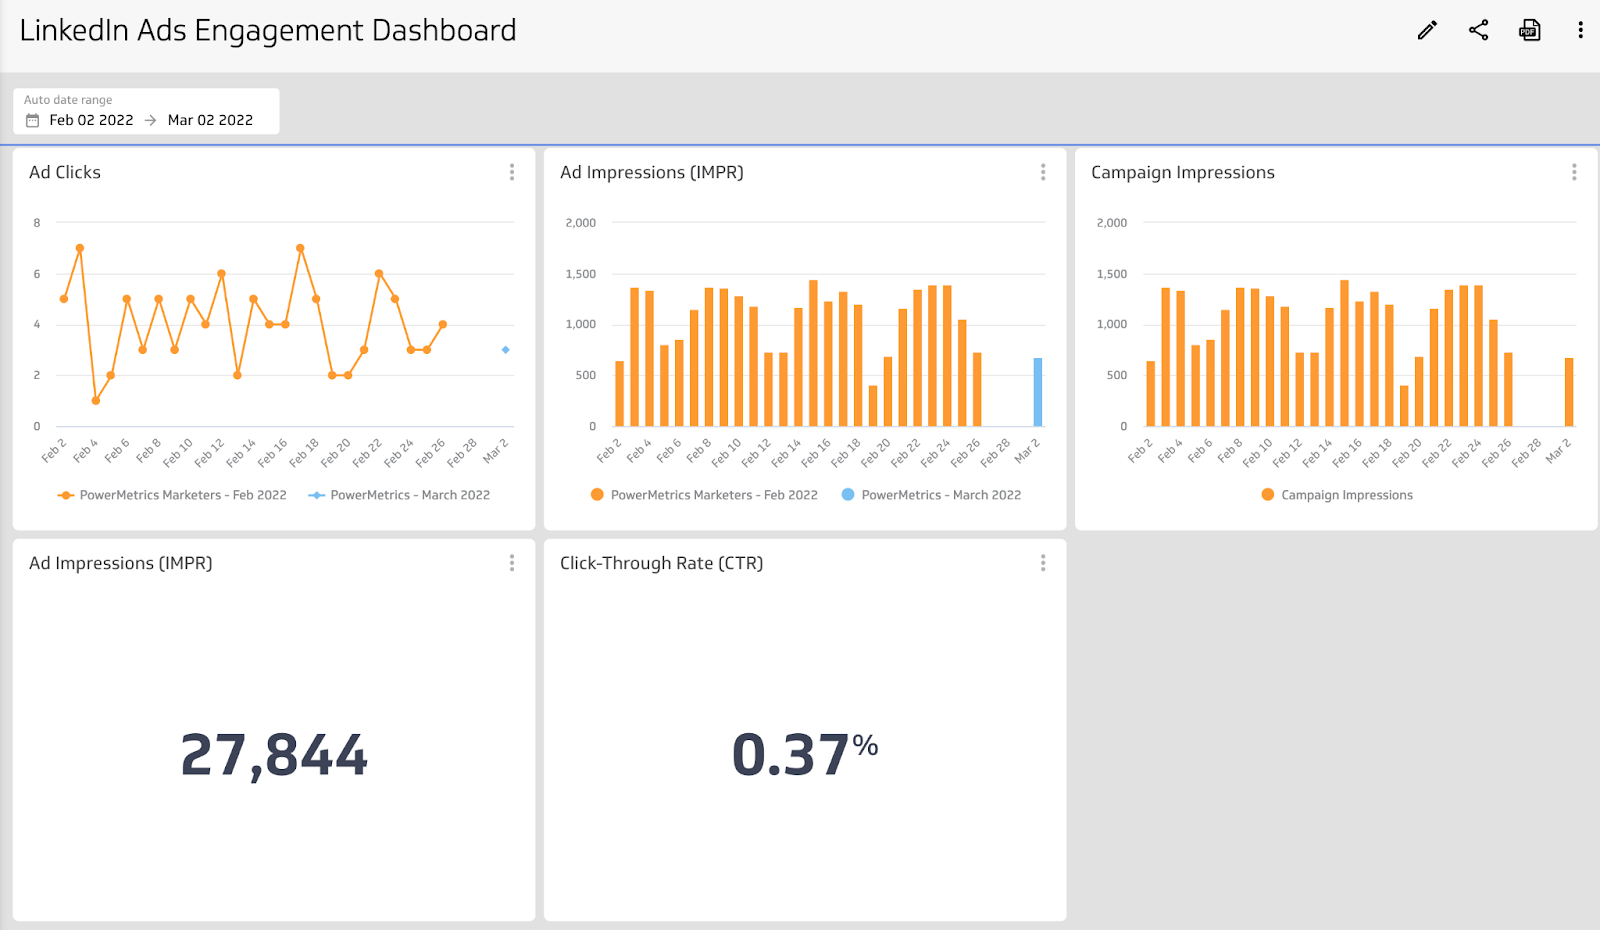
LinkedIn Ads Dashboard
Track your ad spend, engagement, and campaign performance in one place.
- Social Media
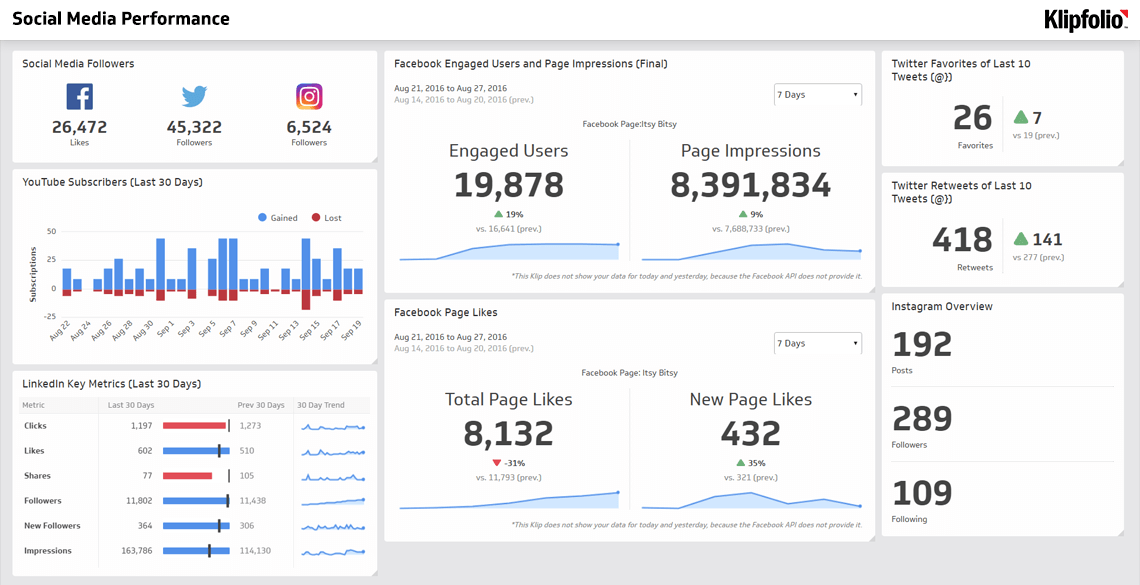
Social Media Performance Dashboard
Unify your social channels and track what matters most.
- Social Media
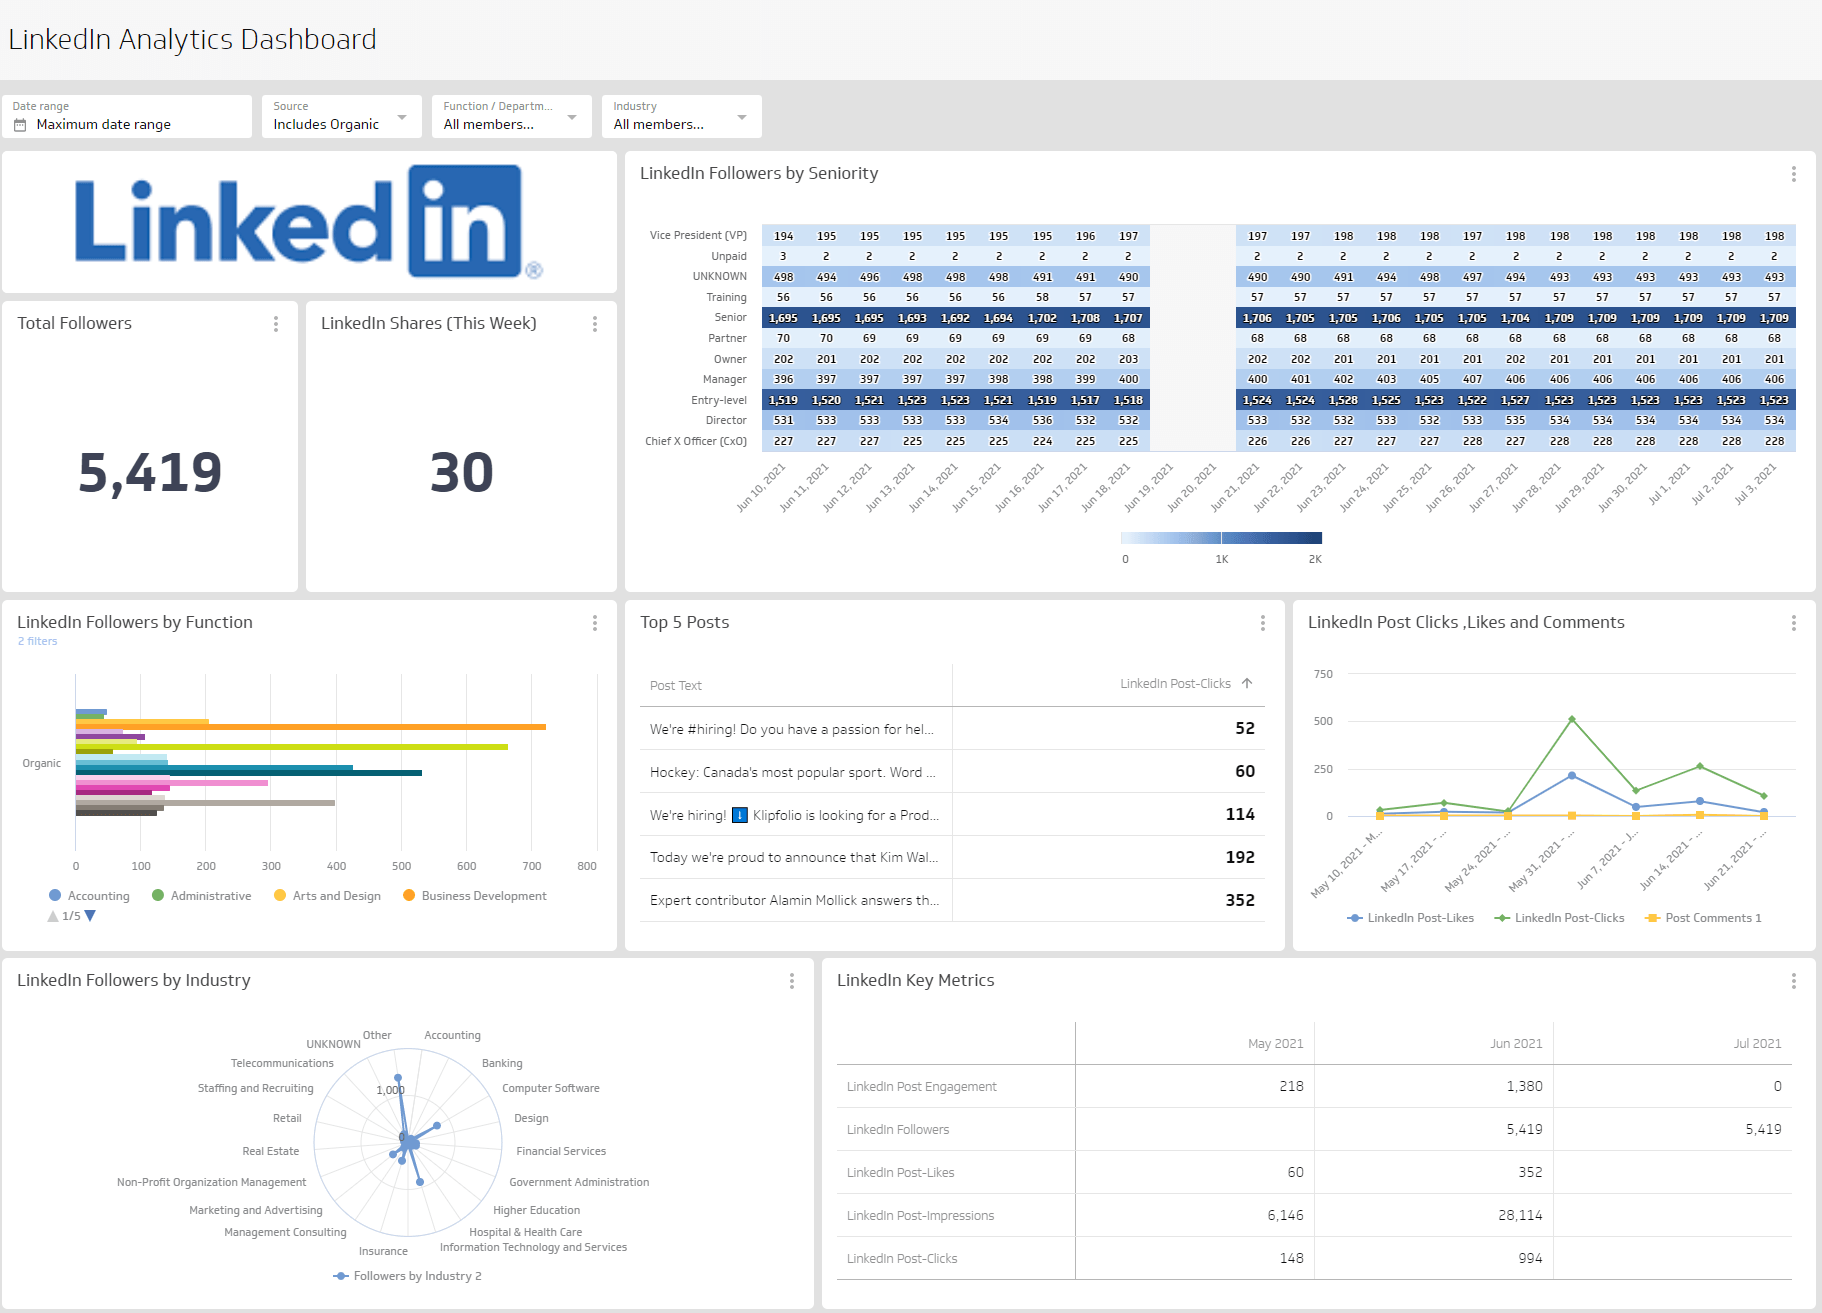
LinkedIn Analytics Dashboard
Measure your organic LinkedIn content strategy.
- Social Media
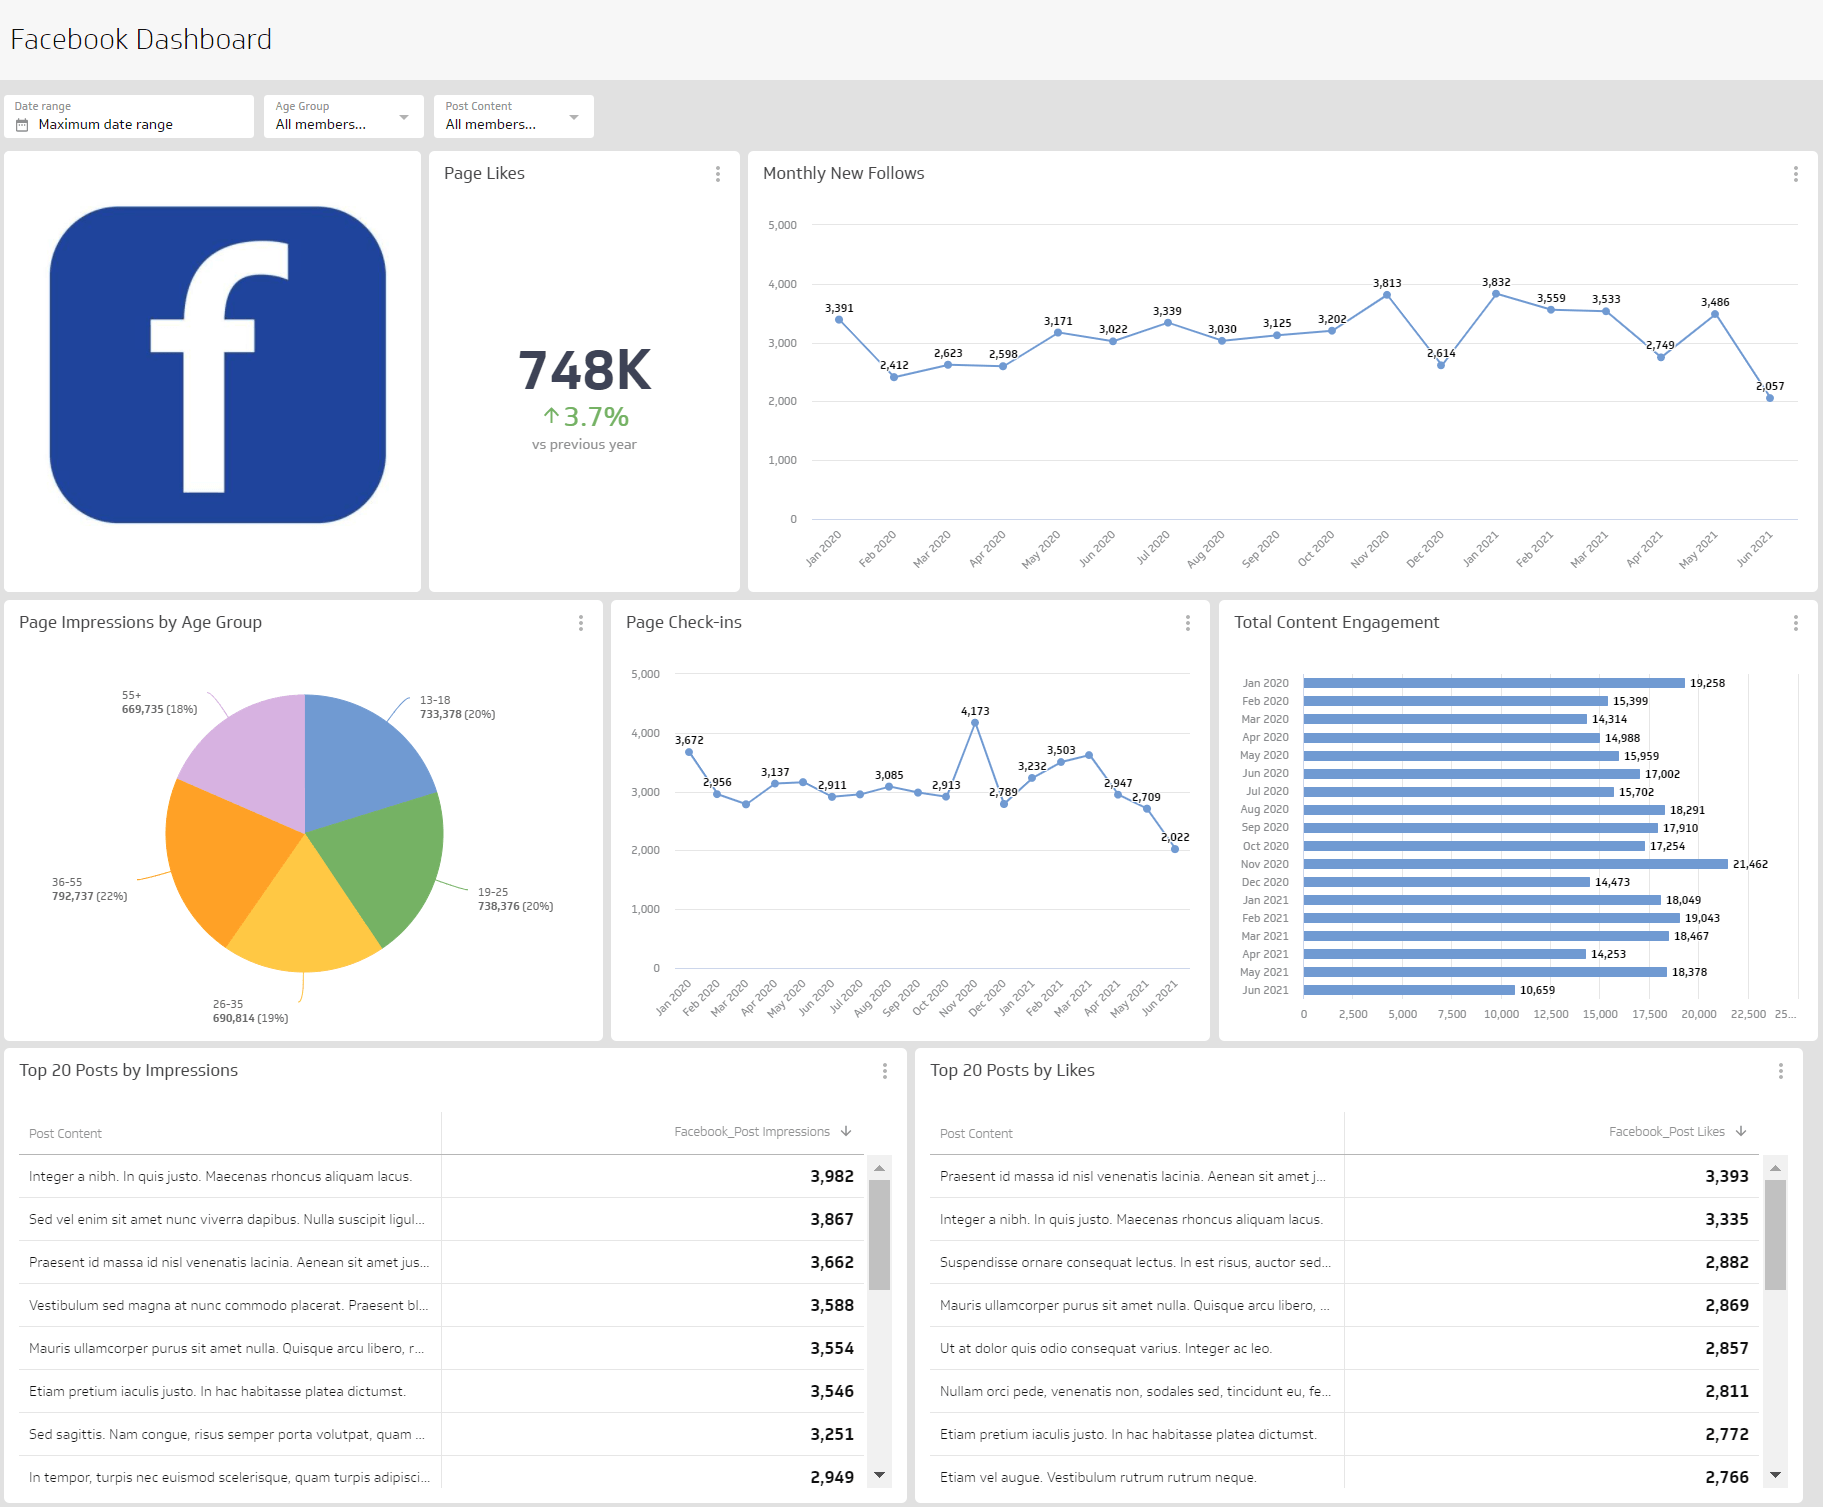
Facebook Analytics Dashboard
Monitor your campaign performance with a Facebook dashboard to track key engagement metrics.
- Social Media
Social Media Metrics Dashboard
Track performance across every social platform in one reliable view — no tab-switching, no manual data wrangling.
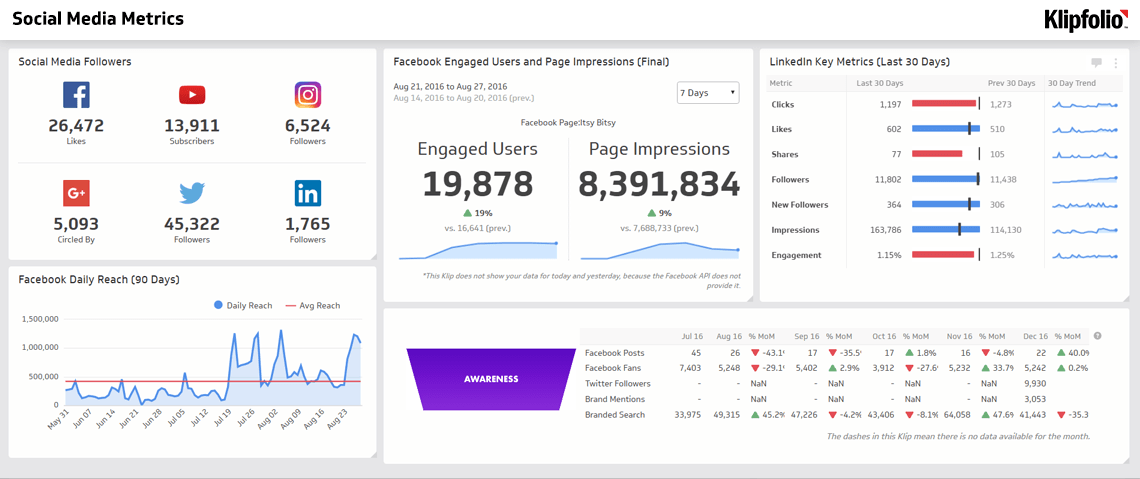
What are social media KPIs?
Social media KPIs are metrics that measure the performance of your social media campaigns across platforms like Facebook, LinkedIn, Instagram, and Pinterest.
Multi-channel marketing makes it hard to see the full picture. Results are spread across accounts, formats, and audiences, and pulling them together manually takes time you don't have. Tracking your KPIs on a social media dashboard gives you one place to see what's working, what isn't, and where to focus next.
Why social media KPIs matter for decision-makers
You don't need to know how every algorithm works. You do need to know whether your social media investment is paying off.
Social media KPIs answer that question. They tell you whether your content is reaching the right people, whether your audience is engaging with your brand, and whether that engagement is translating into results. Without them, you're making decisions based on instinct rather than evidence.
When your metrics are centralized and up to date, your team can stop debating the numbers and start acting on them.
Best social media KPIs and metrics to track
The following KPIs give social media teams a clear view of performance across reach, engagement, and conversion:
Likes: A basic signal of content resonance. Useful for spotting which posts land with your audience.
Engagement: Measures total interactions (likes, comments, shares) relative to reach. A stronger signal than Likes alone.
Follower Growth: Tracks how your audience is expanding over time. Declining growth is an early warning sign worth investigating.
Social Shares: Indicates whether your content is valuable enough for people to pass along. High shares extend your organic reach.
Social Interactions: The volume of direct responses to your content, including comments and replies. Reflects active audience interest.
Social Sentiment: Qualitative measure of how people feel about your brand. Positive sentiment supports trust; negative sentiment warrants a response.
Web visitors by channel source: Shows how much traffic each social platform drives to your site. Helps you allocate effort where it counts.
Social visitors conversion rate: The share of social visitors who take a desired action on your site. Connects social activity to business outcomes.
Traffic conversions: Measures the number of visitors from social channels who convert to leads or customers.
Create custom dashboards for you and your team.
Get started with KlipsHow do you measure social media ROI?
Return on Marketing Investment (ROMI) connects your social media activity to revenue. It answers the question every leader eventually asks: is this worth it?
ROMI is calculated as:
ROMI = ((Revenue attributed to campaign - Campaign cost) / Campaign cost) × 100
Track ROMI alongside your social media KPIs on a shared dashboard. When your engagement metrics, traffic data, and conversion numbers live in one place, you can see the full story: what drove results, what didn't, and what to adjust before the next campaign.
That's the difference between reporting on the past and making confident decisions about what comes next.
For more examples and templates of KPIs, see below.