X (Twitter) Engagement
Understand which posts are most effective in your X (Twitter) campaigns.
Engagement Rate
What is X (Twitter) Engagement?
X (platform) Engagement measures how much your posts connect with your audience. It counts every interaction a post receives, including reposts, replies, likes, link clicks, and profile taps.
If you still see this metric labelled "Twitter Engagement" in your analytics tools, it refers to the same thing: total interactions divided by impressions or follower count, depending on the platform's calculation method.
What counts as engagement on X?
X counts an engagement any time someone interacts with a post. That includes:
- Reposts (formerly retweets): Your post appears on the reposter's timeline, extending your reach to their audience.
- Replies: Direct responses to your post, which signal active interest.
- Likes (formerly favourites): A quick signal that the content resonated.
- Link clicks: Visits to a URL in your post, a strong indicator of intent.
- Profile taps: When someone clicks your username or photo to learn more.
- Hashtag clicks: Taps on a hashtag in your post.
- Post expansions: When someone clicks to see the full post or thread.
- Embedded media interactions: Clicks on images, videos, or cards.
- Follows from the post: New followers gained directly from a post.
Key terms
- Likes: The number of people who tap the like button on your post. A baseline signal of content resonance.
- Reposts: When a user reshares your post to their own timeline. Reposts extend your reach beyond your existing followers.
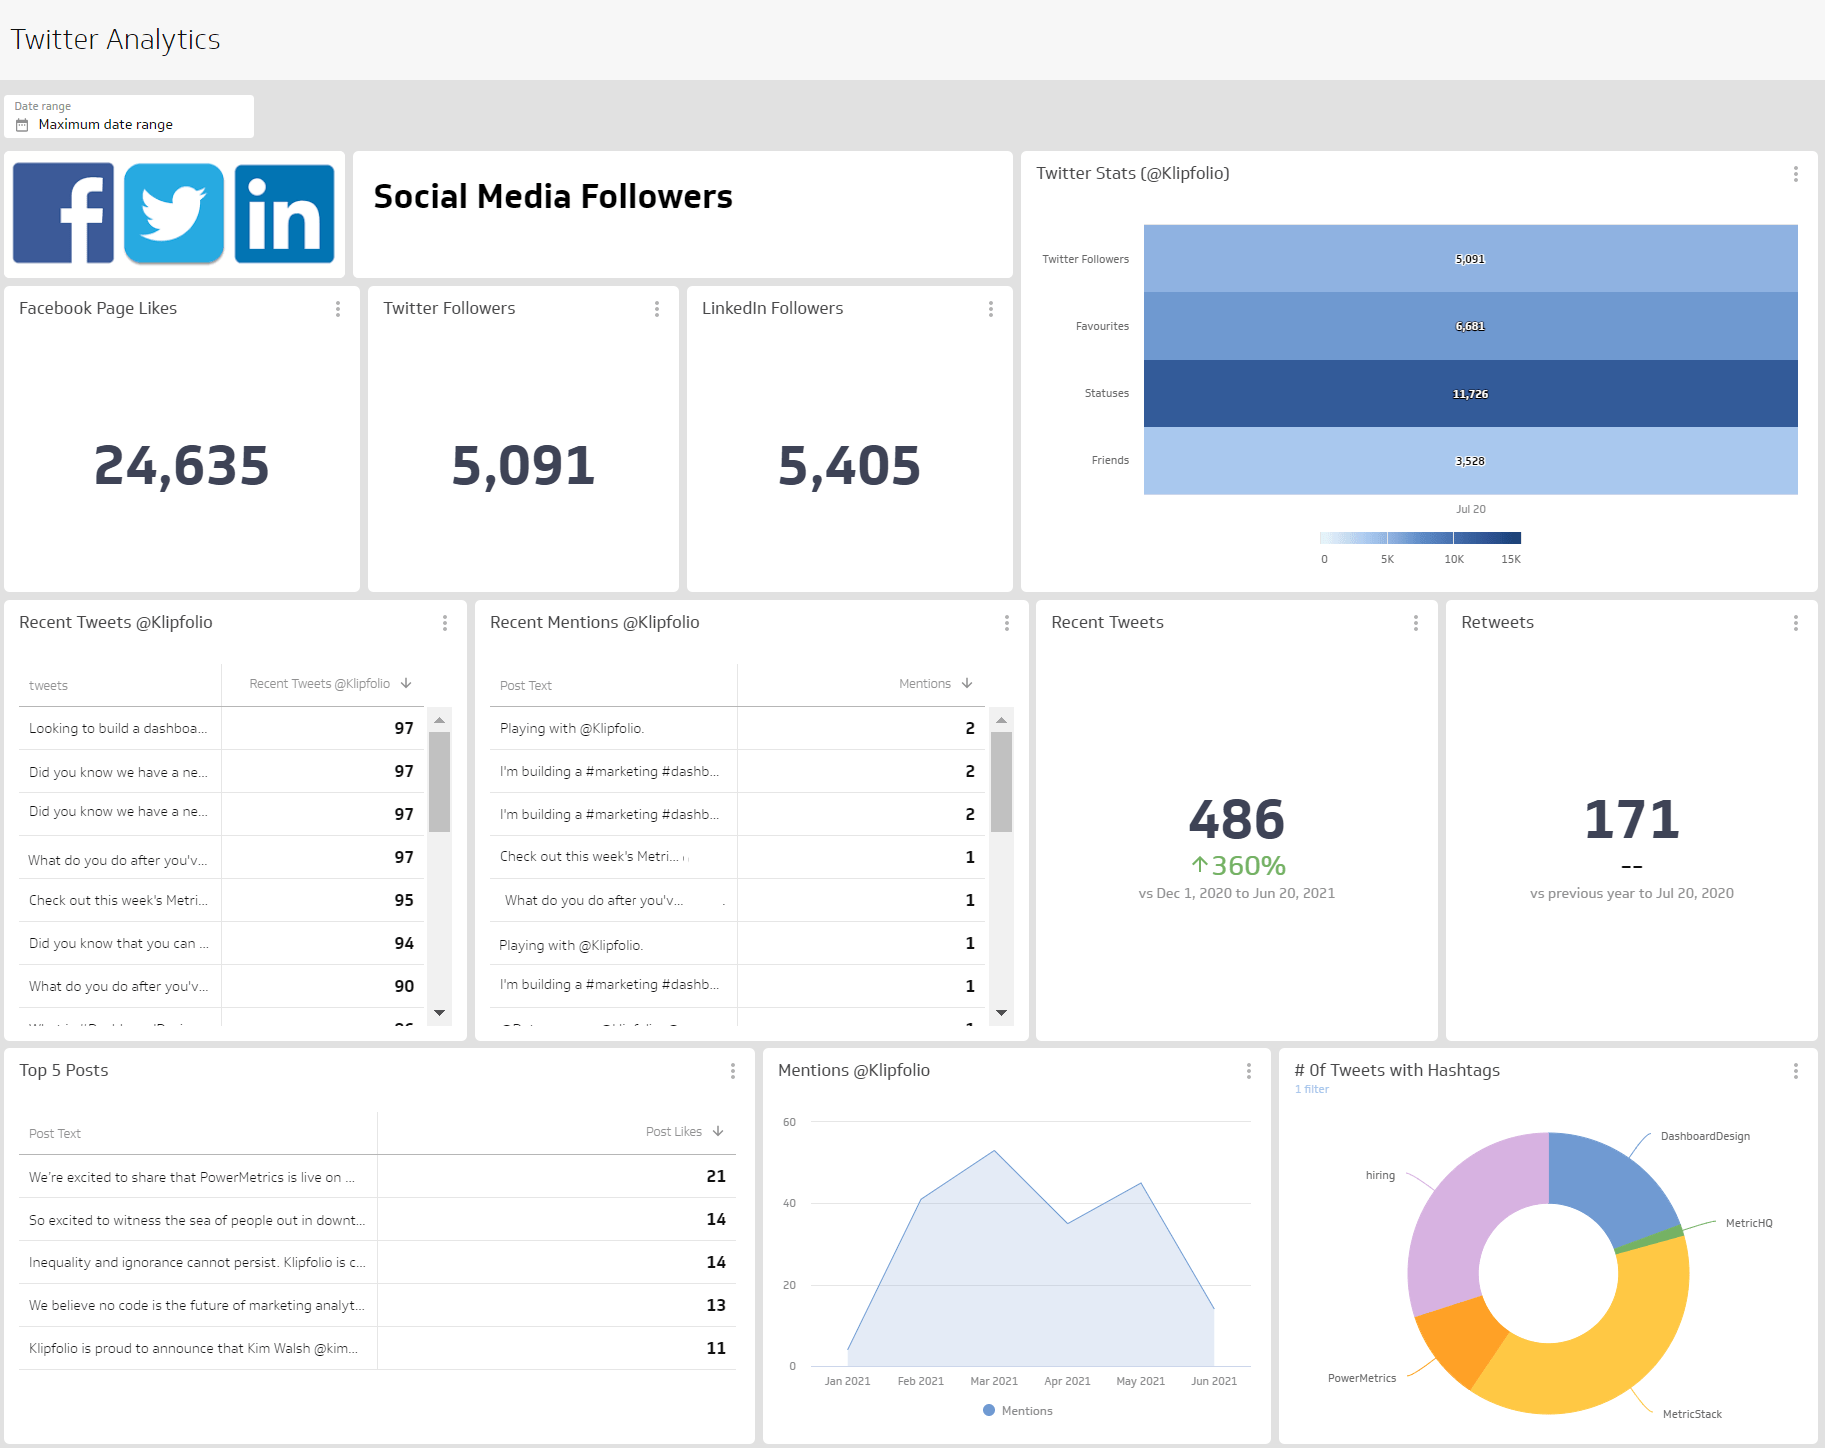
- Mentions: When a user includes your handle in their own post. Mentions show up in your notifications and on the mentioning user's timeline, giving your account passive exposure.
How to calculate X Engagement Rate
The most common formula uses impressions as the denominator:
Engagement Rate = (Total Engagements / Total Impressions) × 100
You can also calculate it against follower count:
Engagement Rate = (Total Engagements / Total Followers) × 100
Use the impressions-based formula when you want to measure how well a specific post performed with the audience that actually saw it. Use the follower-based formula when benchmarking your account's overall reach efficiency over time.
X Engagement benchmark
Trended benchmarks, built from your own historical data, are the most reliable reference point for X Engagement. Your audience, posting frequency, and content mix all shape what "good" looks like for your account specifically.
Kevan Lee from Buffer describes a practical approach: take your total impressions over a set period, divide total engagements by total impressions, and use that percentage as your baseline. In his example, 1,782 engagements across 73,556 impressions produced a 2.4% Engagement Rate. That figure then becomes the floor: at least 2.4% of people who see a post should click, like, repost, or reply.
Start by establishing your own baseline, then set a target above it. Revisit the benchmark monthly as your audience grows.
Success indicators
- Rising overall engagement: More interactions per post, week over week or month over month.
- Increased website visits from X: Posts are driving traffic, not just passive views.
Best practices for improving X Engagement
Hannah Clark of Hootsuite outlines five approaches that consistently move the needle:
- Know what your audience wants to see. Content that solves a real problem for your specific followers outperforms generic posts. Practical tips and actionable advice tend to generate more clicks and reposts than broad commentary.
- Use compelling visuals. Images and GIFs stop the scroll. Work with your design team to create platform-native visuals that complement your copy, not just illustrate it.
- Refine your copy repeatedly. A post is not set-and-forget. Test different angles, lengths, and calls to action. What works once should be studied; what flops should inform the next attempt.
- Double down on what works. Posts that perform well get reshared and repurposed. Posts that underperform get replaced. Feed that feedback to whoever creates the content so the next round is sharper.
- Show some personality. A dry feed blends into the noise. A little wit, honesty, or a strong point of view gives people a reason to stop and engage.
How to monitor X Engagement without checking constantly
Checking your X analytics manually every day is not a process. It is a habit that costs time without building clarity.
The more useful version: your engagement data surfaces automatically alongside your other social metrics, so you know what is working without having to go looking. When reposts spike or Engagement Rate drops, you see it in context, not in isolation.
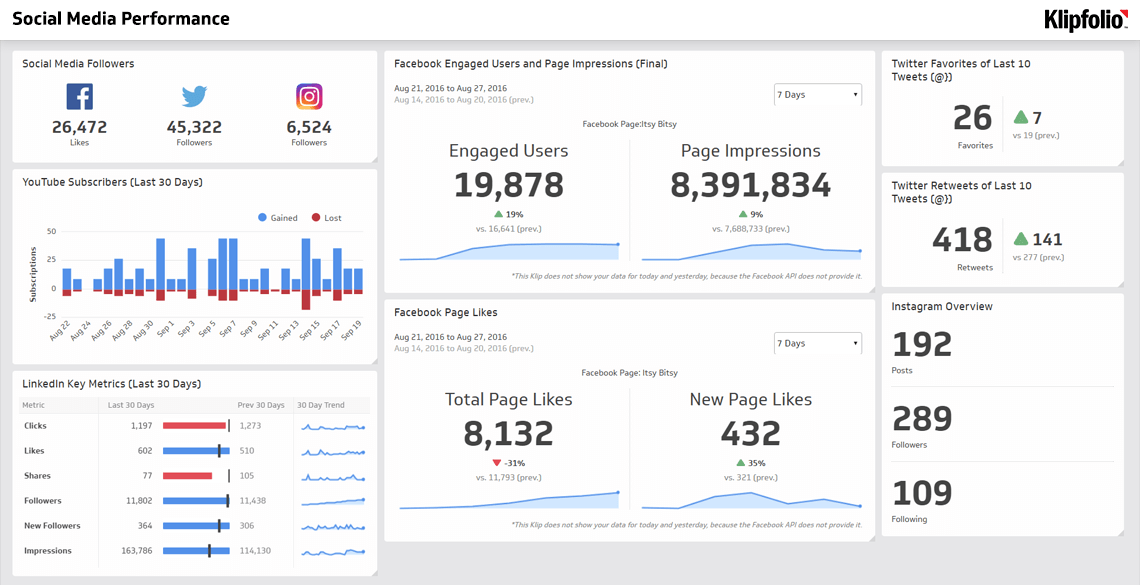
A Social Media Dashboard brings X Engagement together with metrics from your other platforms in one view. Instead of toggling between native analytics tools or pasting numbers into a spreadsheet to spot trends, you get a consistent, real-time picture of what is resonating and where to focus next.
Create custom dashboards for you and your team.
Get started with Klips