Facebook Engagement
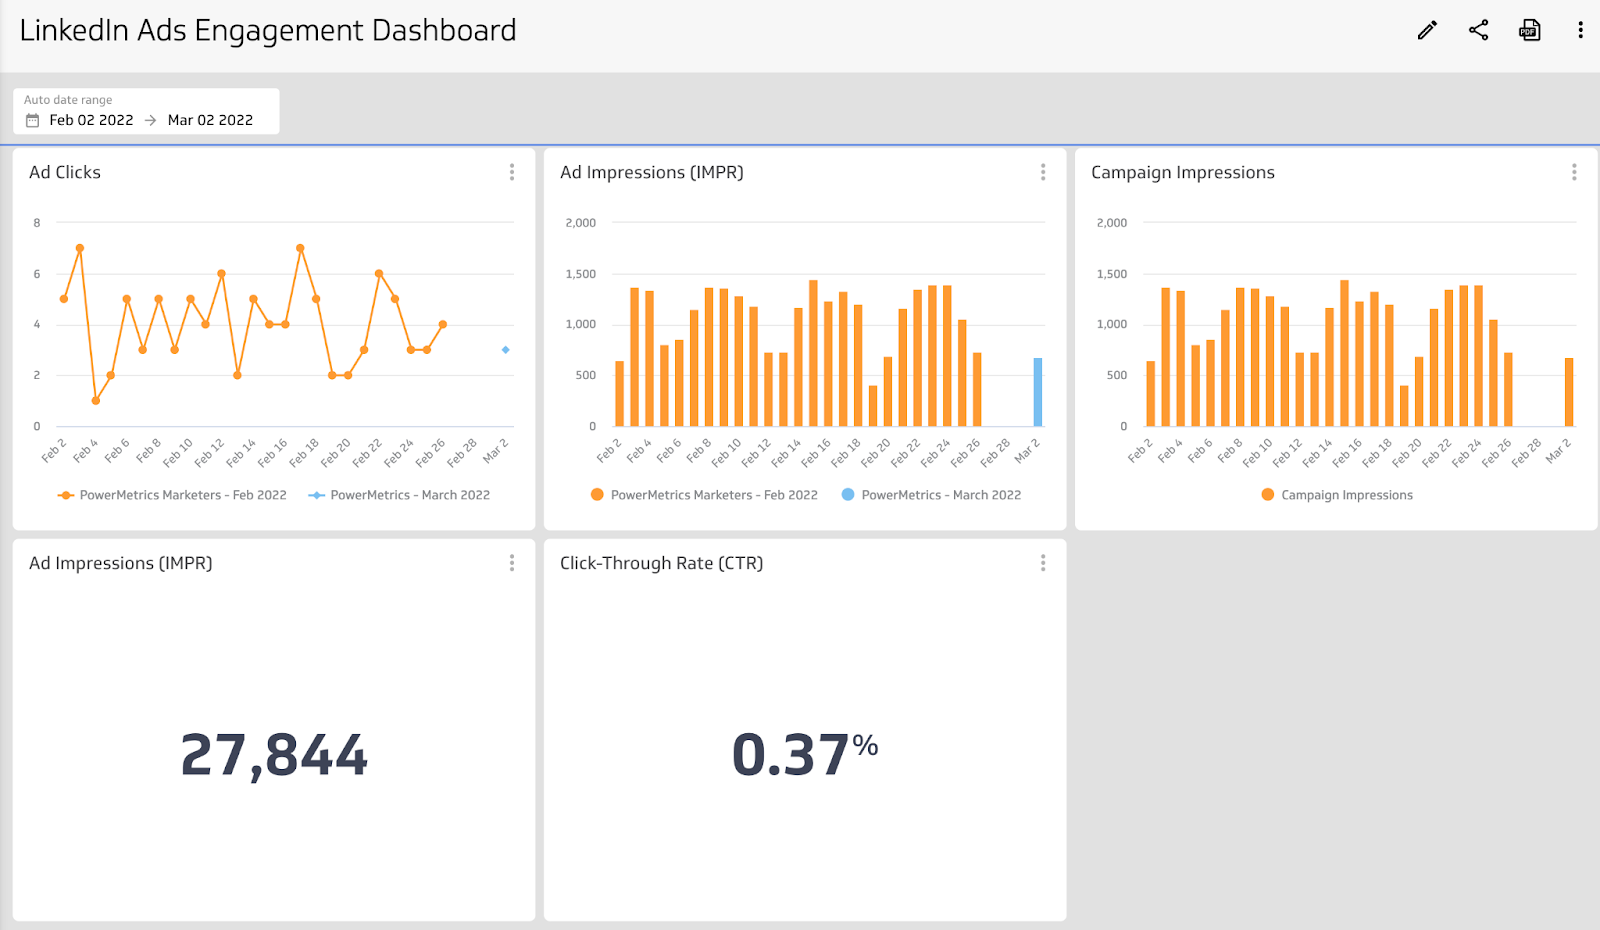
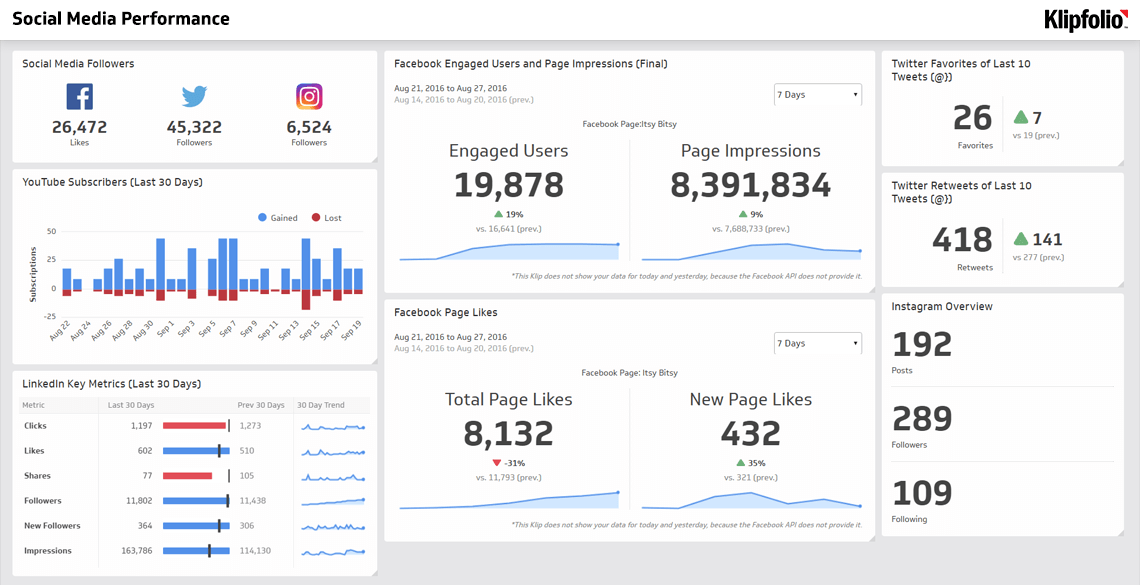
Are you connecting with your audience on Facebook? Track your Facebook engagement metrics on a dashboard to measure the impact of your brand messaging and value.
Facebook engagement by interaction type
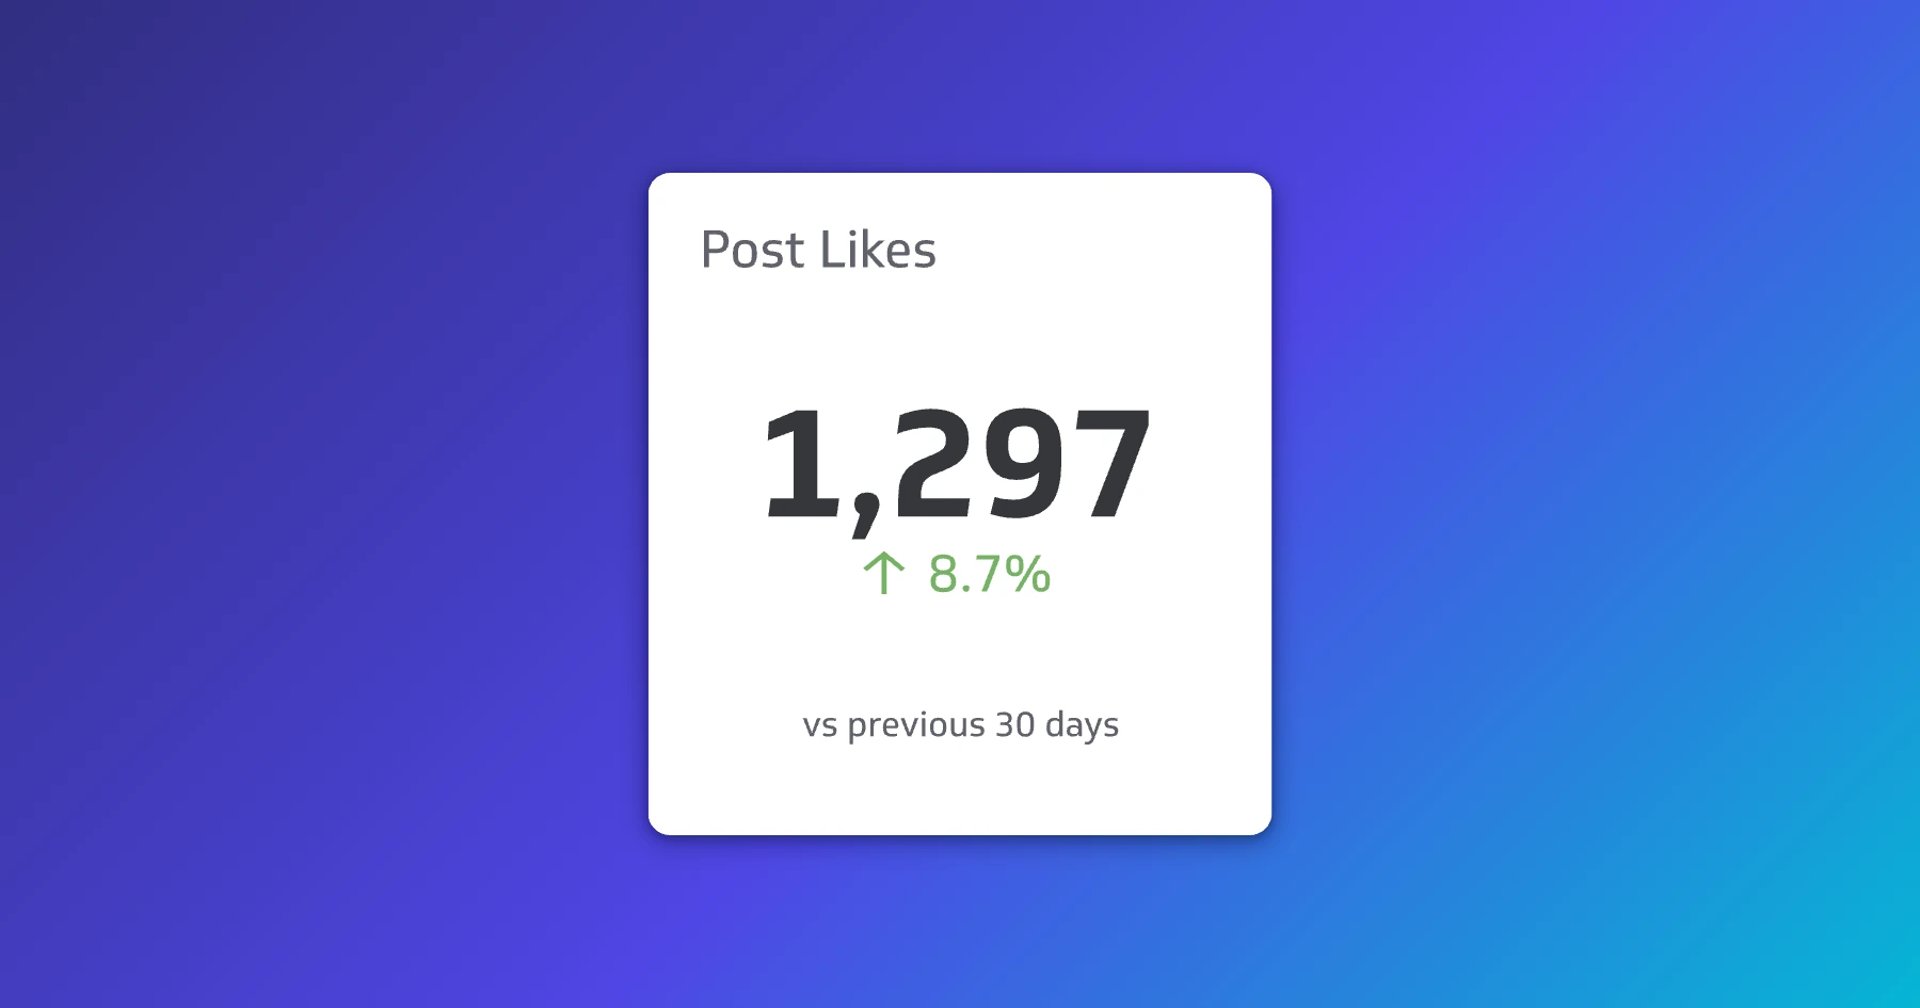
- Likes1.3k
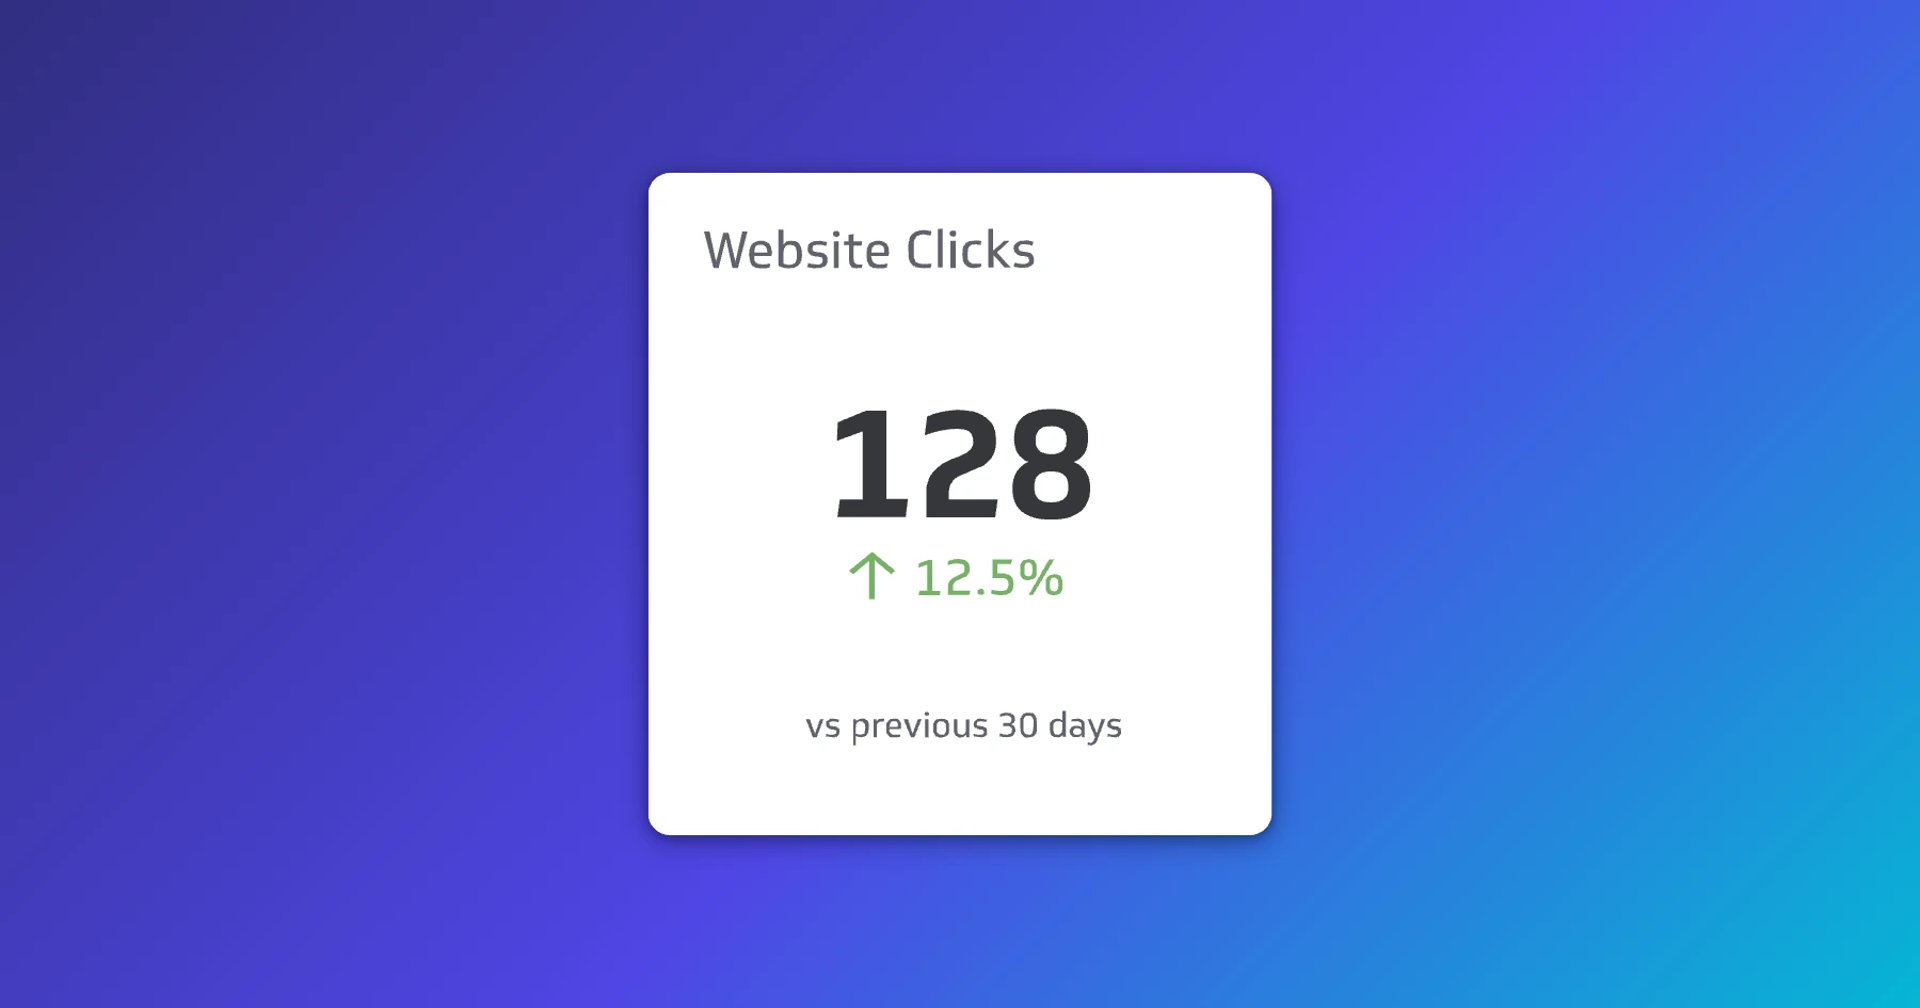
- Clicks128
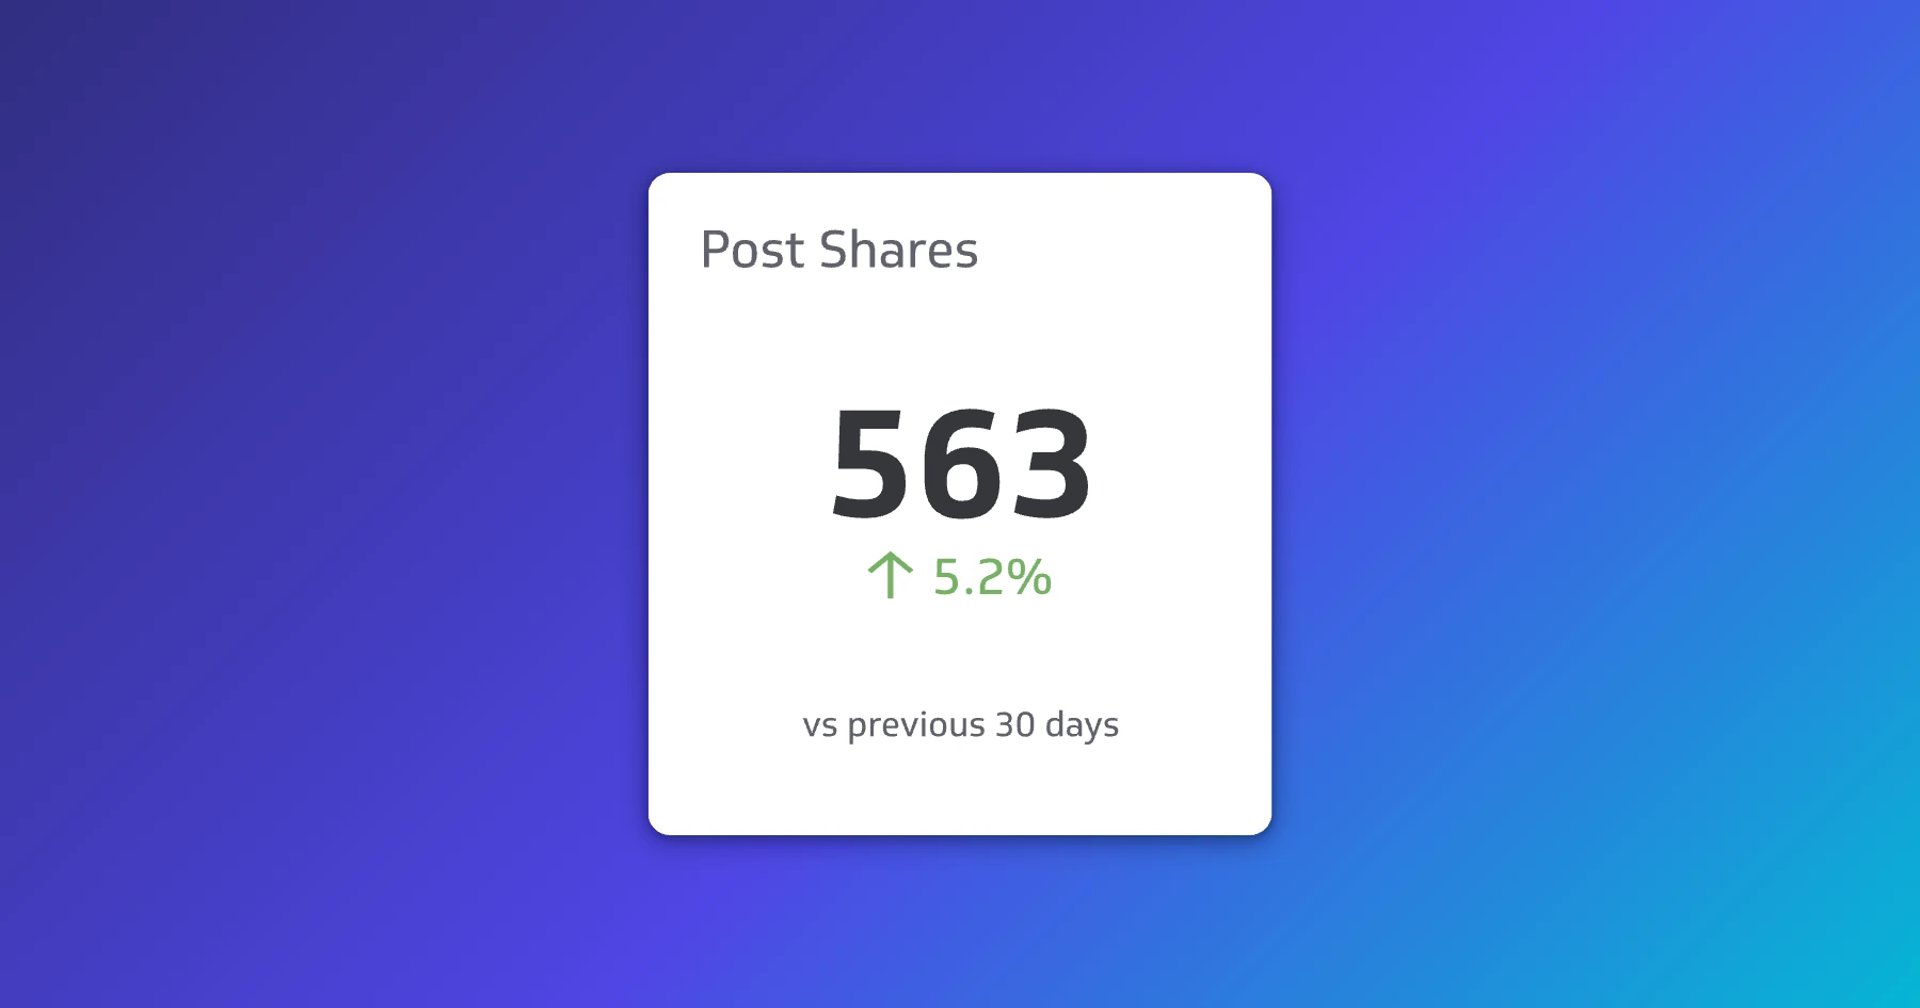
- Shares563
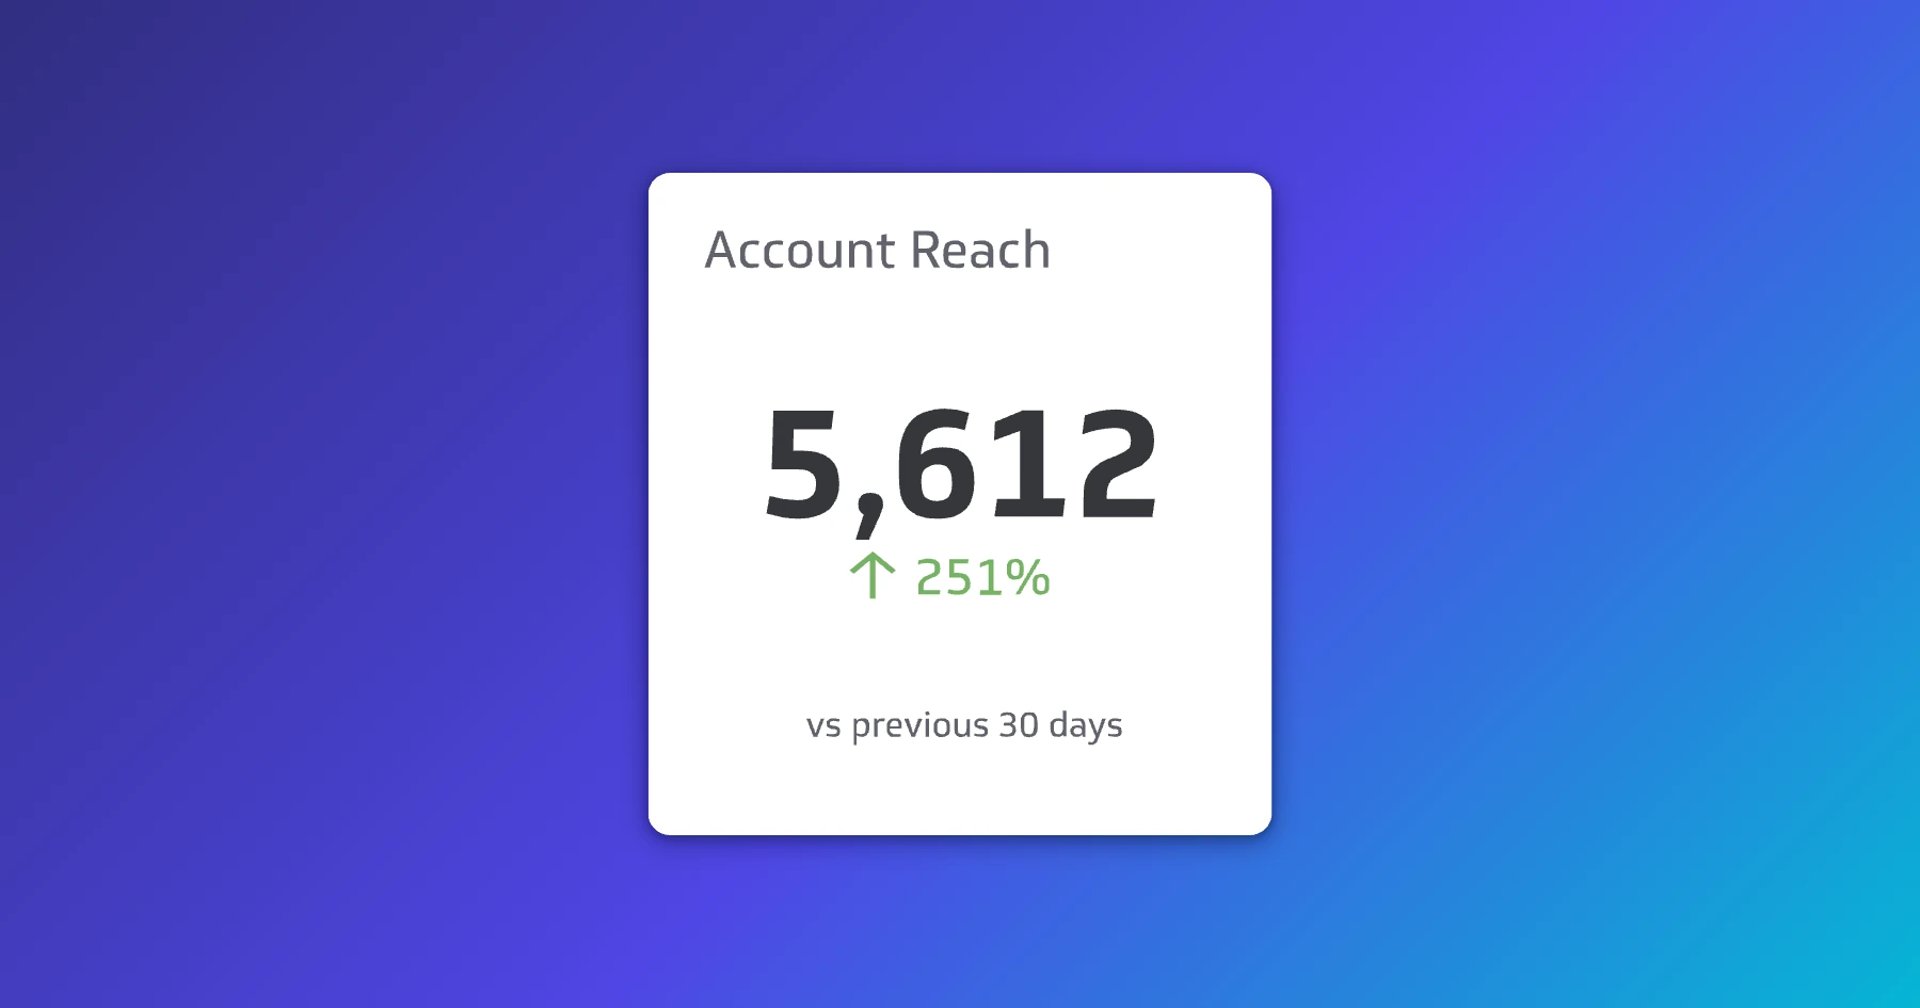
- Reach5.6k
What is Facebook engagement?
Facebook engagement measures how your audience interacts with the content you share, including likes, comments, shares, and clicks on your posts.
Why Facebook engagement metrics matter
Your Facebook engagement metrics tell you whether your content is landing with the right people. Low engagement is a signal: the message, format, or timing may need to change. High engagement means your audience is paying attention and responding.
For leaders running lean teams, checking engagement numbers manually or pasting post stats into a spreadsheet to figure out what's working wastes time you don't have. Consistent tracking against clear benchmarks lets you make faster calls about what to keep, cut, or double down on.
How to track Facebook engagement
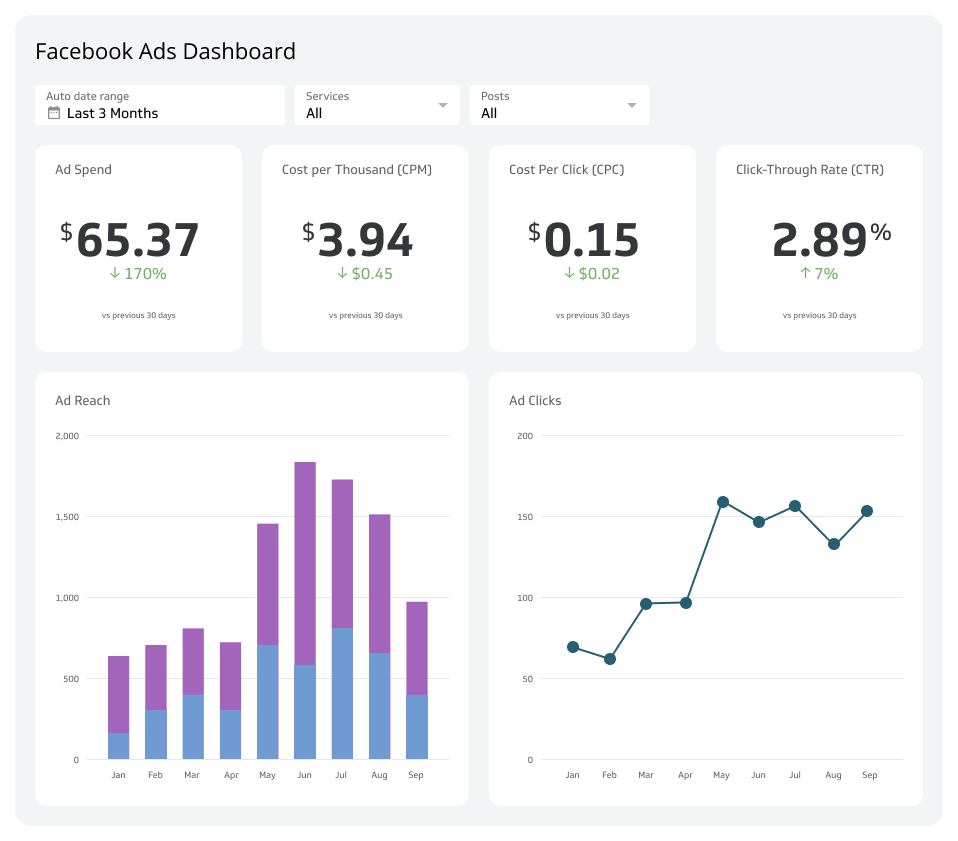
Track your Facebook engagement metrics on a dashboard. Once you've set benchmarks for your Facebook marketing strategy, monitor them alongside your other social media KPIs in one place.
When your Facebook engagement metrics are visualized on a dashboard, you can see at a glance which posts generate the most interaction and which content needs refinement, without digging through platform reports or waiting for someone to pull the numbers.
Facebook engagement metrics and how to measure them
Likes
Likes are the number of people who click the like button on your Facebook post. A high like count is a quick signal that your message resonates. Facebook users like posts they relate to or agree with, so likes are a useful measure of brand messaging impact.
Comments
Comments are the number of people who respond to your post in their own words. Comments require more effort than a like, which makes them a stronger signal of genuine interest. They also surface how your audience perceives your brand and the value you provide.
Clicks
Clicks are the number of times a user clicks on an image or link in your post, including photo views, video plays, and link clicks. Clicks are a direct measure of whether your content is prompting action.
Shares
Shares are the number of times your post has been shared by your audience. When someone shares your content, it extends your reach beyond your existing followers. Shares are an active engagement metric because the user has to choose to put your content on their own timeline. A like is passive; a share is an endorsement.
Post Reach
Post Reach is the number of unique accounts that saw your post. Reach tells you how far your content travelled, independent of how many people engaged with it. Tracking reach alongside engagement helps you understand whether low engagement is a distribution problem or a content problem.
Facebook engagement benchmarks
According to Hootsuite, the average engagement rate for Facebook posts is 0.18%. Use that as a baseline, not a ceiling. If your rate is below average, review your call to action or adjust your messaging. If it's above average, study what's working and replicate it. Consistent measurement turns engagement data into a reliable input for your content decisions, rather than a number you check once and forget.
Create custom dashboards for you and your team.
Get started with Klips