Sales Dashboard Examples
Sales dashboards show you how effectively your business generates revenue. Study KPIs to grow accounts, retain customers, and identify sales opportunities.
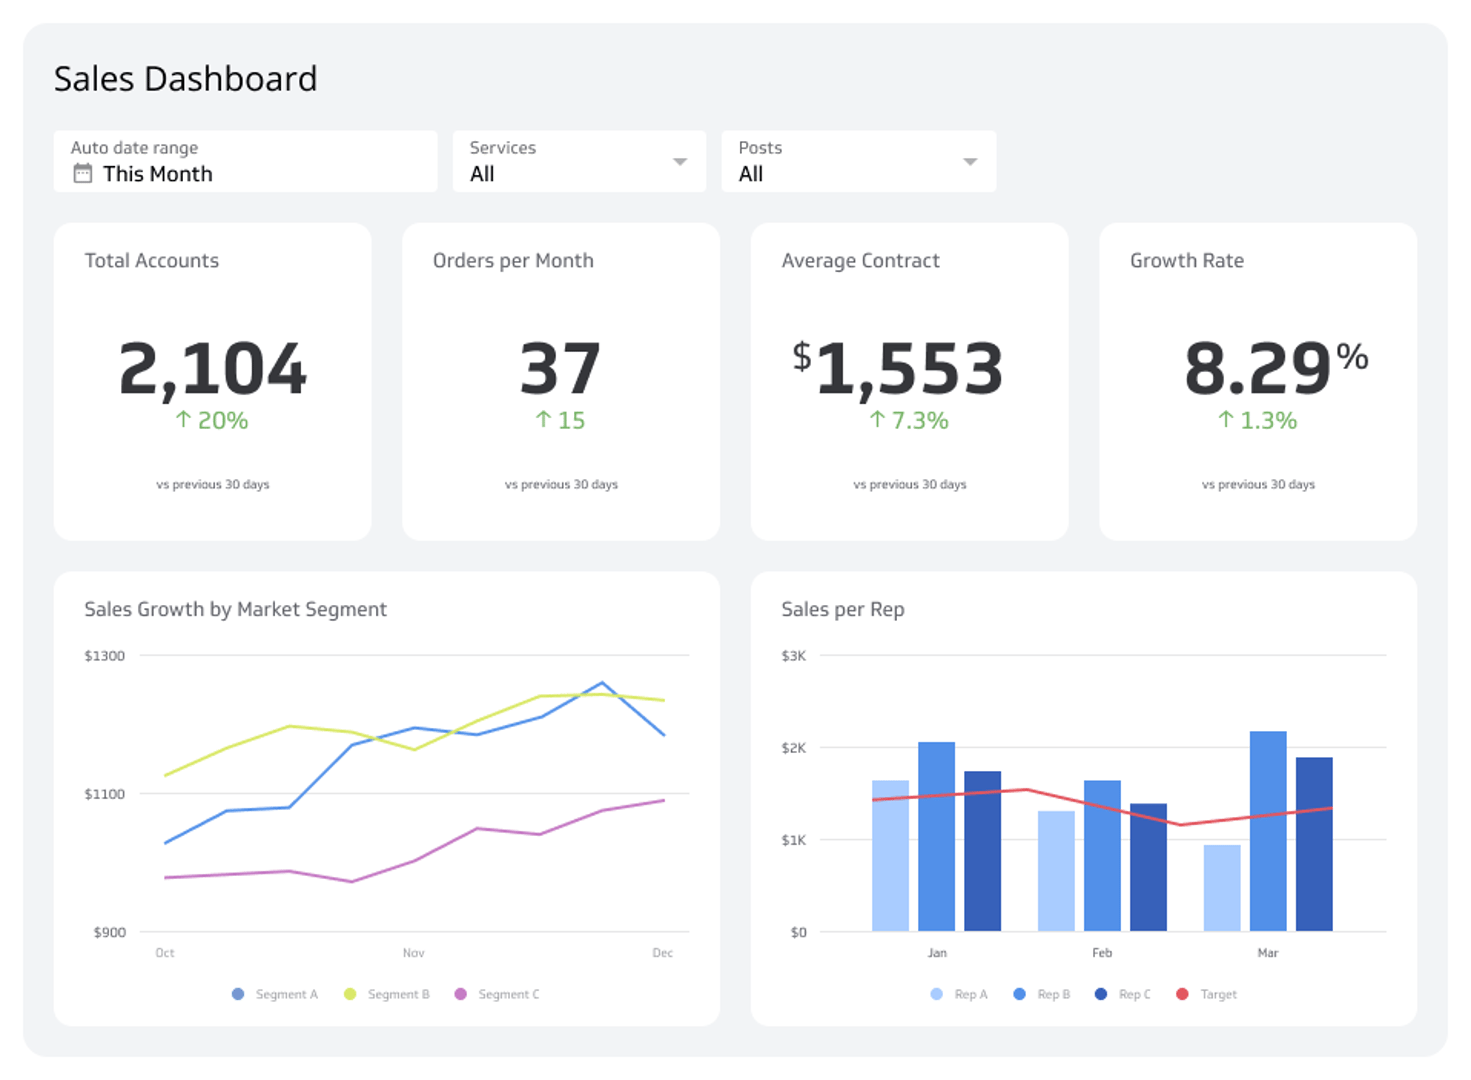
What is a Sales Dashboard?
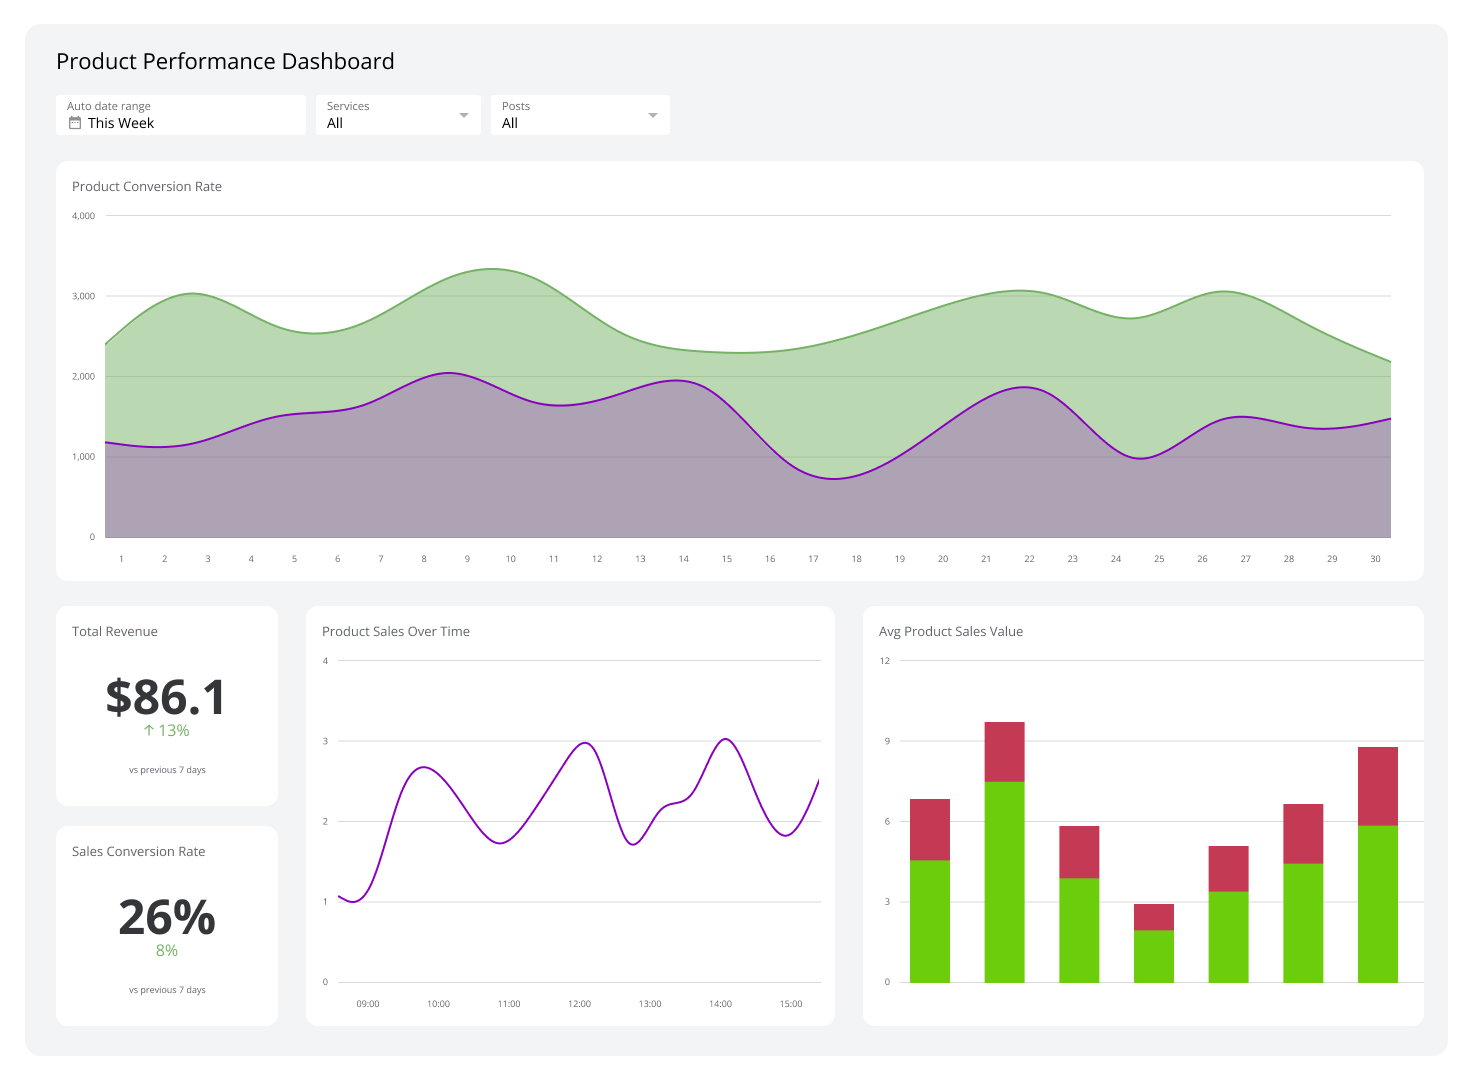
Sales dashboard is a tool designed to provide sales teams with a comprehensive, real-time view of their performance by visually displaying key sales metrics and data.
The dashboard provides an at-a-glance view of your sales team's performance. Sales teams operate in a fast-paced, target-oriented environment. Data-driven sales managers and reps closely monitor their individual and team performance on a daily basis so they can adjust or improve their strategies in real-time.
Sales Examples Dashboard Examples
View all dashboard examples- Sales Dashboard Examples
Sales Pipeline Dashboard
Tired of juggling spreadsheets and CRM reports? This article showcases 15 different sales pipeline dashboards designed to give you instant clarity on your sales process. Discover which KPIs and visualizations matter most for sales managers, executives, and reps, and learn how to turn raw sales data into your greatest asset for growth.

- Sales Dashboard Examples
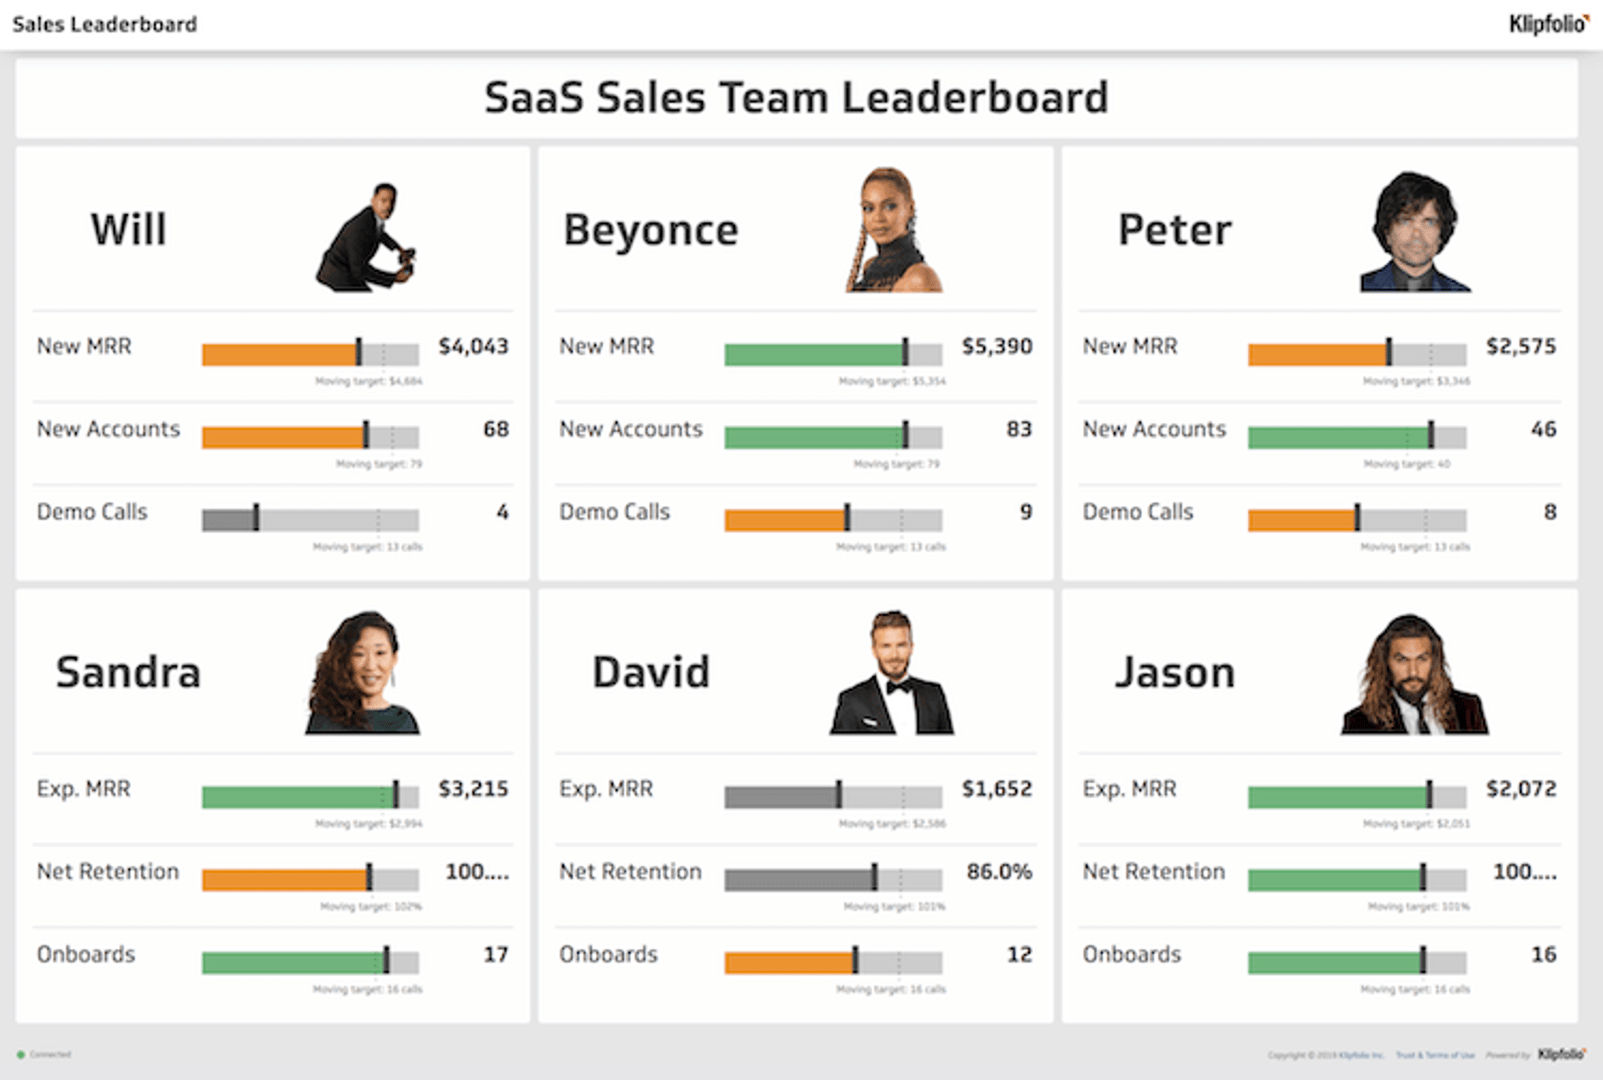
Sales Leaderboard
A sales leaderboard brings your key performance indicators into one clear, real-time view. This guide explains why a leaderboard is essential for motivating your team, how to build one step by step, and which sales metrics you should track to drive growth and foster a data-driven culture.
- Sales Dashboard Examples
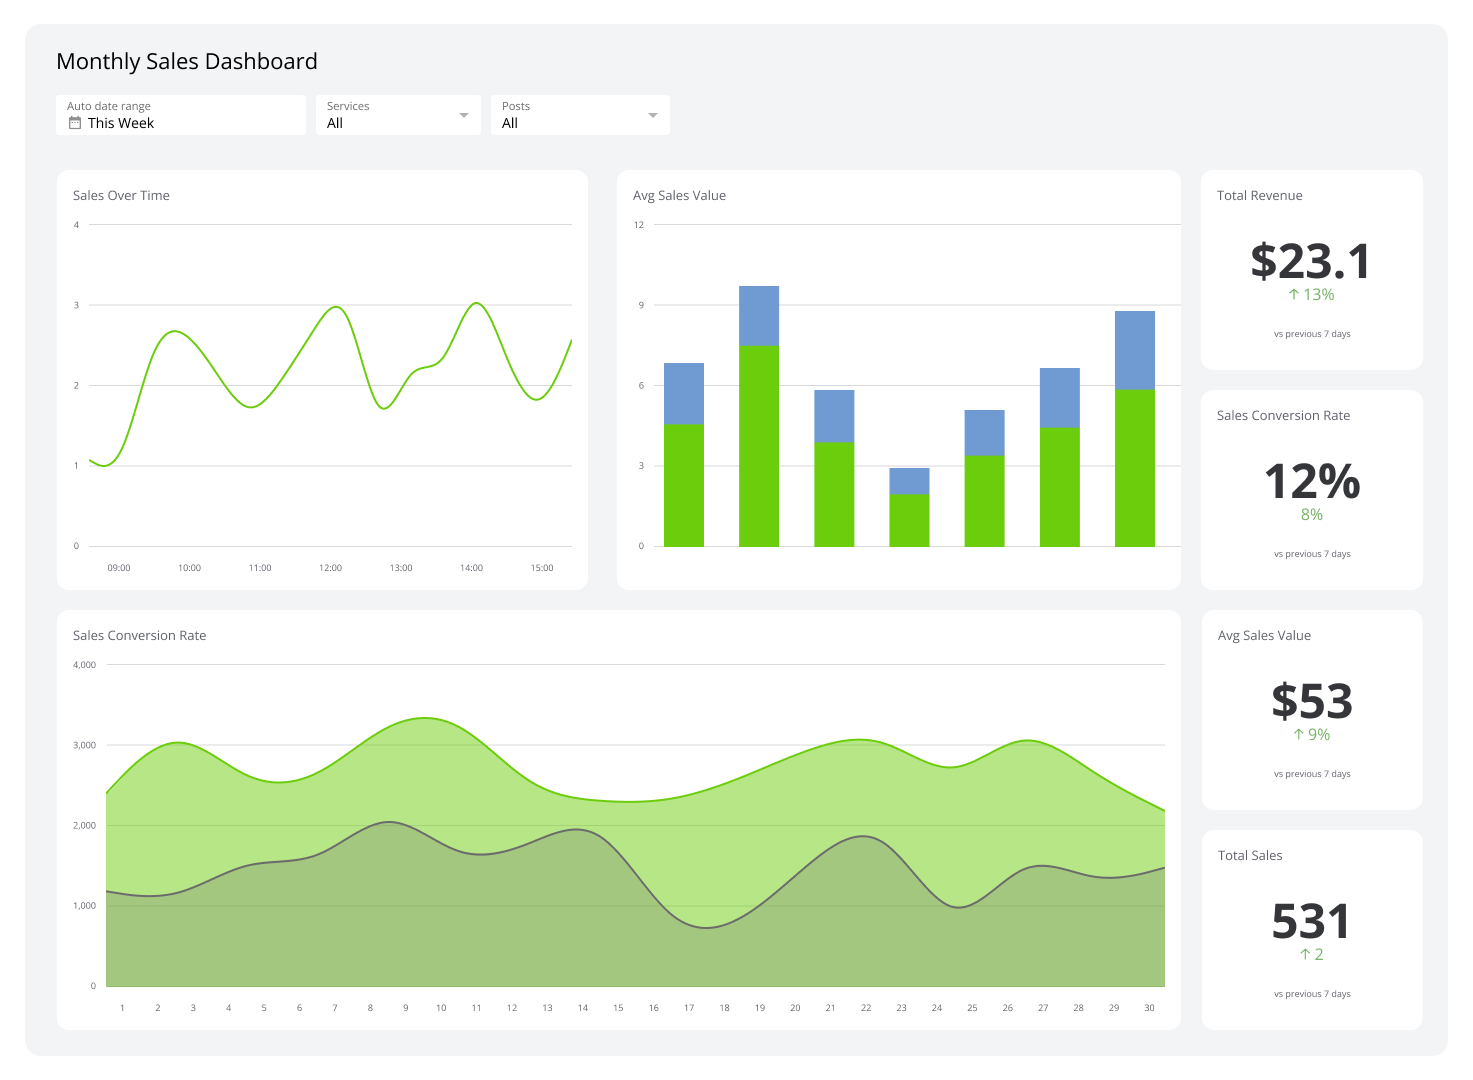
Monthly Sales Dashboard
Stop drowning in manual Excel reports. A monthly sales dashboard gives your team a transparent, real-time view of progress toward targets. This article shows you how to build a dashboard that tracks the metrics that matter — like new accounts, MRR this month, and daily sales — to align your team and make faster, data-driven decisions.
- Sales Dashboard Examples
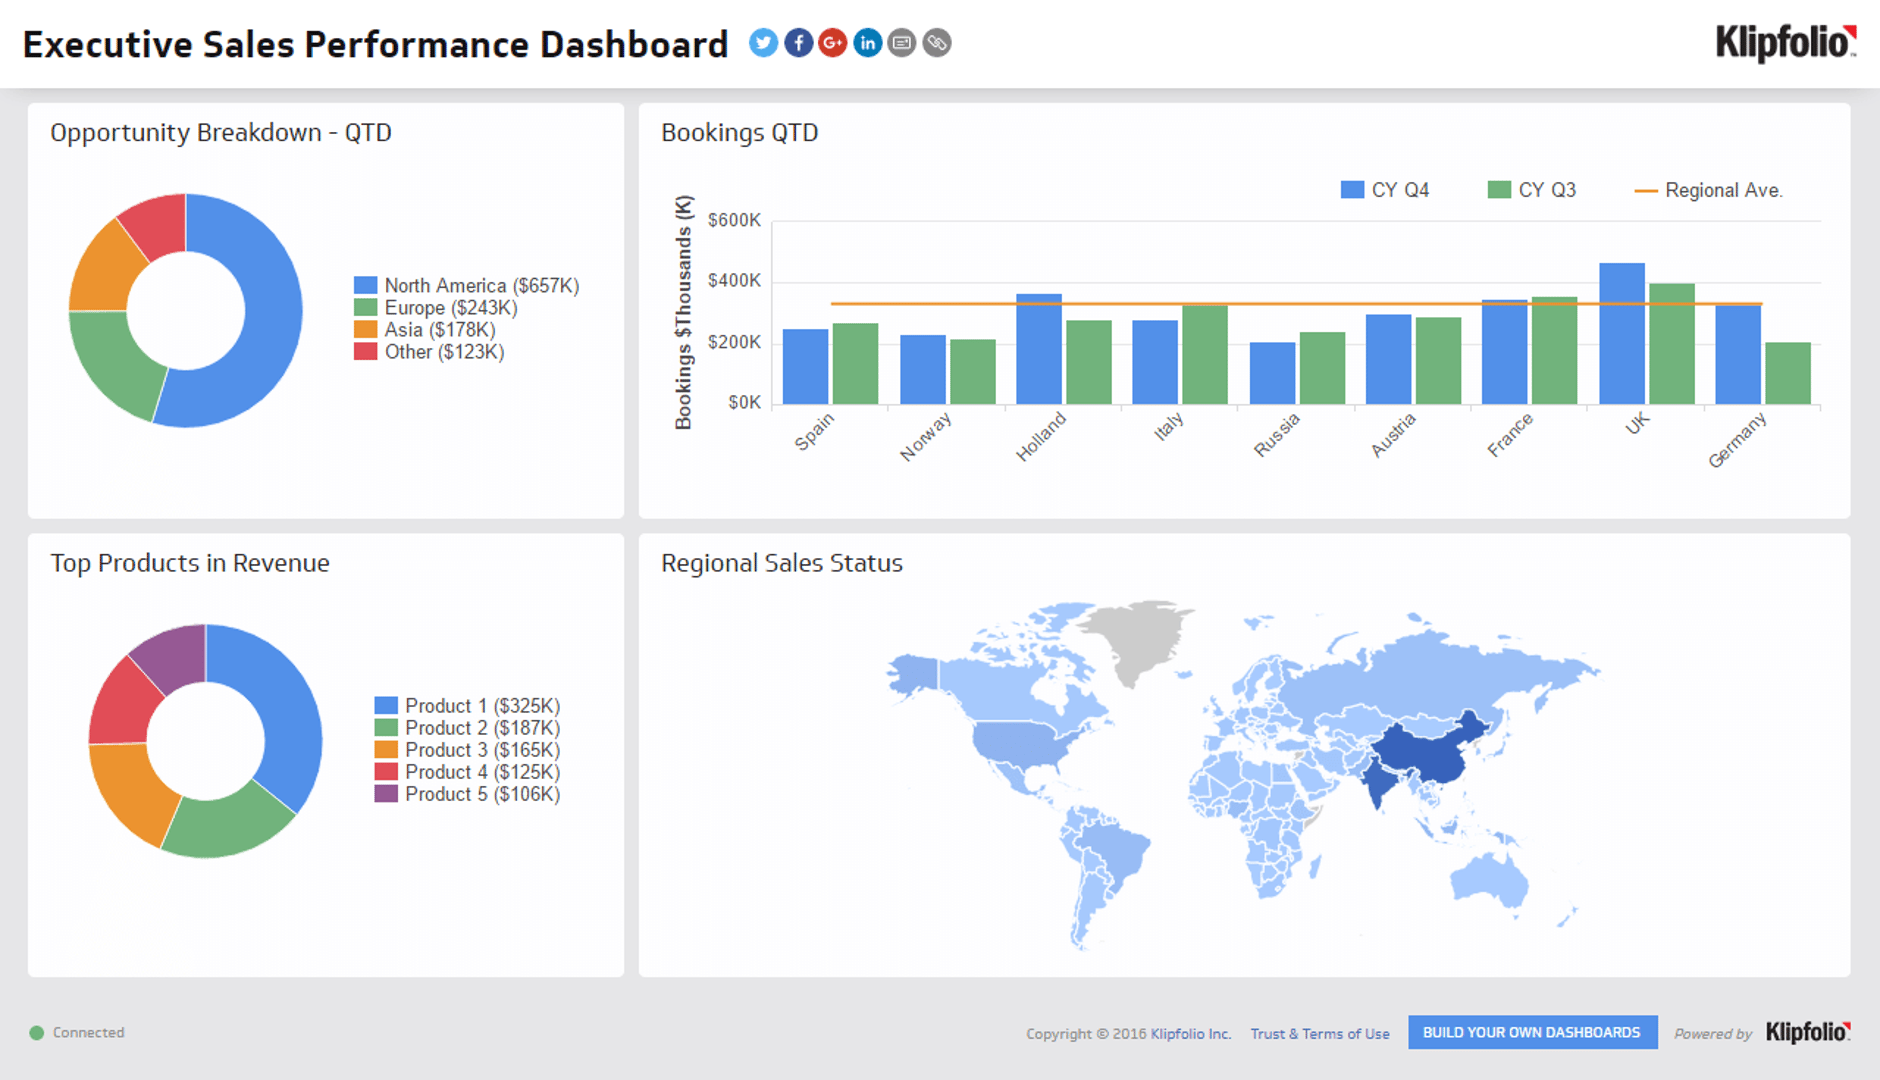
Sales Performance Dashboard
Is your sales data scattered across spreadsheets and different apps? A sales performance dashboard unifies your data, providing clear, real-time insights into team performance, revenue, and new opportunities. This guide breaks down everything you need to know, from the essential KPIs to track to the common mistakes to avoid. Read on to learn how to build a dashboard that empowers your team to make smarter, data-driven decisions.

Simplify sales data acquisition
A sales dashboard delivers sales metrics through visualizations like interactive charts and graphs. It simplifies the sales data acquisition process and provides the insights needed to boost revenue, improve customer retention, capitalize on opportunities, and see changes or trends in the marketplace.
Klipolifo’s customizable sales dashboards deliver accurate, real-time data. Try it for free today and better understand your sales efforts.
