
Call Center Dashboards
Call center dashboards display key metrics so you can track agent performance, manage call volume, and make confident decisions about your customer service operations.
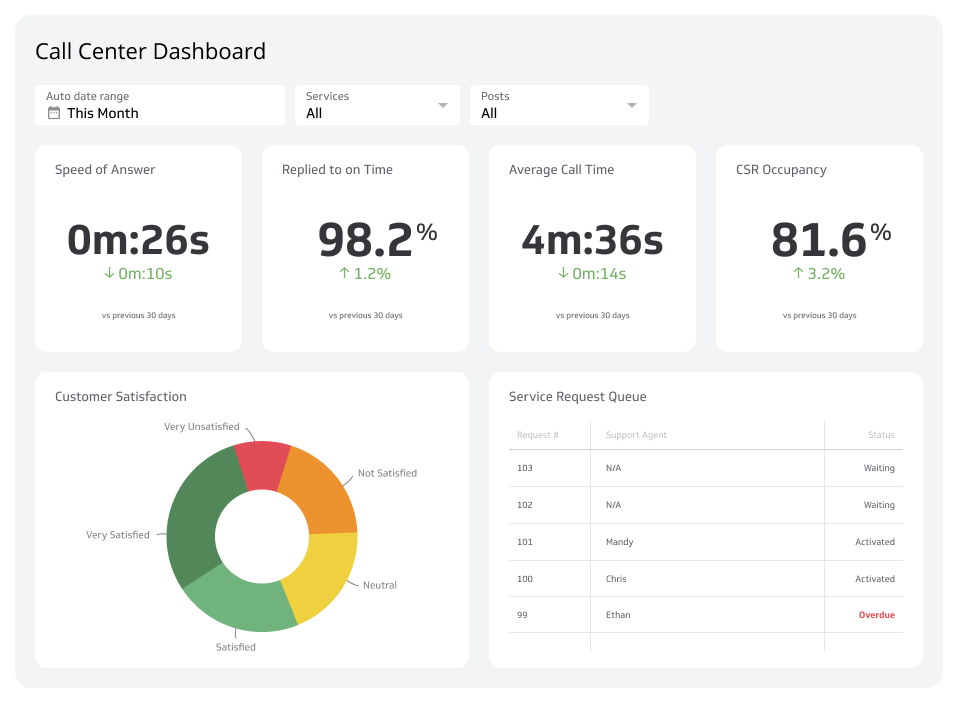
What is a call center dashboard?
A call center dashboard displays real-time call center data so you can see how your agents, teams, and operations are performing at a glance.
Track call center manager KPIs like Average Handle Time and First Call Resolution to understand how effectively your team resolves customer issues. Monitor operational metrics like current call volumes and average wait times to manage workload before it becomes a problem.
Call center dashboards also surface trends in customer inquiries, such as recurring complaints, so you can address root causes rather than react to symptoms. Some include visual alerts for critical issues, giving you confidence that nothing slips through unnoticed.
Examples of call center dashboards
Customer Satisfaction Dashboard
Customer Satisfaction Dashboards visualize feedback from customers about their service experiences. Metrics they track include Net Promoter Score (NPS), Customer Satisfaction Scores, Customer Effort Score, and First Call Resolution rates.
These dashboards help you identify patterns in customer feedback, such as recurring issues, common compliments, and areas needing improvement. That clarity makes it easier to prioritize resource allocation based on what customers are actually telling you, without having to pull data manually or paste numbers into a spreadsheet to find the answer.
| Who's it for | Call center managers, quality assurance teams, customer service representatives, team leaders, supervisors, training coordinators, business analysts, technical support teams, senior management, and reporting analysts |
|---|---|
| How often it's needed | Real-time, daily, weekly, monthly |
| Covered KPIs | Net Promoter Score (NPS), customer feedback trends, overall satisfaction ratings, First Call Resolution (FCR) rate, call resolution time, customer effort score, agent satisfaction ratings, customer retention rate, call escalation rate, repeat call rate, time to resolve complaints, service level adherence, call monitoring and quality scores, customer sentiment analysis, response time to feedback, percentage of positive/neutral/negative feedback, customer churn rate, resolution accuracy score, agent training effectiveness, customer loyalty index, interaction effectiveness, survey response rates, customer lifetime value (CLV), support ticket satisfaction, interaction channel efficiency, on-hold time |
Call Center Dashboard Examples
- Call Center
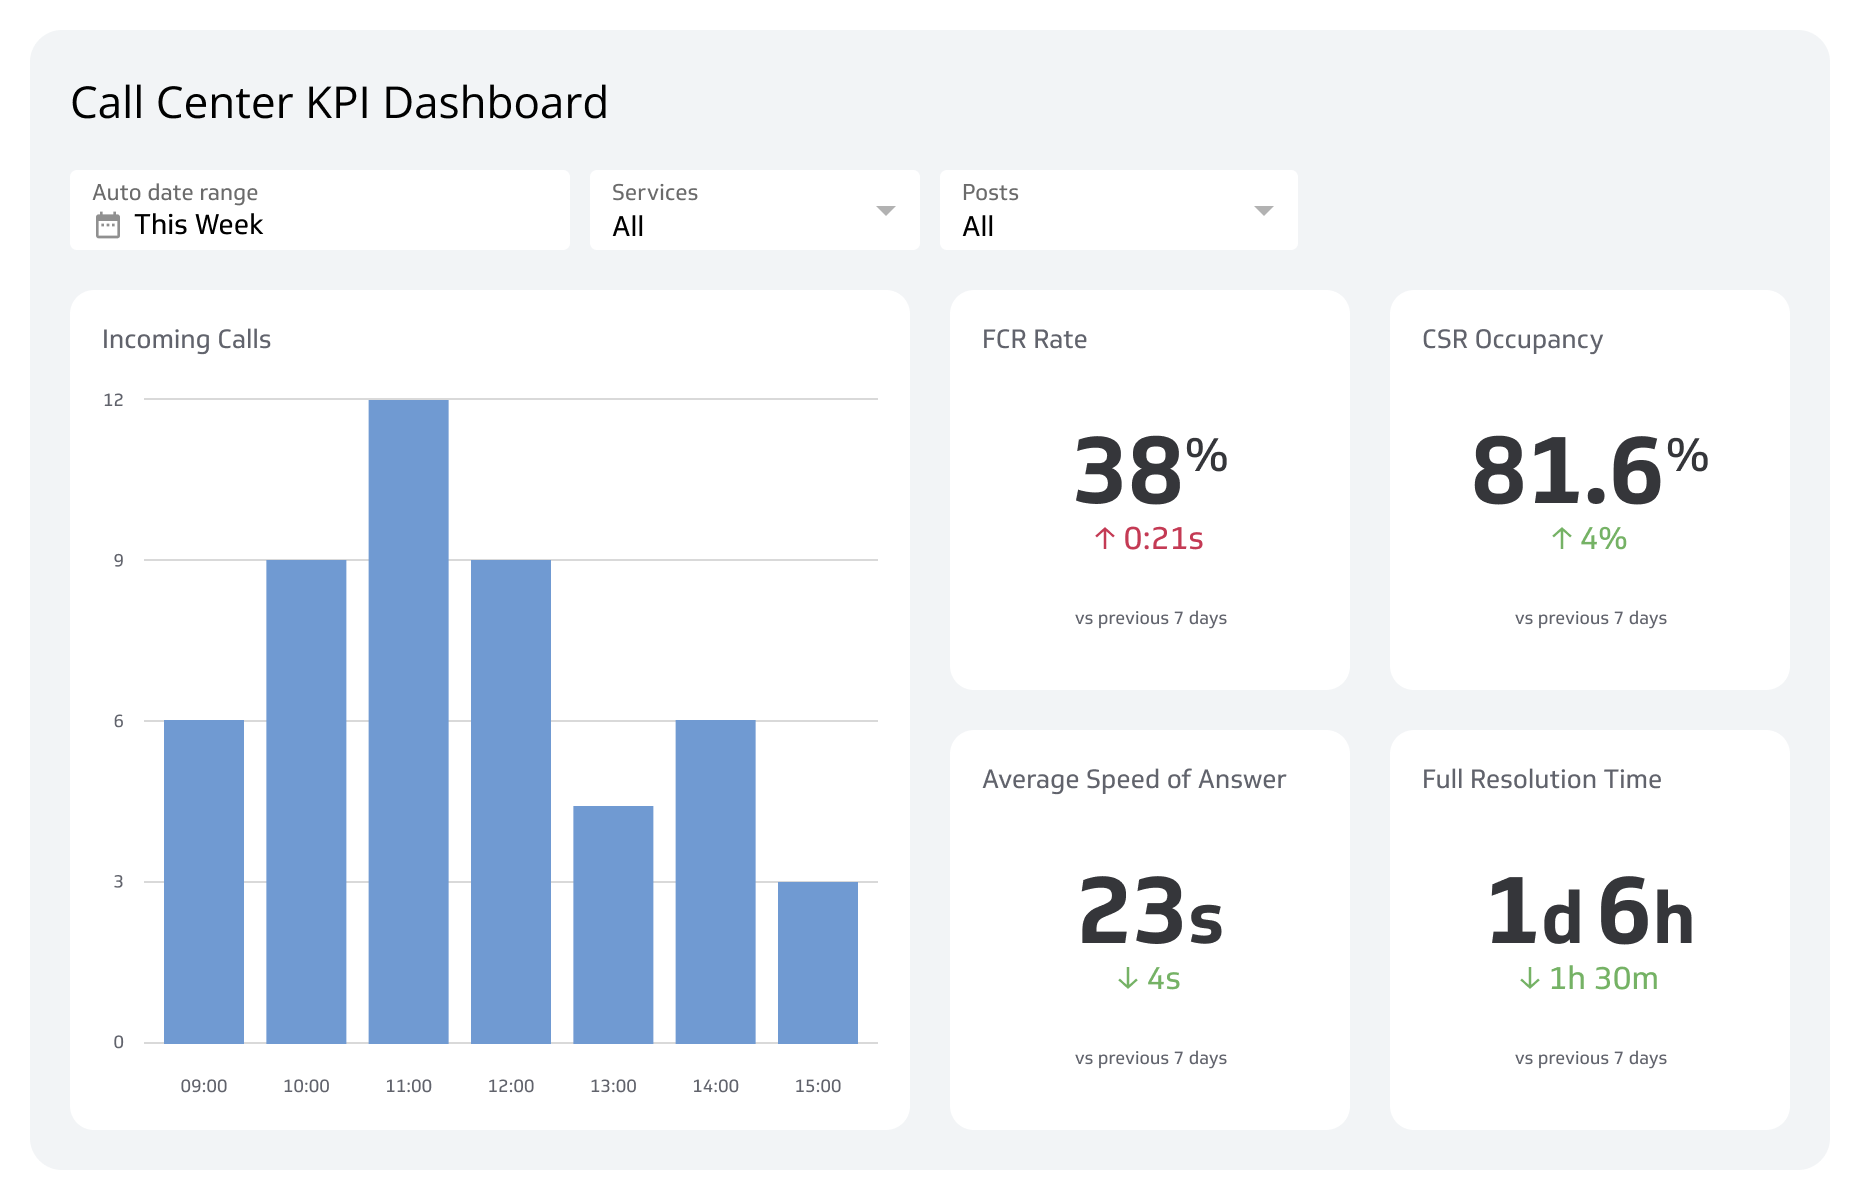
Call center KPI dashboard examples
A centralized, real-time view of the metrics that matter most, so call center managers can coach agents, manage volume, and act with confidence.
- Call Center
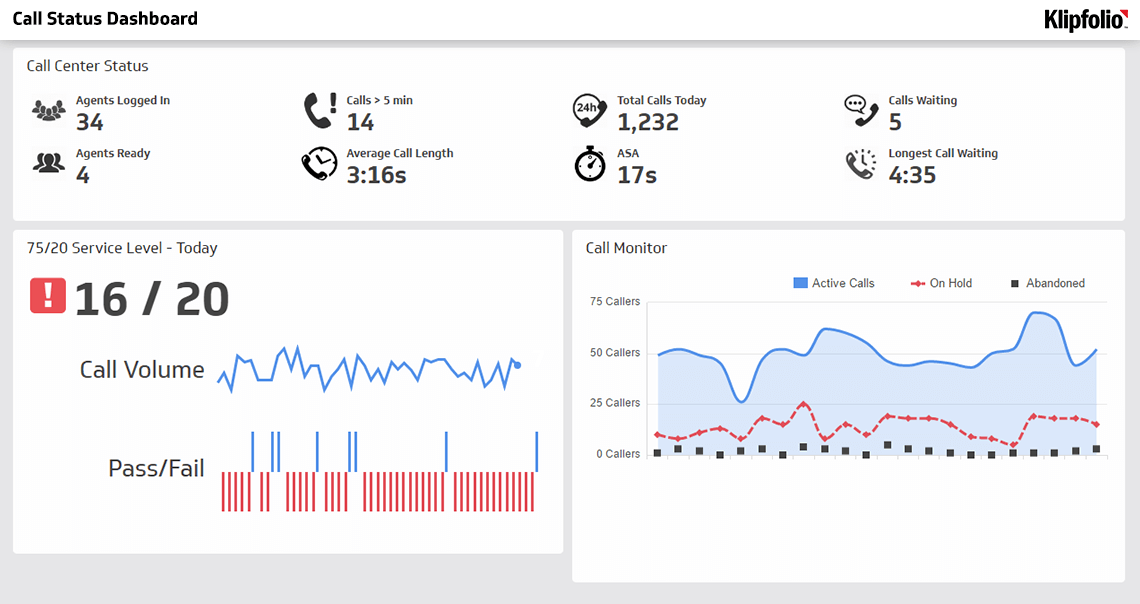
Call Status Dashboard
Your real-time command center for call center operations.
- Call Center
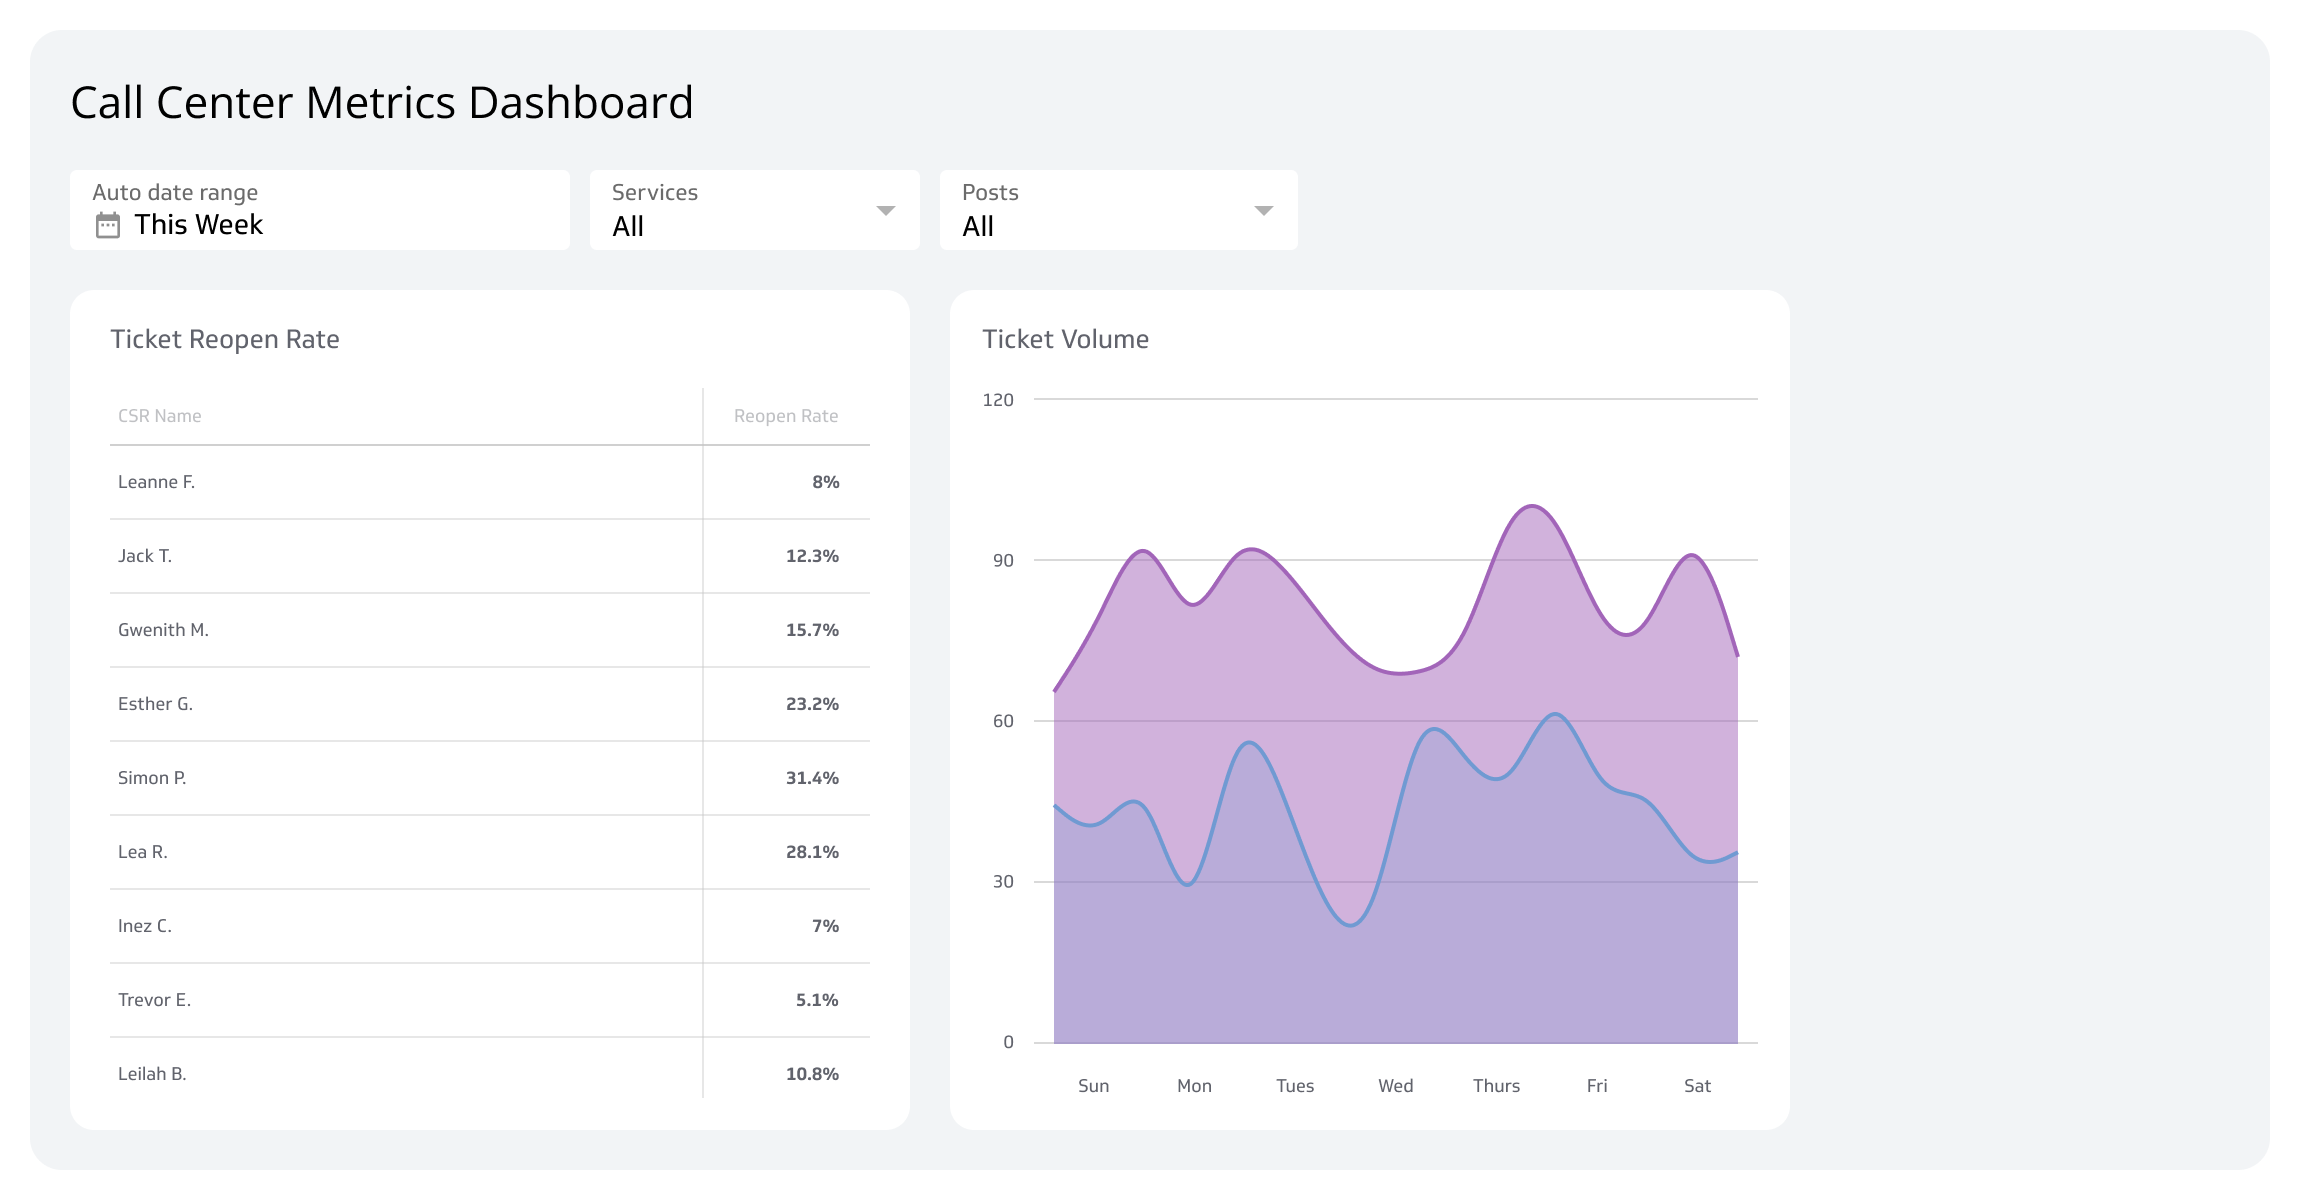
Call Center Metrics Dashboard
Track your team's performance and improve service in real time.
Call Escalation Dashboard
A Call Escalation Dashboard monitors instances where calls are elevated to higher levels of support. It provides live data on escalation reasons, escalation volume, and the time your team takes to resolve them.
Use this dashboard to spot patterns in frequent escalations and make targeted adjustments, whether that means refining agent training or updating escalation protocols. The goal is fewer surprises and faster decisions, not more time spent digging through call logs.
| Who's it for | Call center managers, customer service representatives, team leaders, supervisors, quality assurance teams, training coordinators, technical support teams, business analysts, reporting analysts, senior management |
|---|---|
| How often it's needed | Real-time, daily, weekly, monthly |
| Covered KPIs | Escalation rate, timeliness of issue resolution, FCR rate, agent escalation frequency, escalation outcome success rate, customer satisfaction post-escalation, escalation reason analysis, average handling time for escalations, tier-level escalation metrics, repeat escalation rate, resolution accuracy, customer effort score, agent performance in managing escalations, volume of escalations per team or department, escalation queue time, training effectiveness for escalation handling, escalation prediction score, adherence to escalation protocols, IT and system issues contributing to escalations, feedback from escalated calls, overall impact of escalations on service level agreements (SLAs), cost per escalation, impact of escalations on customer retention, and escalation reduction initiatives success rate |
Helpdesk Dashboard
Helpdesk dashboards show real-time data on open, pending, and resolved support tickets alongside KPIs like average resolution time and customer satisfaction score (CSAT).
With this view, you can prioritize agent tasks with confidence and quickly identify recurring issues, whether that's a system glitch, a common complaint, or a question your knowledge base should answer. You spend less time asking "what's going on?" and more time fixing it.
| Who's it for | Call center managers, team leaders, supervisors, customer service representatives, quality assurance teams, technical support teams, training coordinators, business analysts, reporting analysts, senior management |
|---|---|
| How often it's needed | Real-time, daily, weekly, monthly |
| Covered KPIs | Ticket resolution time, first response time, customer satisfaction score (CSAT), FCR rate, ticket backlog, average handle time (AHT), agent productivity metrics, ticket reopen rate, escalation rate, service level agreement (SLA) adherence, number of tickets by category, volume of tickets by channel (phone, email, chat), agent utilization rate, ticket aging, resolution accuracy, customer effort score (CES), agent training effectiveness, number of escalated tickets, feedback from resolved tickets, cost per ticket, impact of helpdesk on customer retention, automation effectiveness, ticket prioritization accuracy, team workload balance, and incident and problem management efficiency |
Create custom dashboards for you and your team.
Get started with KlipsAgent Performance Dashboard
Agent Performance Dashboards give you a clear view of individual and team productivity. They display real-time data on handling times and daily call volume per agent, alongside KPIs like First Call Resolution rates and CSAT scores that reflect the quality of each customer interaction.
If an agent consistently shows longer call handling times, this dashboard helps you determine whether the cause is a training gap, a process issue, or something else entirely, so you can act on the right thing rather than guess.
| Who's it for | Call center managers, supervisors, team leaders, customer service representatives, technical support teams, quality assurance teams, training coordinators, business analysts, reporting analysts, senior management |
|---|---|
| How often it's needed | Real-time, daily, weekly, monthly |
| Covered KPIs | AHT, FCR rate, CSAT score, call volume, call transfer rate, adherence to schedule, after-call work time, SLA compliance, call quality score, agent occupancy rate, agent availability, hold time per call, call abandonment rate, escalation rate, average speed of answer (ASA), agent attendance, ticket resolution time, call center shrinkage, agent turnover rate, coaching effectiveness score, agent utilization rate, training completion rates, peer feedback, customer feedback comments, performance scorecards, cross-selling and upselling success rates, agent engagement metrics, and overall contribution to team goals |
Customer Retention Dashboard
Customer Retention Dashboards measure customer loyalty and flag early signs of dissatisfaction before they become churn. They track retention rates, churn rates, and the effectiveness of retention initiatives in one place.
When the data shows rising churn or declining engagement, you know it's time to initiate follow-up calls or strengthen loyalty programs, rather than finding out after customers have already left. That's the difference between managing retention and reacting to it.
| Who's it for | Call center managers, technical support teams, supervisors, senior management, customer service representatives, team leaders, reporting analysts, business analysts, training coordinators, quality assurance teams |
|---|---|
| How often it's needed | Real-time, daily, weekly, monthly |
| Covered KPIs | Customer churn rate, customer lifetime value (CLV), repeat call ratio, FCR rate, CSAT score, NPS, AHT, retention rate by customer segment, follow-up call rates, win-back rates, SLA compliance, agent performance impact on retention, cost per retained customer, customer feedback comments, loyalty program participation rates, account issue resolution time, escalation rate, customer complaint resolution rate, proactive service interaction rate, customer tenure length, retention campaign effectiveness, impact of retention training programs, customer communication preferences, agent training completion rates, customer exit survey scores, and overall customer happiness index |
Call Volume Analysis Dashboard
Call Volume Analysis Dashboards track the number of calls made and received across different timeframes. They surface peak hour traffic, average call durations, and volume fluctuations, giving you the information you need to staff appropriately and allocate resources where they're most needed.
These dashboards also reveal patterns like seasonal spikes or sudden surges that may signal an underlying issue or an active promotion. Knowing what's driving volume lets you plan ahead instead of scrambling to respond.
| Who's it for | Call center managers, supervisors, team leaders, workforce management teams, reporting analysts, business analysts, senior management, technical support teams, quality assurance teams |
|---|---|
| How often it's needed | Real-time, daily, weekly, monthly |
| Covered KPIs | Total call volume, peak hour traffic, dial per hour, call distribution by day of the week, service level, average wait time, call abandonment rate, average handle time (AHT), average speed of answer, call queue length, call distribution by agent, call transfer rate, first call resolution rate, repeat call rate, call duration trends, inbound vs. outbound call ratios, call variance compared to forecast, agent occupancy rate, adherence to scheduling, call center traffic patterns, customer satisfaction scores, call source analysis, percentage of calls handled by interactive voice response (IVR) systems, call drop rate, call quality scores, agent workload distribution, and impact of marketing campaigns on call volume |
Call Quality Monitoring Dashboard
A Call Quality Monitoring Dashboard evaluates the quality of customer interactions by tracking metrics like call resolution rates, CSAT scores, call quality scores, and adherence to call scripts or protocols.
Use this dashboard to identify quality issues, such as long hold times or inconsistent communication, before they erode the customer experience. Reliable, consistent data here means you can coach with confidence rather than relying on gut feel.
| Who's it for | Call center managers, supervisors, team leaders, quality assurance teams, training and development specialists, senior management, customer experience managers, reporting analysts |
|---|---|
| How often it's needed | Real-time, daily, weekly, monthly |
| Covered KPIs | Call quality scores, customer satisfaction ratings, first call resolution rates, average handle time (AHT), call compliance scores, agent performance scores, call monitoring frequency, call sentiment analysis, customer feedback and comments, issue resolution times, agent adherence to scripts, call escalation rates, training needs identification, call recording and review frequency, customer effort score (CES), call outcome analysis, agent coaching effectiveness, quality assurance pass rates, root cause of call escalations, customer churn rate linked to call quality, call auditing results, agent empathy scores, compliance with regulatory standards, post-call survey results, customer complaint trends, and overall service quality index |
First-Call Resolution Dashboard
First-Call Resolution Dashboards measure how effectively your team resolves customer issues on the first contact. They track FCR rates and the percentage of inquiries addressed without follow-up calls or escalations.
Declining FCR rates or rising repeat call ratios are early signals that something in your resolution process needs attention. This dashboard gives you the data to act on those signals quickly, whether through targeted training or refined procedures, without waiting for someone to pull a report.
| Who's it for | Call center managers, technical support teams, supervisors, senior management, customer service representatives, team leaders, reporting analysts, business analysts, training coordinators, quality assurance teams |
|---|---|
| How often it's needed | Real-time, daily, weekly, monthly |
| Covered KPIs | FCR rate, repeat call ratio, issue resolution time, call transfer rates, CSAT score, NPS, AHT, escalation rate, agent performance impact on FCR, cost per resolved issue, customer feedback comments, training program effectiveness, SLA compliance, proactive service interaction rate, customer engagement metrics, customer complaint resolution rate, agent training completion rates, root cause analysis of unresolved issues, customer issue complexity, first contact resolution ratio by customer segment, time-saving techniques effectiveness, customer exit survey scores, overall efficiency index |
Agent Utilization Dashboard
An Agent Utilization Dashboard shows how agent time is distributed across customer interactions. It tracks occupancy rates, call handling times, and workload distribution so you can see where capacity is being used well and where it isn't.
Prolonged idle times or extended handling durations show up here before they become staffing problems. That visibility supports better scheduling decisions and keeps service quality consistent without burning out your team.
| Who's it for | Call center managers, technical support teams, supervisors, senior management, customer service representatives, team leaders, reporting analysts, business analysts, training coordinators, quality assurance teams |
|---|---|
| How often it's needed | Real-time, daily, weekly, monthly |
| Covered KPIs | Agent occupancy rate, idle time, AHT, number of calls handled per agent, call transfer rates, CSAT score, NPS, adherence to schedule, after-call work time, agent performance scores, workload balance, SLA compliance, agent satisfaction rates, training program effectiveness, break adherence, call resolution time, average speed of answer (ASA), agent absenteeism rate, customer feedback comments, call abandonment rate, agent interaction quality score, workforce scheduling efficiency, agent engagement metrics, overtime hours, overall efficiency index |
Create custom dashboards for you and your team.
Get started with KlipsCall center data you can trust
Call center dashboards replace manual data-pulling with automated, always-current metrics displayed in charts, graphs, and tables. When the numbers refresh automatically and everyone is looking at the same source, decisions get faster and more consistent.
That consistency matters more than it might seem. A small team running on reliable numbers makes better calls than a larger team arguing over which spreadsheet is correct. You spend less time chasing data and more time acting on it.
Klipfolio's customizable dashboards give you everything you need to track your call center's metrics and KPIs. Try it out today!