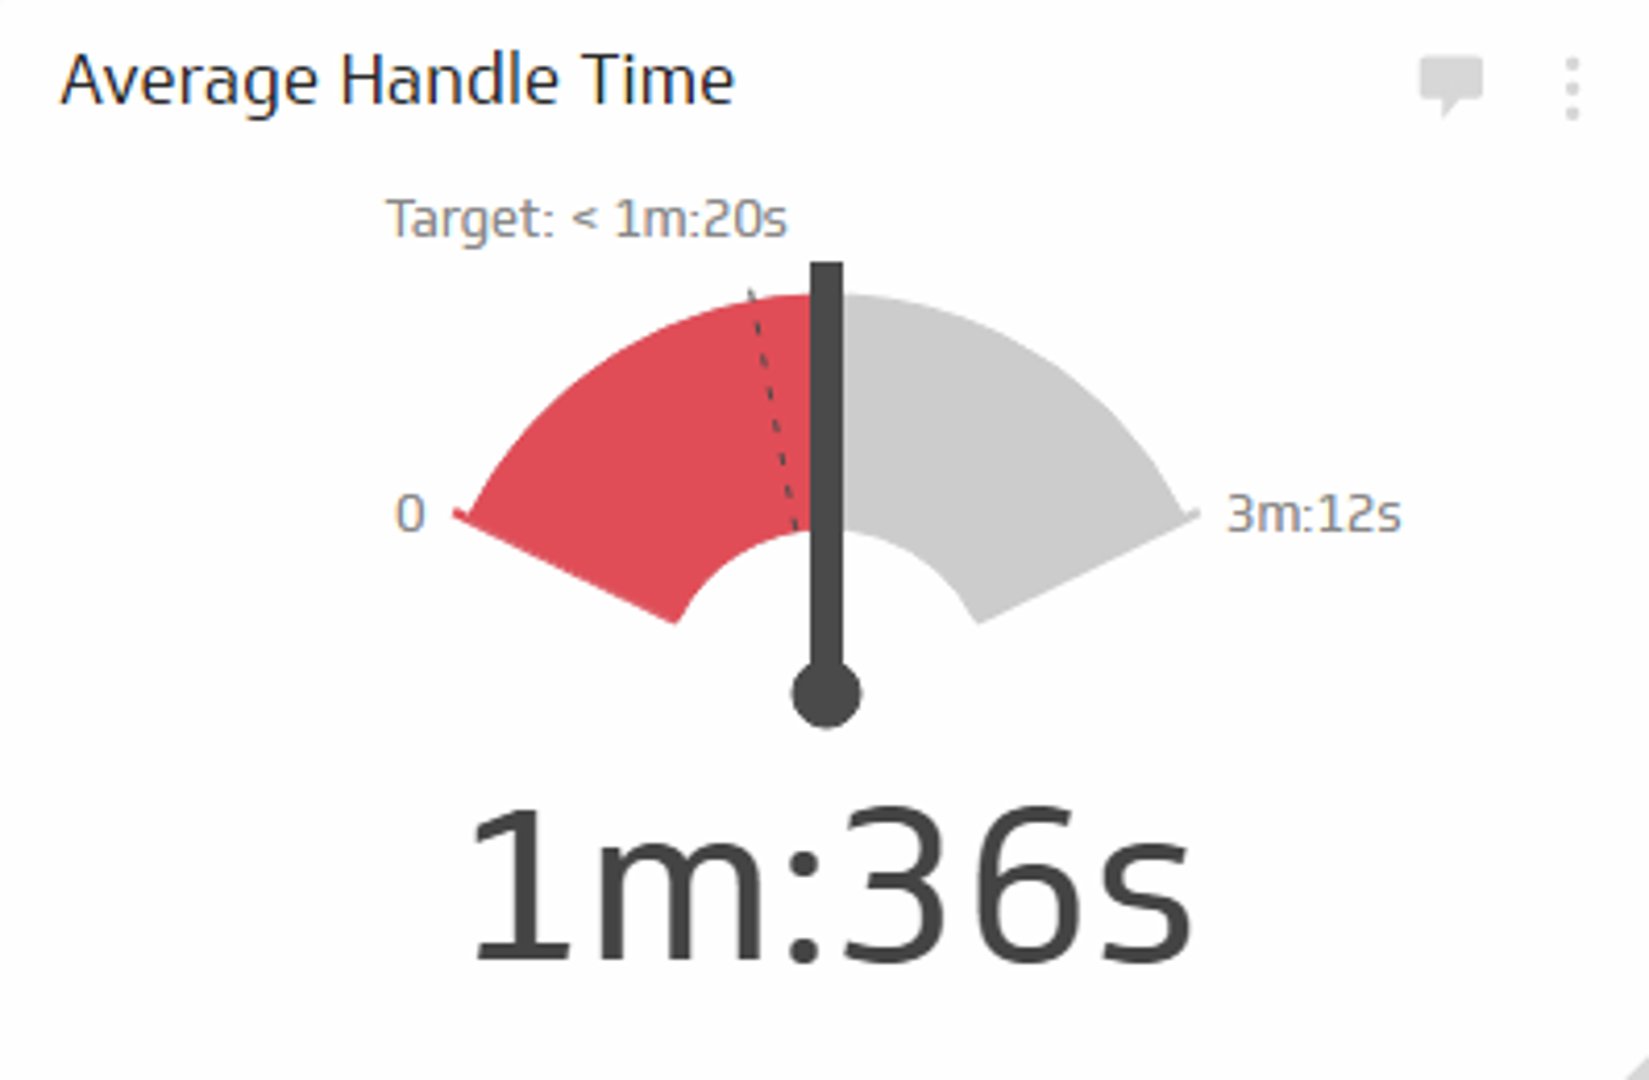
Average Handle Time Metric
Measures the average duration of each customer interaction, including talk time, hold time, and after-call work.
Track all your Call Center KPIs in one place
Sign up for free and start making decisions for your business with confidence.
Overview
Average Handle Time (AHT) measures the average duration of each customer interaction, including talk time, hold time, and after-call work such as notes or follow-ups. It's a key metric for evaluating how efficiently agents handle contacts and how well your call center manages its workload.
AHT helps you understand agent productivity and operational efficiency. However, it's important to balance speed with quality—a lower AHT doesn't always mean better service if it comes at the cost of customer satisfaction or first-contact resolution.
Average Handle Time formula
Average Handle Time = Total Handle Time / Total Number of Calls
Where:
- Total Handle Time = Sum of all call durations (including talk time, hold time, and after-call work)
- Total Number of Calls = Total number of calls handled in the period
Example: If your call center handled 500 calls with a combined handle time of 2,500 minutes, your AHT would be 5 minutes per call.
Why Average Handle Time matters
Call centers operate under constant pressure to balance speed with service quality. AHT gives you visibility into whether your team is handling calls efficiently or if bottlenecks are slowing things down.
Key reasons to track AHT:
- Agent productivity: Identifies whether agents are working at optimal pace or need coaching
- Staffing decisions: Helps forecast how many agents you need based on call volume and target AHT
- Cost control: Shorter handle times reduce labour costs per contact, directly affecting your bottom line
- Customer experience: Very long handle times may indicate complex issues or inefficient processes; very short times may signal rushed interactions
- Benchmarking: Compare your AHT against industry standards and competitors to identify improvement opportunities
What is a good Average Handle Time?
Industry benchmarks vary by sector, but typical AHT ranges are:
- Customer service: 4–6 minutes
- Technical support: 8–12 minutes
- Sales: 6–10 minutes
- Collections: 5–8 minutes
Your target AHT should reflect your business model, customer expectations, and service complexity. A financial services call center handling complex account issues will naturally have a higher AHT than a simple order-status inquiry line.
How to improve Average Handle Time
Reducing AHT without sacrificing quality requires a strategic approach:
- Agent training: Equip agents with product knowledge and soft skills to resolve issues faster
- Better tools: Implement systems that reduce manual data entry and improve access to customer information
- Process optimization: Streamline call flows and eliminate unnecessary steps
- Knowledge management: Create quick-reference guides and FAQs agents can access during calls
- Call routing: Use intelligent routing to match calls with the best-equipped agents
- Monitor trends: Track AHT by agent, department, and call type to identify where improvements are needed most
Related Call Center KPIs
AHT works best when tracked alongside other call center metrics. Consider monitoring these together:
- Service Level: Percentage of calls answered within your target time. AHT affects how many calls your team can handle within service level targets.
- Customer Satisfaction (CSAT): Measure of customer satisfaction. Balance AHT improvements with CSAT to avoid quality erosion.
- Abandonment Rate: Percentage of calls disconnected before reaching an agent. Long AHT can contribute to higher abandonment if it creates longer wait times.
Track Average Handle Time on a dashboard
Once you've established benchmarks and targets for AHT, set up processes to monitor it consistently. Real-time dashboards let you track AHT by agent, team, and time period—and spot trends before they become problems.
A call center dashboard displaying AHT alongside related metrics like service level, resolution rate, and CSAT gives you a complete picture of performance. You can drill down to identify which agents or departments need support, and adjust staffing or processes in real time.
Explore call center dashboard examples to see how leading call centers visualize and monitor AHT and other critical KPIs.