Smart dashboardsthat look amazing.
Klips gives you the flexibility and power to build dashboards that look sharp, perform flawlessly, and communicate with confidence.


Limitless design options.
With full control over layout and style, Klips lets you build the dashboards you dream of—no rigid rules, no compromises.
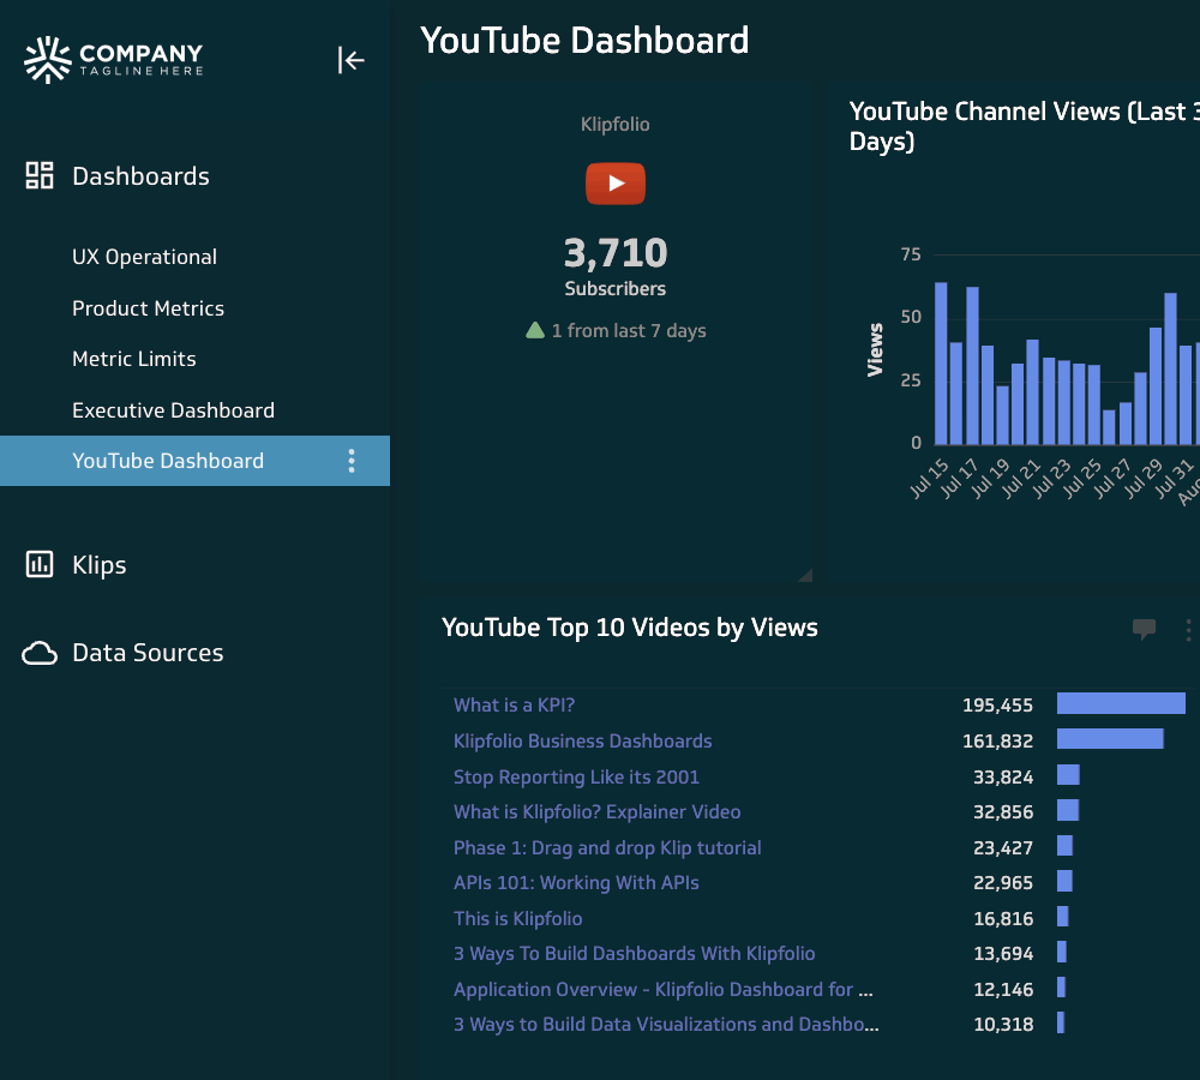
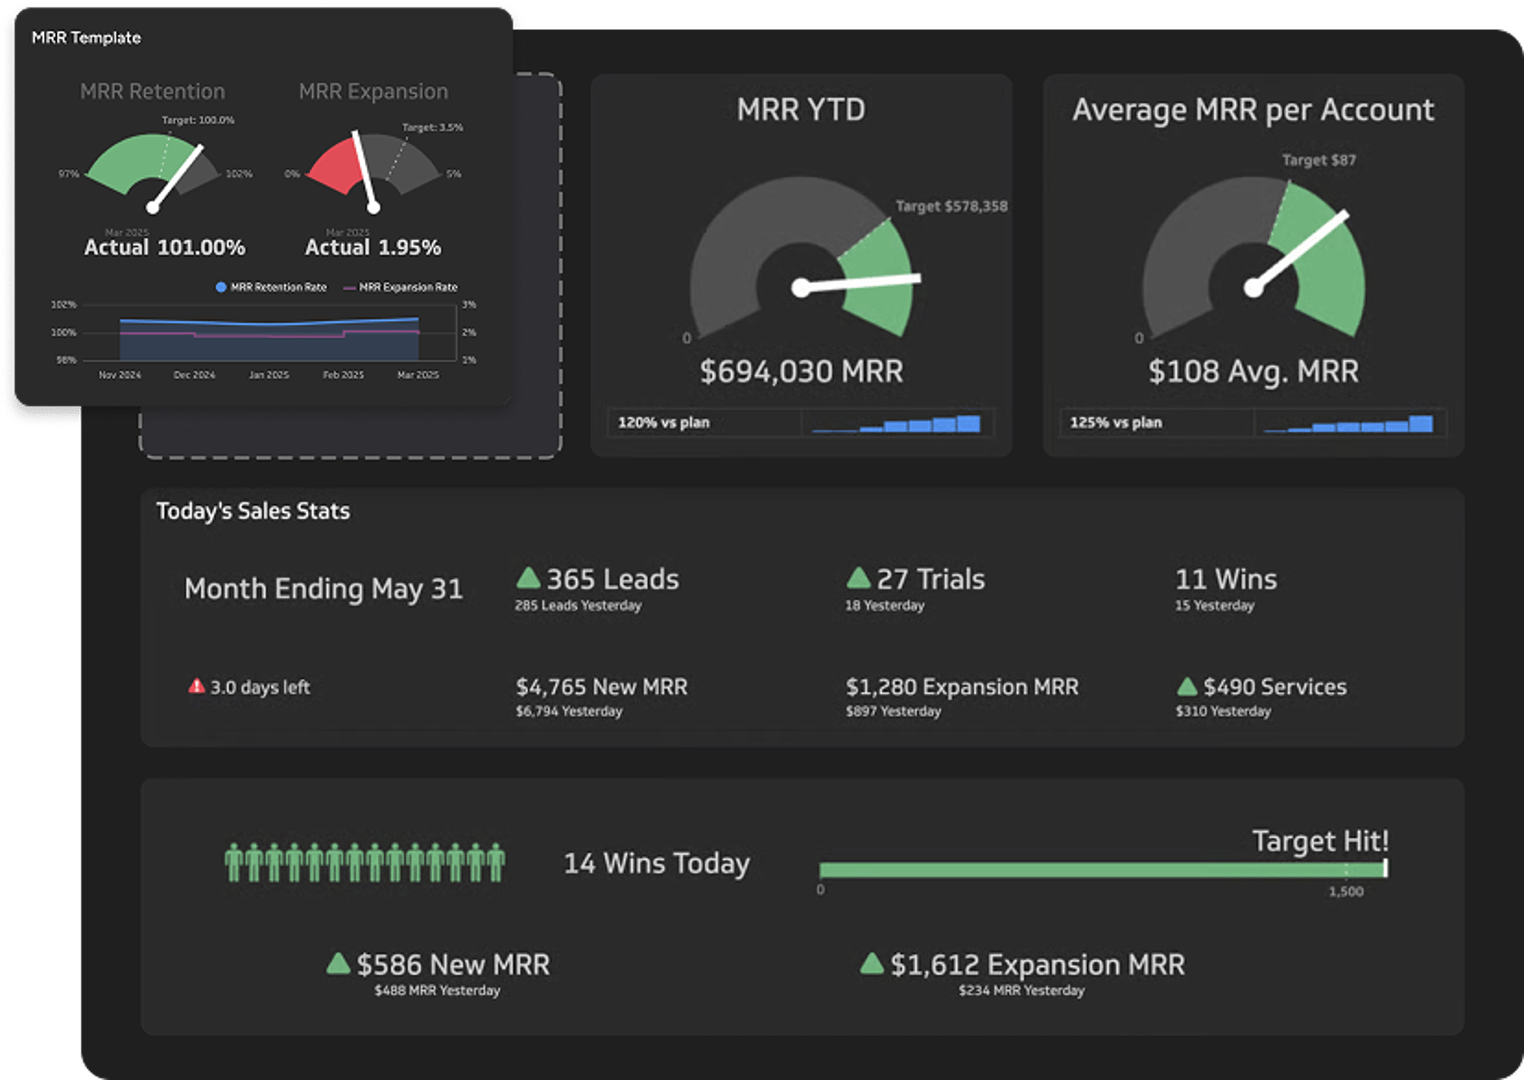
Your dashboard, your brand
Create dashboards that look and feel like a natural extension of your brand. Add logos, match colours, and adjust styling to reflect your company or client’s personality.
Your dashboard, your brand
Create dashboards that look and feel like a natural extension of your brand. Add logos, match colours, and adjust styling to reflect your company or client’s personality.
Drag-and-drop builder
Build Klips intuitively with grids and drop-in visualizations. Assemble dashboards quickly and precisely by moving, resizing, and aligning Klips.
Grid and free-form layout options
Klips includes several grid layouts for fast, structured design. Looking to unleash your creativity? Our free-form layout options bring out the designer in all of us. They’re also perfect for building more complex, custom dashboards.

Visualizations for every occasion.
With 30+ chart types to choose from and almost-limitless customization options, you’re sure to find the perfect visualization for every situation.
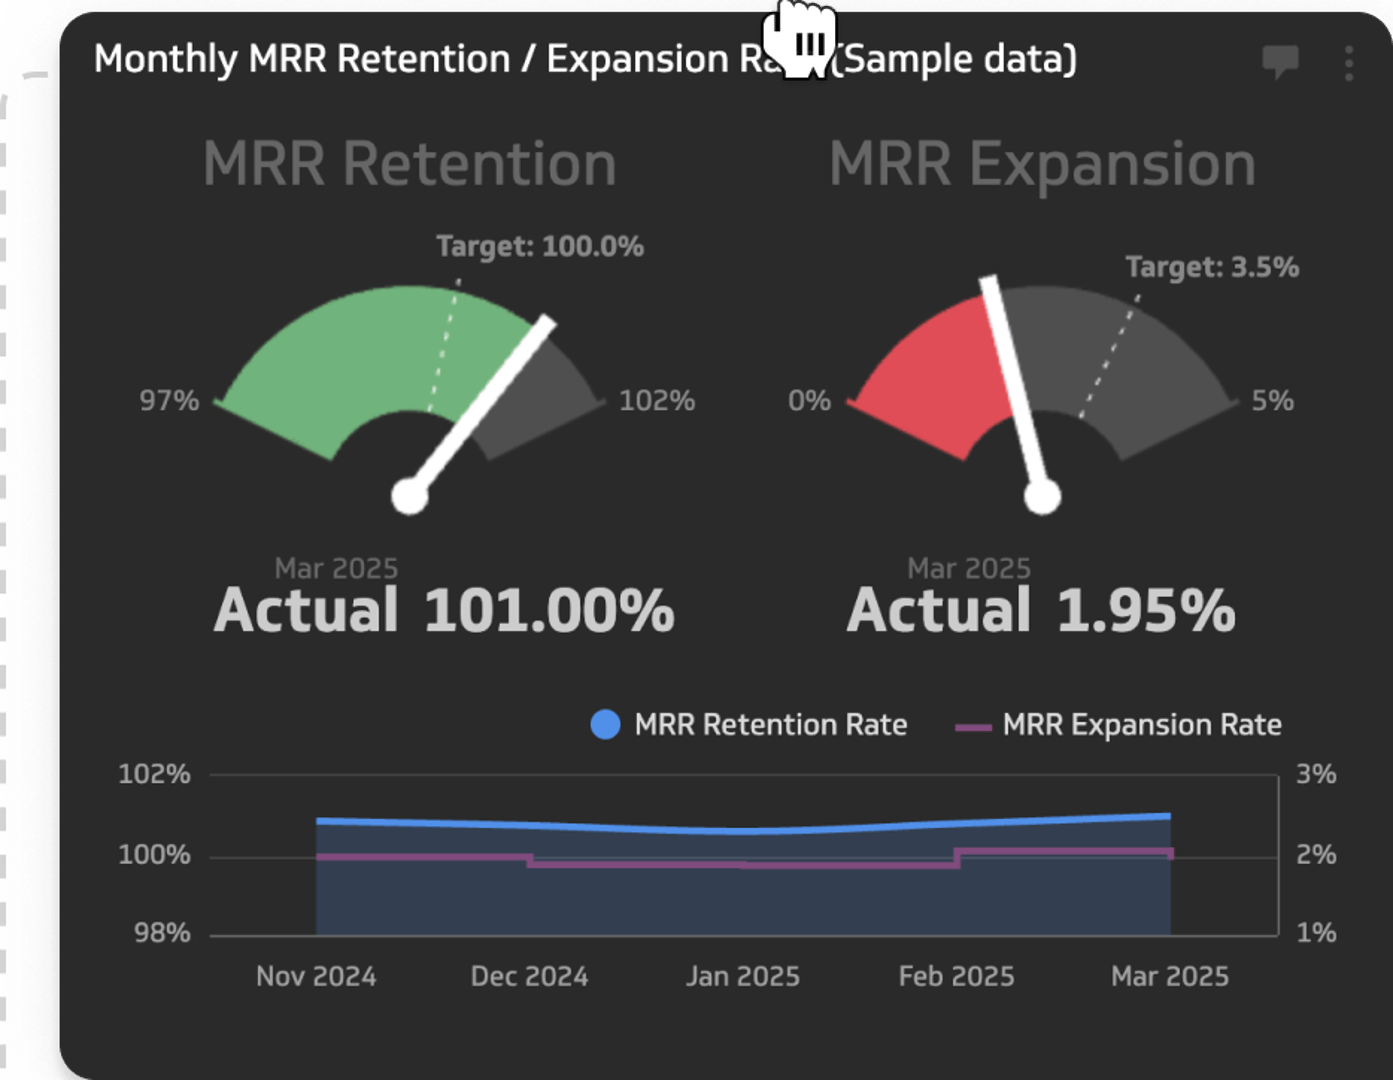
Comprehensive chart options
Klips includes too many chart types to list here! From common types, like, bar, line, pie, table, gauge, scatter, and bubble charts to maps, images, newsreaders, and pictographs, the sky’s the limit when it comes to Klip visualizations.

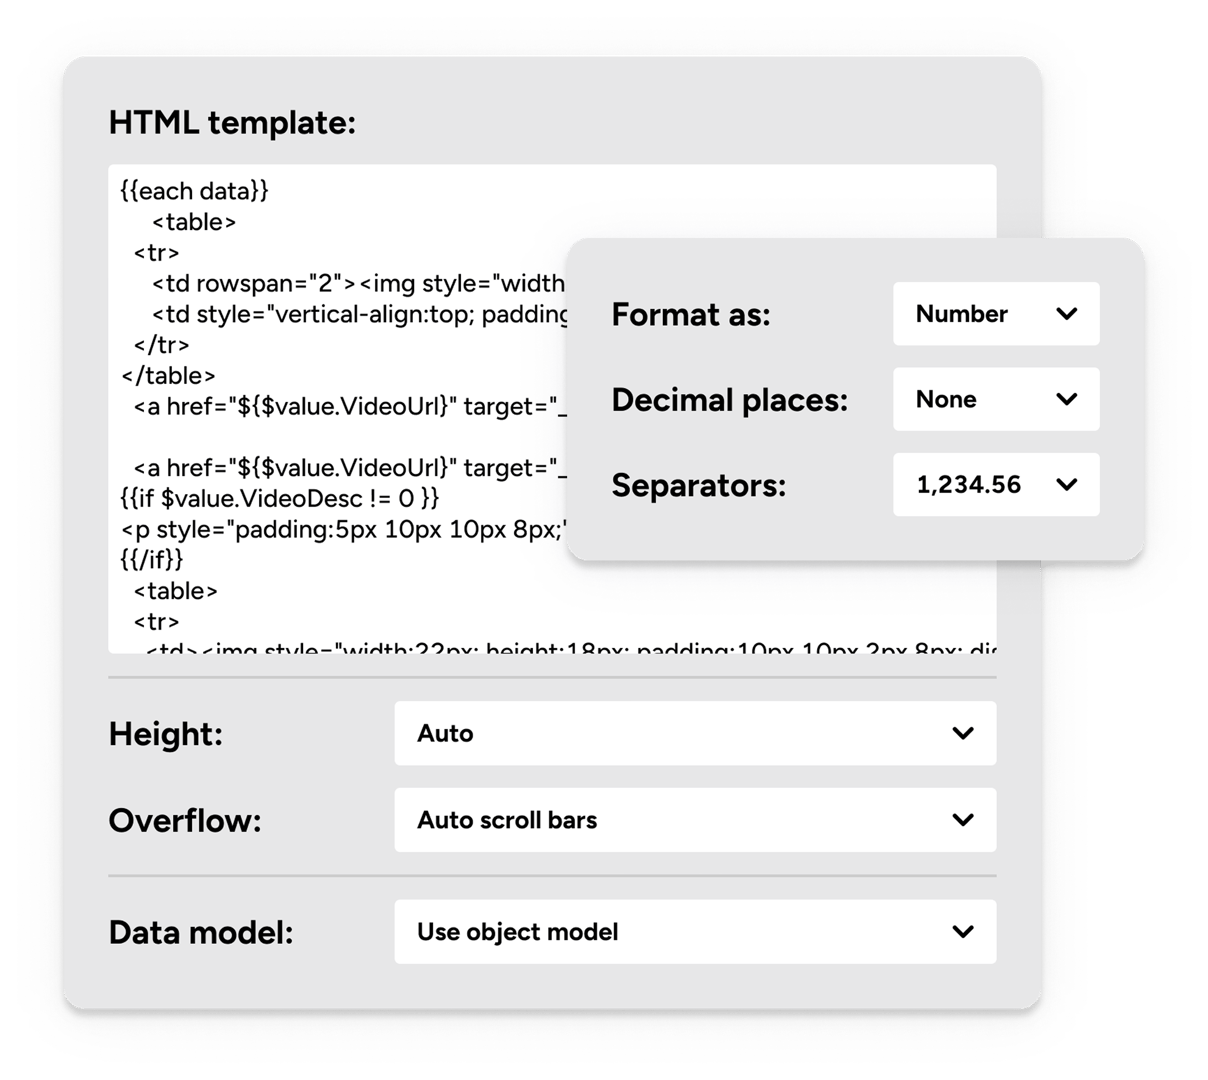
Maximum customization
Customize every detail, from axis labels and legends to series colours, indicators, and more. Adjust fonts, number formatting, and apply dynamic colour rules to highlight key trends and values.
Excel-like formulas, built for dashboards.
If you know your way around spreadsheets, you’ll feel right at home here. Klips brings the logic of formulas into a powerful, purpose-built data source editor.
Built-in functions
Manipulate, refine, and perform calculations on your data by writing formulas, with built-in functions. Calculate growth rates, targets, and ratios, or apply conditional logic and formatting.

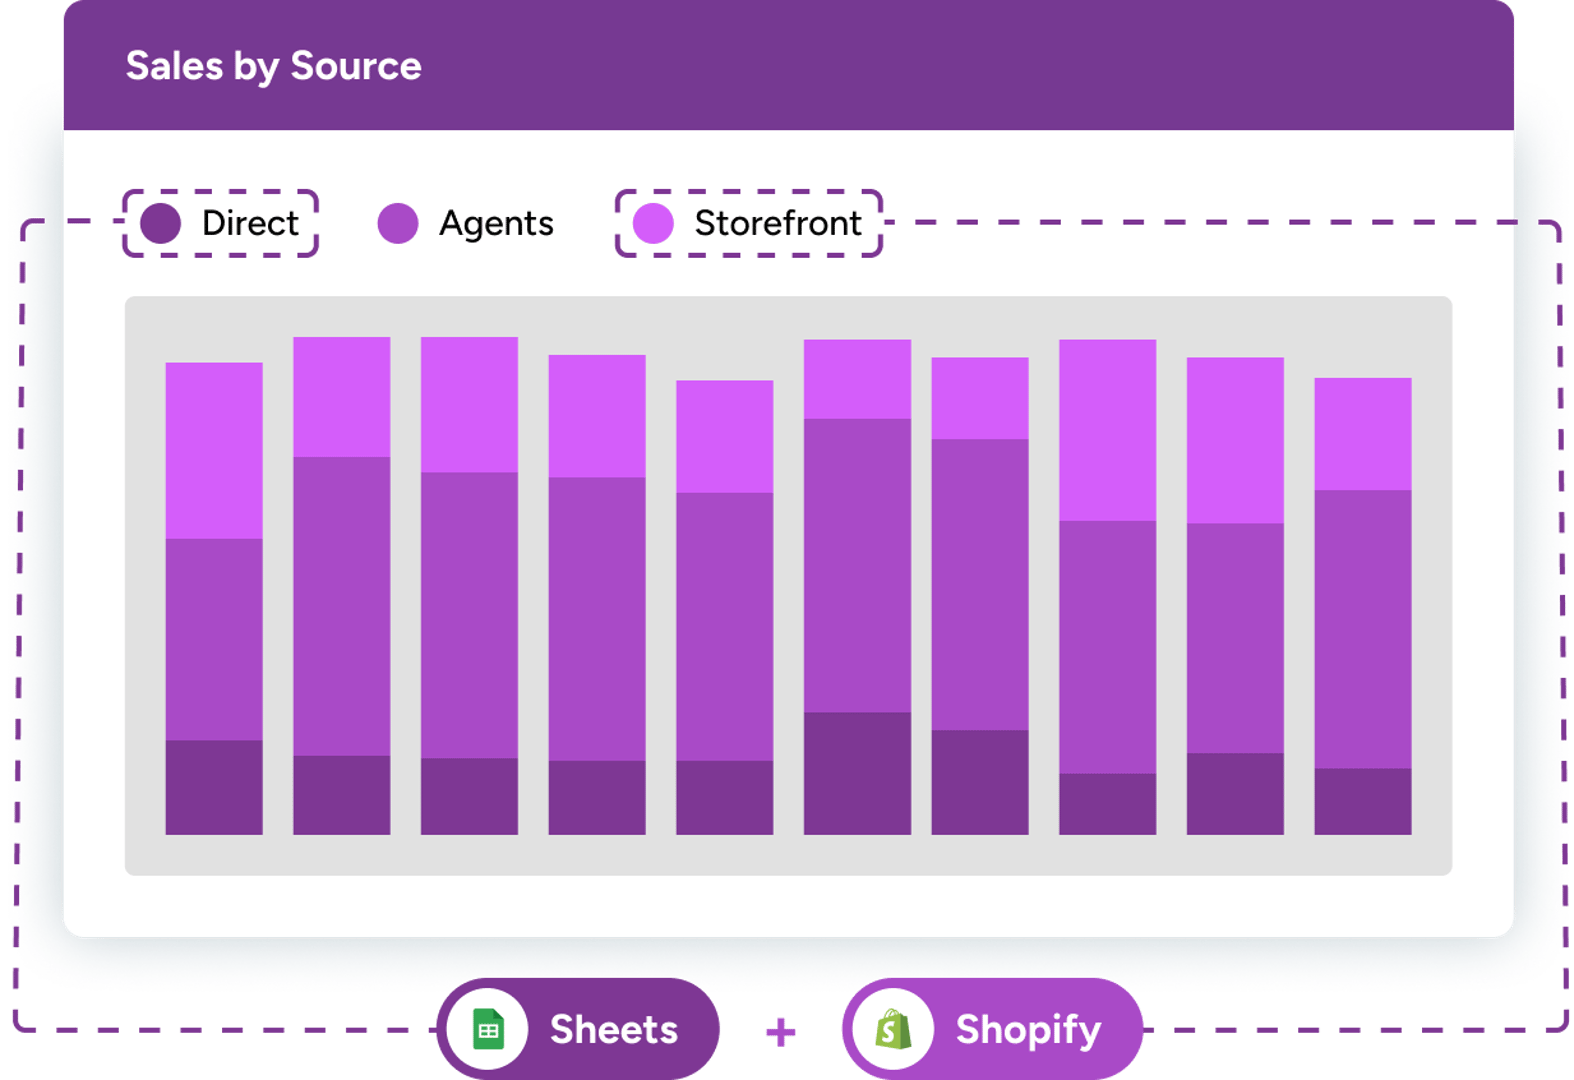
Reference multiple data sources in a single Klip
Create powerful visualizations by combining data from different data sources in a single widget. No need for joins—just reference what you need, where you need it.
Dashboards for builders.
Create dashboards that adapt, scale, and impress by configuring dynamic input controls and applying reusable components and templates.
Reusable components
Build Klips that can be used across multiple dashboards. This not only saves time, it ensures consistency and helps standardize the reporting approach across projects and teams.
Reusable components
Build Klips that can be used across multiple dashboards. This not only saves time, it ensures consistency and helps standardize the reporting approach across projects and teams.
Template-driven design
Deploy dashboards to your clients quickly with reusable templates. Maintain visual quality, reduce duplicated effort, and keep your reports aligned with internal or client standards.
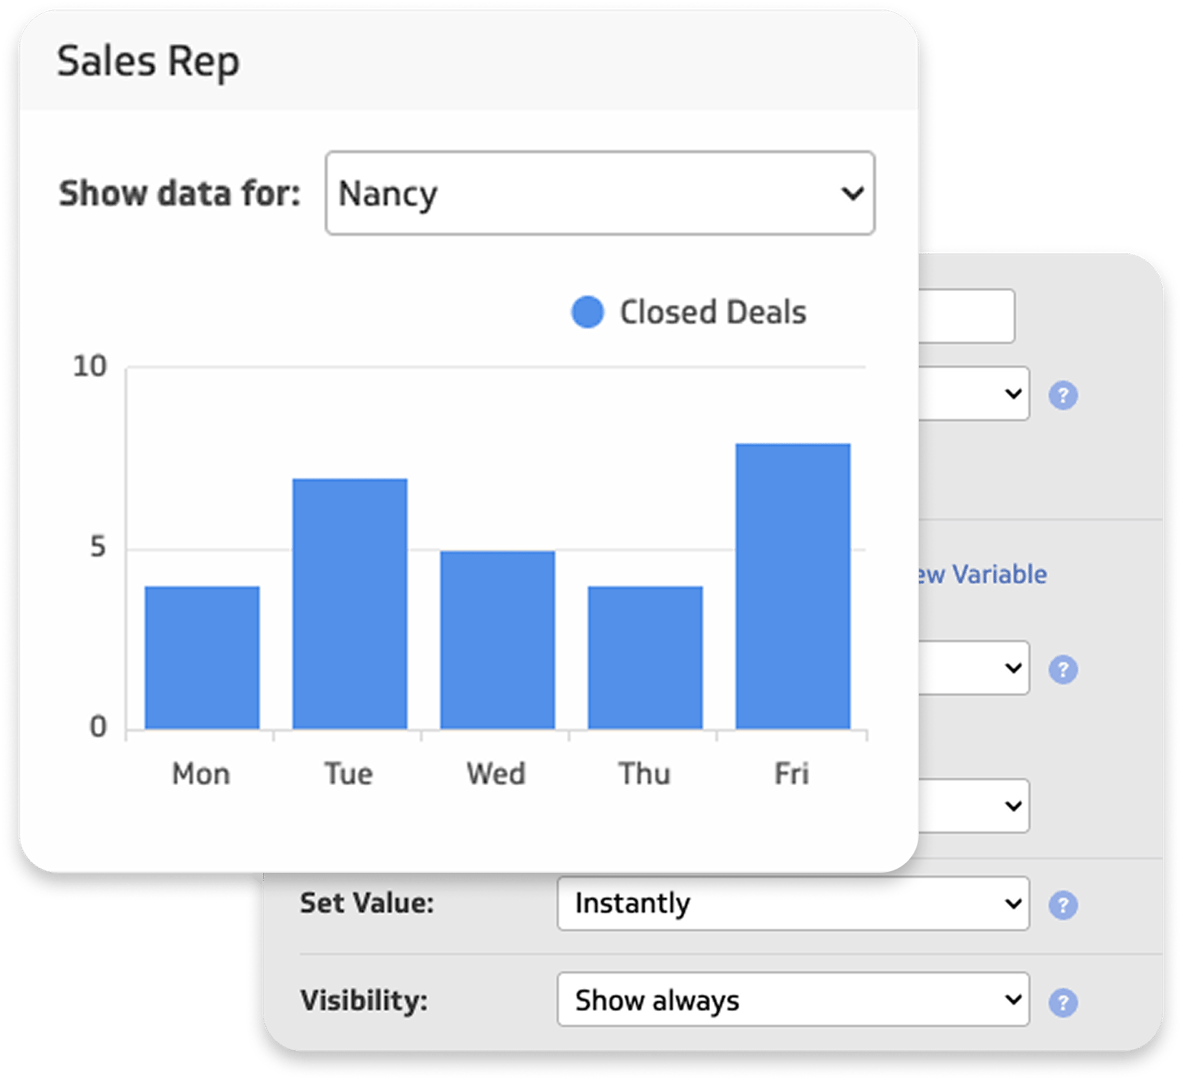
Parameterized dashboard presentation
Provide tailored dashboards by configuring dynamic inputs—like client names, locations, or user IDs. Save time and avoid duplication by creating one user input control and reusing it across multiple dashboards and clients.

Open it up or lock it down.
Whether you’re building for curious teams or executive reviews, Klips gives you full control over how users interact with your dashboards.
Independent exploration
Create dashboards with personalization options, so users can interact with and see the data from different perspectives. With Klips, it’s easy to create a customized experience without overwhelming the dashboard layout.
View-only experience
Control user interaction with curated, predictable dashboards that everyone can rely on. View-only dashboards are perfect for executive teams and client-facing reports, and any situation where consistency matters.
UP NEXT
Share your insights, unify your team
You've built a world-class dashboard that tells a compelling story. The final, most critical step is to get those insights into the hands of the people who can act on them. Sharing empowers your team to move in unison, turning individual clarity into collective, data-driven action.