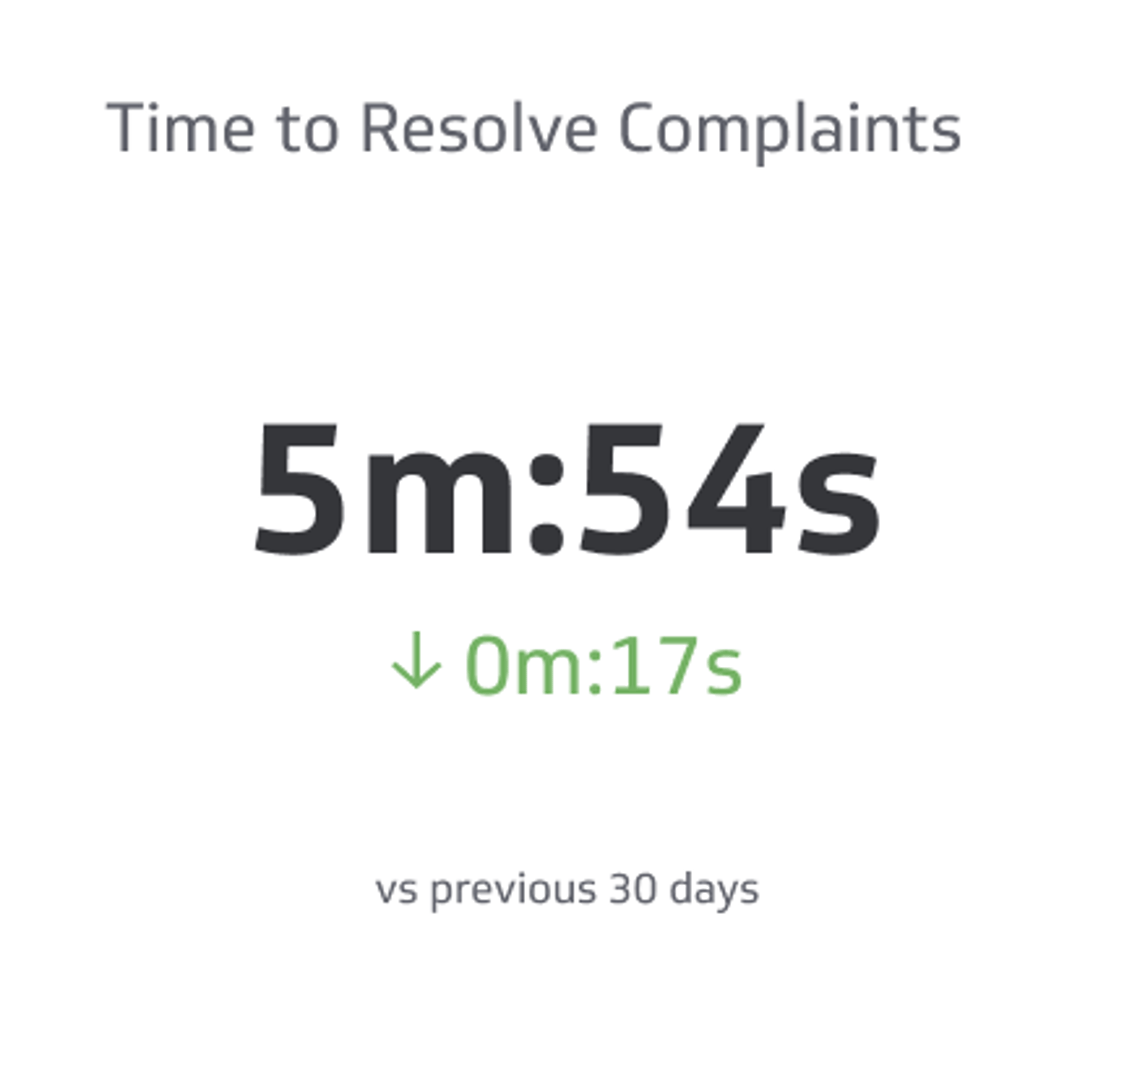
Time to Resolve Complaints Metric
Measure the total amount of time it takes to resolve issues.
Track all your Support KPIs in one place
Sign up for free and start making decisions for your business with confidence.
What is Time to Resolve Complaints?
Time to Resolve Complaints measures the average amount of time it takes your team to resolve customer complaints. It tracks the full journey from when a complaint is opened to when it is marked resolved. This KPI highlights how quickly customers receive a complete fix, not just a first reply. Shorter resolution times usually signal clearer processes, stronger knowledge, and better routing.
How to calculate Time to Resolve Complaints
Formula
Average Time to Resolve = (Sum of resolution times for all resolved complaints in period) / (Number of complaints resolved in period)
Define start and stop points clearly. Most teams start the clock when the complaint ticket is created and stop it when the ticket reaches a resolved or closed state. Decide whether to include time waiting on the customer. Many support teams report both:
- Calendar time to resolve: Includes all hours between open and resolve.
- Business time to resolve: Measures only business hours and excludes holidays and weekends based on a working calendar.
- Agent time to resolve: Excludes time waiting on customer or vendor, useful for coaching and workload planning.
Example
In April, your team resolved 240 complaint tickets. Total calendar time between open and resolved across those tickets equals 21,600 hours. Your average Time to Resolve is 21,600 / 240 = 90 hours. If you also calculate business time using a 9-to-5 schedule, the average drops to 56 hours. That gap suggests many tickets sit outside business hours or wait on customers.
What is a good benchmark?
Benchmarks depend on product complexity, customer segment, and severity definitions. Use these directional targets as a starting point, then tune by queue and priority:
- Priority 1 (critical outage or safety risk): 4 to 24 hours to resolution, with frequent updates.
- Priority 2 (degraded service or major defect): 1 to 3 business days.
- Priority 3 (minor defect or how-to complaint): 3 to 5 business days.
Track both the mean and the median. A small number of extreme outliers can push the average higher and hide day-to-day performance. Add the 90th percentile to show how long the slowest 10 percent take. Segment by channel, product, and complaint type to spot bottlenecks.
Why this KPI matters
- Customer trust: Faster resolution builds confidence and reduces repeat contacts.
- Cost control: Long-running tickets consume more hours across agents, specialists, and managers.
- Quality signal: High resolution times often point to missing knowledge, unclear ownership, or product defects.
- Team alignment: A clear target and shared view keep support, product, and operations working toward the same outcome.
Time to first response shows responsiveness. Time to resolve shows outcomes. You need both to manage experience with accuracy.
How to improve Time to Resolve Complaints
- Clarify severity and routing: Use simple, visible rules so complaints land with the right team on first touch.
- Strengthen knowledge: Keep articles short and current. Link defect workarounds to complaint macros so agents do not retype steps.
- Close the loop on blockers: Tag tickets that wait on engineering, vendor, or customer. Review the longest wait reasons weekly and remove friction.
- Build checklists for common fixes: Turn tribal knowledge into steps. Checklists speed up handoffs and reduce avoidable back-and-forth.
- Use swarming for complex cases: Pull the right roles into one thread early instead of serial escalations.
- Set update SLAs: If a fix needs time, schedule proactive updates. Clear expectations cut follow-up volume and keep CSAT steady.
How to monitor this KPI in Klips
Klips helps you bring ticket data into a live dashboard, calculate durations with clear rules, and share the same numbers across teams.
- Connect your data: Import from your help desk or ITSM tool. Use exports or APIs to pull ticket ID, opened date, resolved date, priority, status, owner, queue, and tags.
- Model the durations: Create fields for calendar time to resolve, business time to resolve, and time waiting on customer. Apply your working hours and holiday calendar.
- Calculate the KPI: Average the chosen duration for the selected period. Add median and 90th percentile to capture distribution.
- Visualize for action: Use a single value for current average, a 13-month line for trend, and a Pareto bar of top wait reasons or product areas driving long times.
- Segment and filter: Slice by priority, queue, product, or region. Add a table of the top 20 longest open tickets with owners and next steps.
- Distribute with control: Schedule weekly PDFs for managers, keep a wallboard for the floor, and share secure links with product leaders.
Pair this KPI with related measures like Time From Inquiry to Response and Overdue Service Requests to balance speed and quality.
Example calculation details
Suppose five complaints resolved today took 2 hours, 6 hours, 10 hours, 12 hours, and 80 hours of calendar time. The average is (2 + 6 + 10 + 12 + 80) / 5 = 22 hours. The median is 10 hours. The 80-hour outlier was a vendor defect. Without the outlier, the average drops to 7.5 hours. This is why distribution views matter for coaching and process fixes.
Reporting frequency
Track this KPI daily for operations and weekly for review. Keep a monthly and quarterly rollup to understand seasonality and the impact of bigger projects.
Similar KPIs
Related Metrics & KPIs