Peak Hour Traffic (PHT): Identify when your call centre is busiest Metric
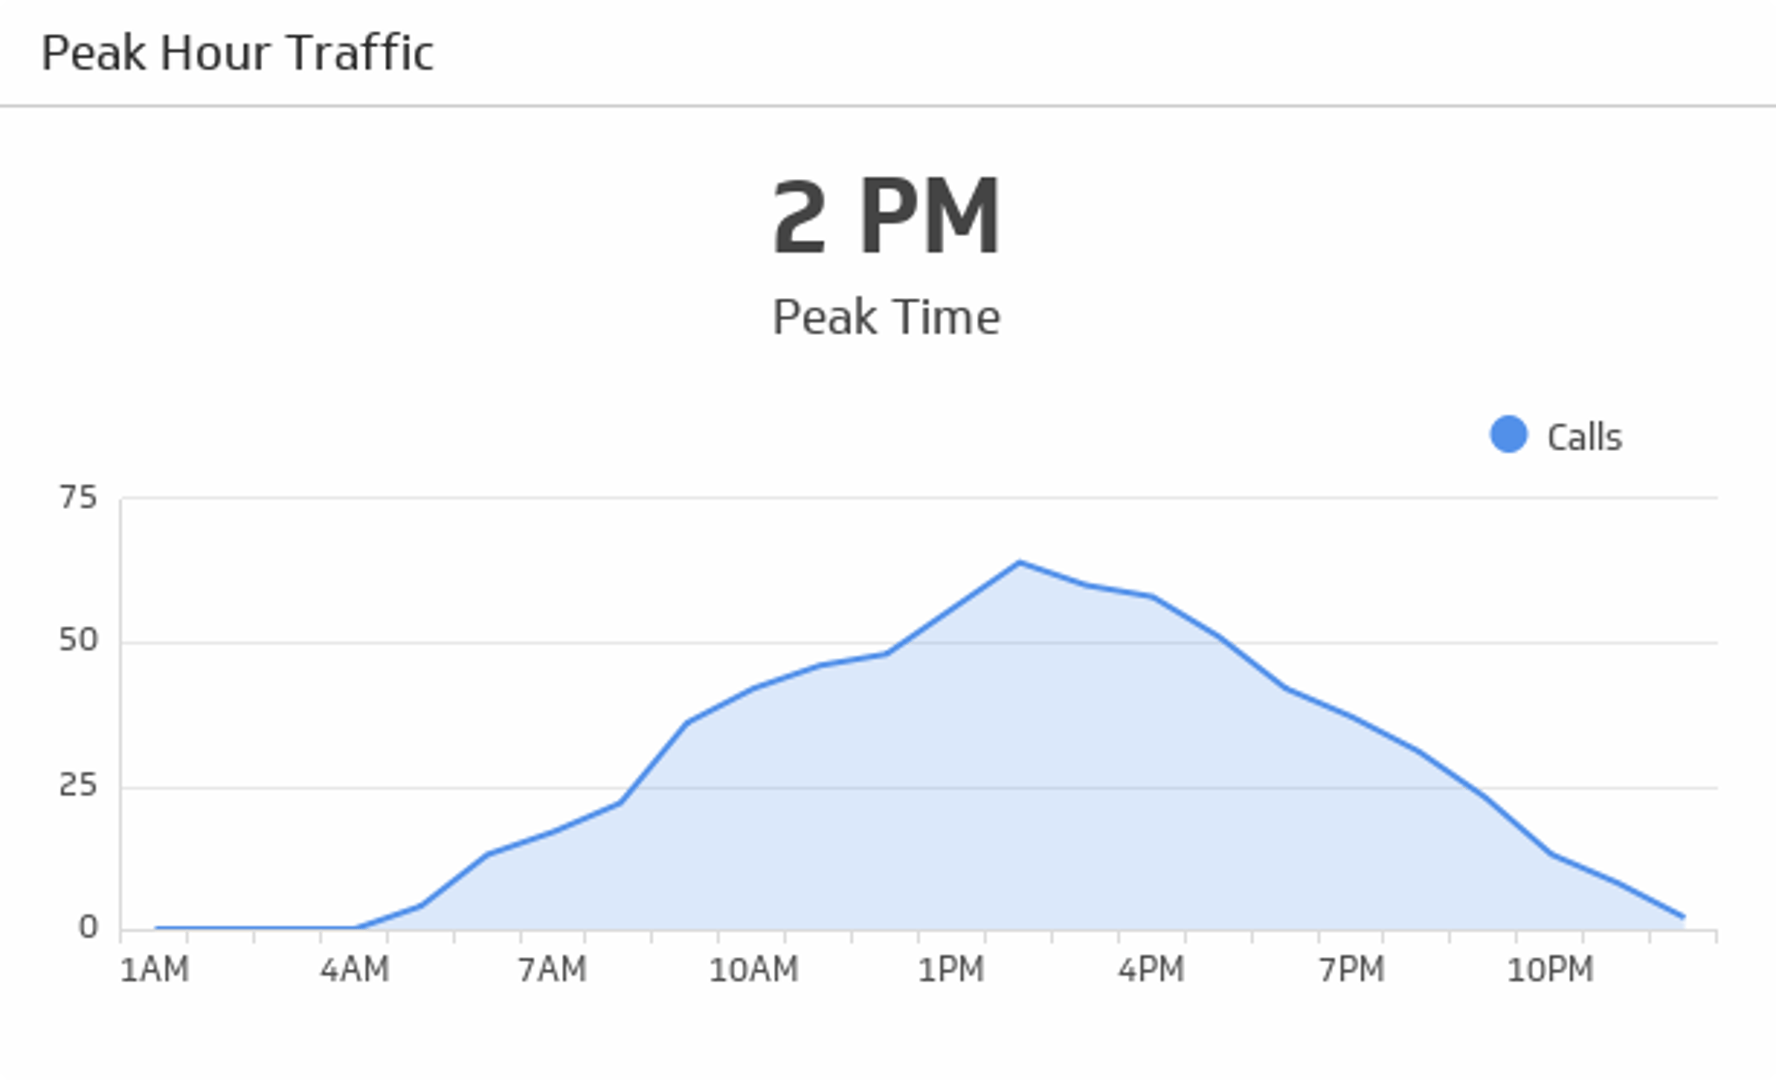
Identify the time of day when your call centre receives the most incoming calls.
Track all your Call Center KPIs in one place
Sign up for free and start making decisions for your business with confidence.
Overview
Peak Hour Traffic (PHT) identifies the time of day when your call centre receives the highest volume of incoming calls. Understanding this metric helps you schedule staff strategically, prepare resources, and ensure your team is ready to handle demand during your busiest periods.
This metric is essential for call centre managers who need to balance customer service quality with operational efficiency. By knowing exactly when your peak hour occurs, you can align staffing levels, reduce wait times, and improve overall service delivery.
Why Peak Hour Traffic Matters
Call centres operate under constant pressure to answer calls quickly while maintaining service quality. Peak Hour Traffic reveals when this pressure is greatest, allowing you to:
- Optimize staffing schedules – Ensure enough agents are available during your busiest time.
- Reduce wait times – Anticipate demand spikes and allocate resources accordingly.
- Improve customer satisfaction – Answer calls faster during peak periods, reducing abandoned calls.
- Plan training and breaks – Schedule non-essential activities outside peak hours.
- Forecast hiring needs – Understand seasonal or daily patterns to plan recruitment.
How to Calculate Peak Hour Traffic
Peak Hour Traffic is straightforward to identify:
Peak Hour Traffic = Time of day with the highest number of incoming calls
Step-by-step process:
- Collect call volume data for each hour of the day over a representative period (typically one month).
- Identify the hour with the greatest number of calls.
- Record that time (for example, 2 p.m. or 14:00).
- Compare across multiple weeks or months to confirm the pattern is consistent.
Example:
If your call centre receives:
- 10 a.m.: 120 calls
- 11 a.m.: 145 calls
- 12 p.m.: 160 calls
- 1 p.m.: 175 calls
- 2 p.m.: 210 calls - Peak Hour
- 3 p.m.: 190 calls
Your Peak Hour Traffic is 2 p.m. (or 14:00 in 24-hour format).
What a Healthy Peak Hour Traffic Target Looks Like
Unlike many KPIs, Peak Hour Traffic doesn't have a "good" or "bad" value—it's simply a fact about your operation. However, you should monitor:
- Consistency – Does your peak hour occur at the same time each day or week?
- Magnitude – How much higher is your peak hour compared to your average hour?
- Predictability – Can you reliably forecast when peak hour will occur?
A healthy peak hour pattern allows you to staff confidently and set realistic service level targets for that period.
Peak Hour Traffic vs. Related Metrics
Peak Hour Traffic works alongside other call centre KPIs to give you a complete picture:
| Metric | What it measures | Why it matters |
|---|---|---|
| Peak Hour Traffic | Time of day with the most calls | Helps you schedule staff and resources |
| Call Volume | Total number of calls received | Shows overall demand and growth trends |
| Service Level | % of calls answered within a set time | Measures your ability to meet customer expectations |
| Average Handle Time (AHT) | Average duration of a call | Indicates agent efficiency and call complexity |
| Abandoned Call Rate | % of calls dropped before reaching an agent | Often spikes during peak hours due to long waits |
How to Track Peak Hour Traffic
Modern call centre software and dashboards make tracking Peak Hour Traffic simple. Rather than manually reviewing call logs, use:
- Call centre reporting tools – Most phone systems include built-in reporting that breaks call volume down by hour.
- Business dashboards – Visualize peak hour patterns across days, weeks, and months to spot trends.
- Real-time monitoring – Watch call volume as it happens so you can adjust staffing on the fly.
Klipfolio's dashboard software allows you to connect your call centre data and create visual reports that highlight your peak hour at a glance, making it easy to share insights with your team.
Variations of Peak Hour Traffic
Depending on your call centre's focus, you might track:
- Busiest hour for inbound calls – Most common for customer service centres.
- Busiest hour for outbound calls – Relevant for sales or collections teams.
- Busiest hour by call type – Track peak times for support calls vs. sales calls separately.
- Busiest day of the week – Identify whether Mondays or Fridays see higher volume.
- Seasonal peak hours – Note how peak hour shifts during busy seasons (holidays, product launches).
Best Practices for Managing Peak Hour Traffic
Once you've identified your peak hour, use these strategies to improve performance:
- Schedule your best agents during peak hours – Assign experienced staff to handle the highest volume.
- Implement call queuing – Use intelligent routing to distribute calls evenly during peak times.
- Offer callback options – Let customers choose to receive a call back instead of waiting on hold.
- Set realistic service level targets – Acknowledge that peak hours may have longer wait times and adjust expectations accordingly.
- Monitor continuously – Peak hour patterns can shift due to seasonality, marketing campaigns, or product changes.
- Cross-train staff – Ensure multiple team members can handle calls during peak periods.
Key Takeaway
Peak Hour Traffic is a foundational metric for call centre management. By understanding when your busiest time occurs, you can make smarter staffing decisions, reduce customer wait times, and improve overall service quality. Track this metric alongside other call centre KPIs to build a comprehensive view of your operation's performance.
Related Metrics & KPIs