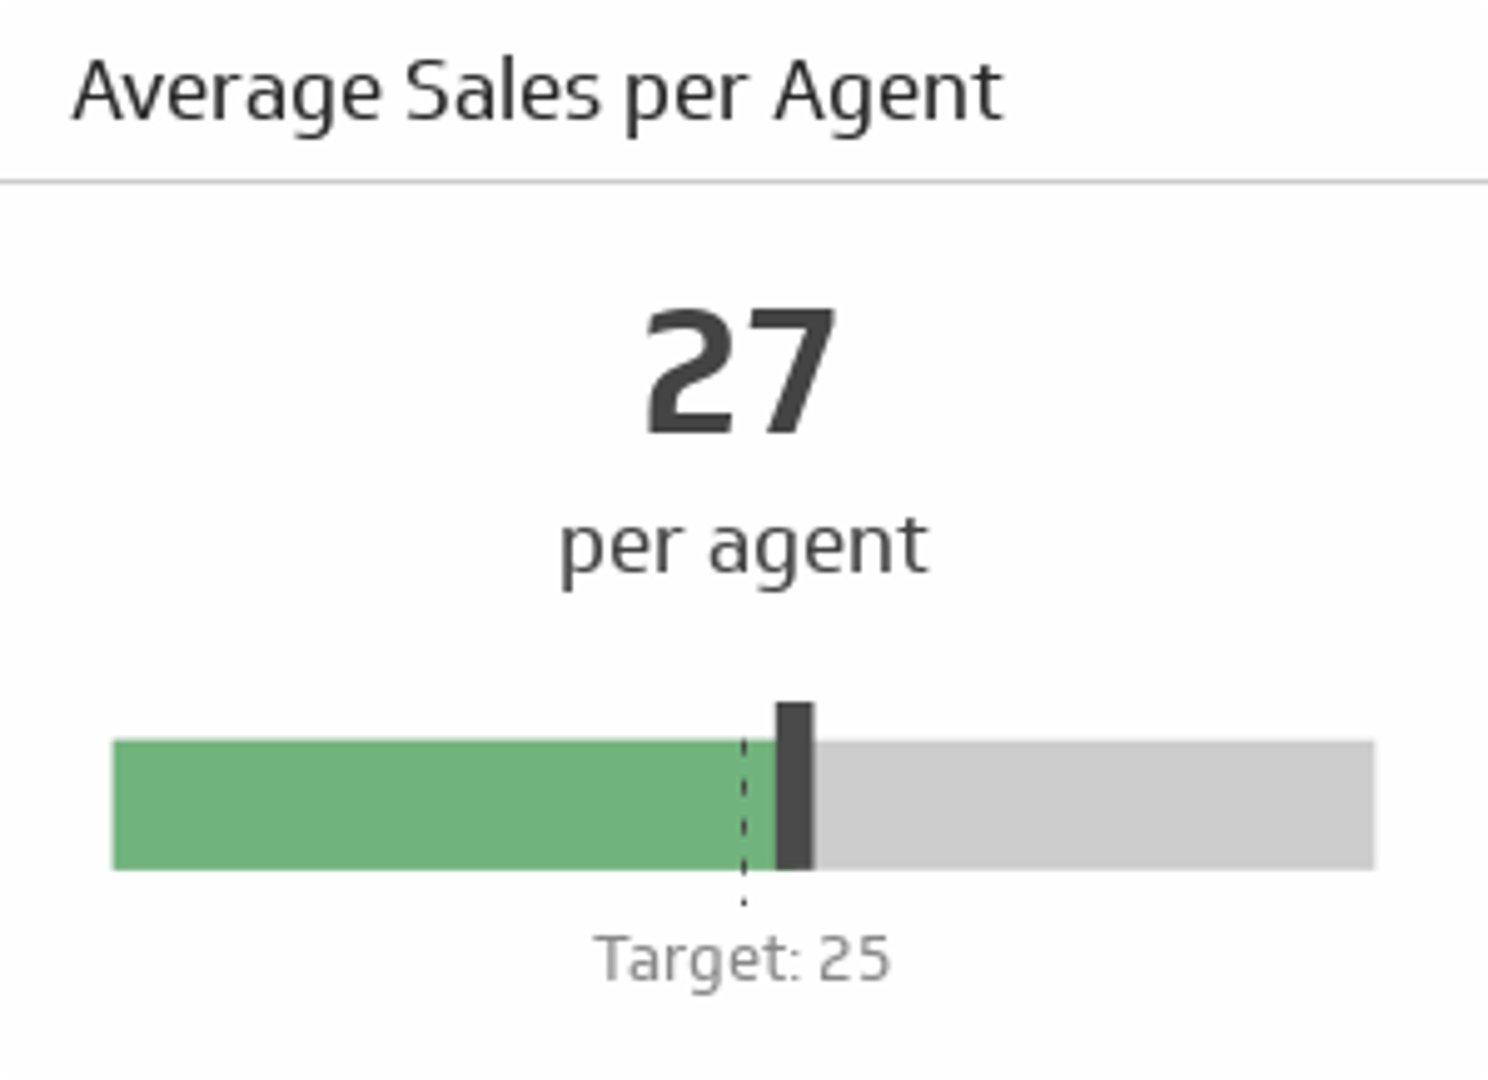
Average Sales per Agent Metric
Measure the average amount of sales your agents generate.
Track all your Call Center KPIs in one place
Sign up for free and start making decisions for your business with confidence.
Overview
The Average Sales per Agent metric measures the average total sales revenue or volume that each agent generates within a specified reporting period. This KPI helps call centre and sales managers evaluate individual and team performance, identify top performers, and set realistic sales targets.
Why Average Sales per Agent matters
Sales leaders use this metric to understand productivity across their team. It reveals whether your agents are hitting targets, highlights training opportunities, and helps you allocate resources more effectively. A rising average signals improving team performance; a declining average suggests coaching, staffing, or process issues that need attention.
This metric also supports fair performance reviews. Rather than comparing raw sales numbers (which vary by territory or account size), the average normalises results across your team, making it easier to spot genuine performance gaps.
How to calculate Average Sales per Agent
Formula:
(Total sales from all agents) / (Number of agents)
Example:
If your team closed £150,000 in sales across five agents in a week:
£150,000 / 5 = £30,000 average sales per agent
You can calculate this by revenue, transaction count, or deal volume—choose the metric that aligns with your business model.
Reporting frequency and targets
Most sales teams review this metric weekly or monthly. Weekly reviews catch performance trends early; monthly reviews smooth out day-to-day variation and are better for trend analysis.
Typical targets depend on your industry and sales cycle. A B2B software sales team might target £25,000–£50,000 per agent per month, while a call centre handling smaller transactions might aim for 50–100 sales per agent per week.
Who should track this metric
- Sales managers: Monitor team productivity and individual performance.
- Call centre managers: Evaluate agent output and staffing adequacy.
- Finance/operations: Forecast revenue and plan resource allocation.
- HR: Support performance management and compensation decisions.
Related metrics and variations
Average Sales per Agent by Product or Service
Break down sales by product line to see which agents excel at selling specific offerings.
Sales per Agent per Hour
Normalise for shift length or part-time schedules to compare fairly across your team.
Average Deal Size per Agent
Measure the average value of each deal closed, not just the count, to reward quality over volume.
Sales Quota Attainment
Compare actual average sales to your target, expressed as a percentage (e.g., "achieved 92% of quota").
Agent Conversion Rate
Pair this metric with conversion rate to understand whether agents are handling more calls but closing fewer deals—a sign of quality or coaching issues.
How to improve Average Sales per Agent
1. Identify and share best practices
Study your top performers. What discovery questions do they ask? How do they handle objections? Document and train the rest of your team.
2. Invest in training and coaching
New agents or those with declining numbers benefit from targeted skill-building. Focus on objection handling, product knowledge, and closing techniques.
3. Refine your sales process
Remove friction from your pipeline. If agents spend too much time on admin, they close fewer deals. Automate lead assignment, CRM entry, and follow-ups where possible.
4. Align incentives with targets
Make sure compensation, bonuses, or recognition reward the average you're targeting. Misaligned incentives drive the wrong behaviour.
5. Monitor leading indicators
Track calls placed, conversations held, and proposals sent alongside sales closed. A drop in activity often precedes a drop in sales.
6. Use dashboards to track progress
Real-time visibility into average sales per agent keeps your team motivated and helps you spot problems fast. Display it on team dashboards, send weekly summaries, or embed it in your CRM.
Benchmarking and context
Your average will vary by:
- Industry: SaaS sales teams often average higher deal sizes; retail call centres average higher transaction counts.
- Experience: New agents typically close fewer sales per week than veterans.
- Territory or account size: Agents assigned to large accounts may close fewer deals but larger revenue per deal.
- Sales cycle length: Short cycles (e.g., e-commerce) allow higher transaction counts; long cycles (e.g., enterprise software) yield fewer deals but higher values.
Don't compare your average to competitors without understanding these factors. Instead, track your own trend month-over-month and benchmark against your own historical performance and internal targets.
Related Metrics & KPIs