On-Hold Time Metric
Measure the average amount of time callers spend on hold and improve customer experience.
Track all your Call Center KPIs in one place
Sign up for free and start making decisions for your business with confidence.
Overview
Whether your company receives a high volume of calls or has limited agent capacity, putting incoming calls on hold is often unavoidable. On-Hold Time measures the average duration callers spend waiting to speak with an agent. This metric helps call centre managers understand customer experience and identify opportunities to improve service levels.
Why On-Hold Time Matters
Long hold times frustrate customers, increase abandonment rates, and damage brand reputation. By tracking on-hold time, you can:
- Identify staffing gaps: Consistently high hold times signal that you need more agents during peak hours.
- Improve customer satisfaction: Shorter waits lead to better customer experiences and loyalty.
- Benchmark performance: Compare your hold times against industry standards to stay competitive.
- Optimize scheduling: Use hold time data to align agent availability with call volume patterns.
Formula
(Hold time for call A + Hold time for call B + Hold time for call C + ... + Hold time for call N) / Total number of calls put on hold
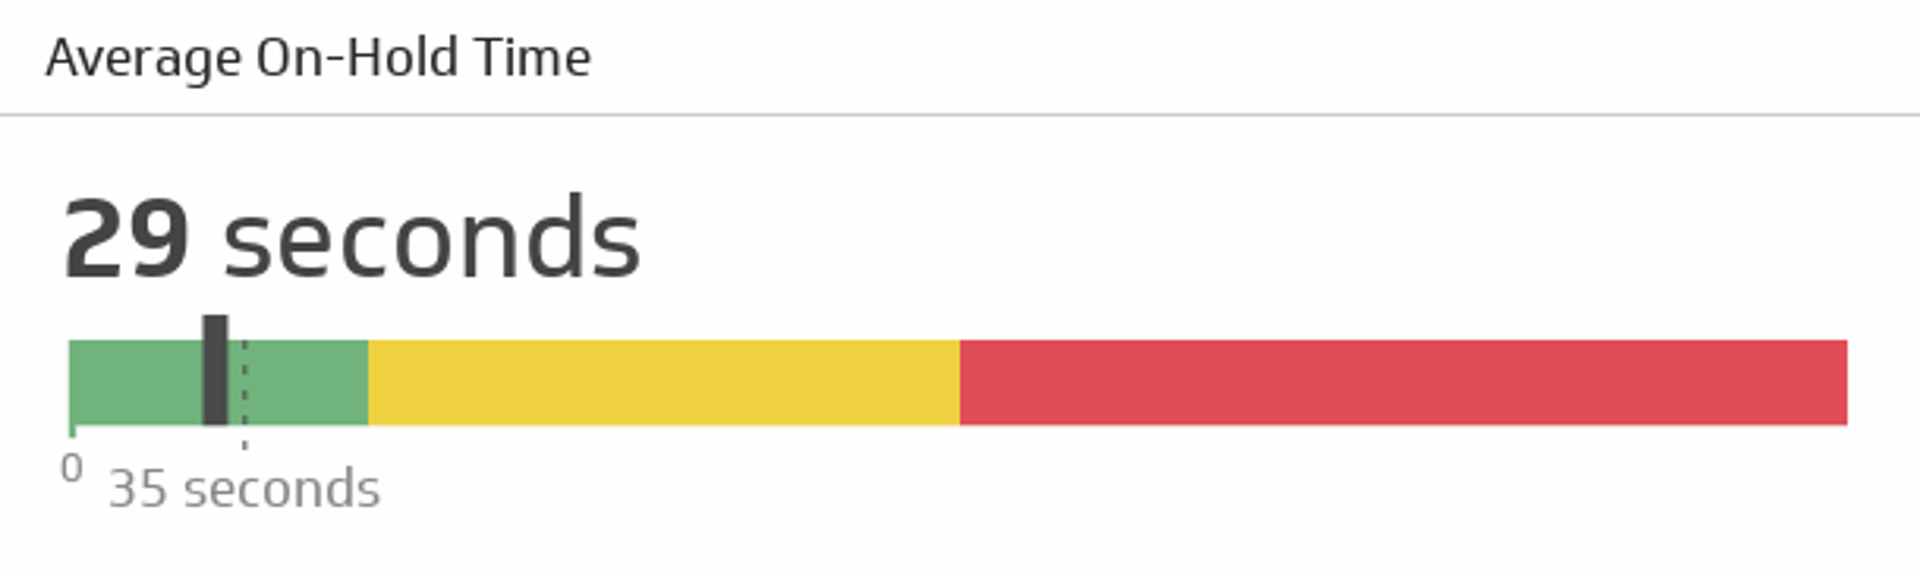
Example calculation: If 100 calls were placed on hold with a combined hold time of 3,500 seconds, your on-hold time would be 35 seconds per call.
How to Interpret On-Hold Time
- Below 30 seconds: Excellent. Callers experience minimal wait and are likely to stay on the line.
- 30–60 seconds: Acceptable for most industries, though room for improvement exists.
- Above 60 seconds: Poor. High abandonment risk and potential customer dissatisfaction.
Industry benchmarks vary by sector. Financial services typically aim for 20–30 seconds, while retail support may tolerate 45–60 seconds.
Key Considerations
Distinguish hold time from wait time: On-hold time measures how long a caller waits after being placed on hold. This differs from wait time, which includes the time spent in the queue before being placed on hold.
Account for peak vs. off-peak: On-hold times often spike during peak call volumes. Track trends over weeks or months to identify patterns and plan accordingly.
Monitor alongside related metrics: On-hold time works best when paired with metrics like First Contact Resolution (FCR), Service Level, and Abandoned Call Rate to get a complete picture of call centre performance.
Reporting Frequency
Weekly
Example of KPI Target
35 seconds
Audience
Call centre managers, team leads, operations directors
Variations
- Average hold time
- Average hold length
- Maximum hold time
- Calls exceeding target hold time (percentage)
Related Metrics & KPIs