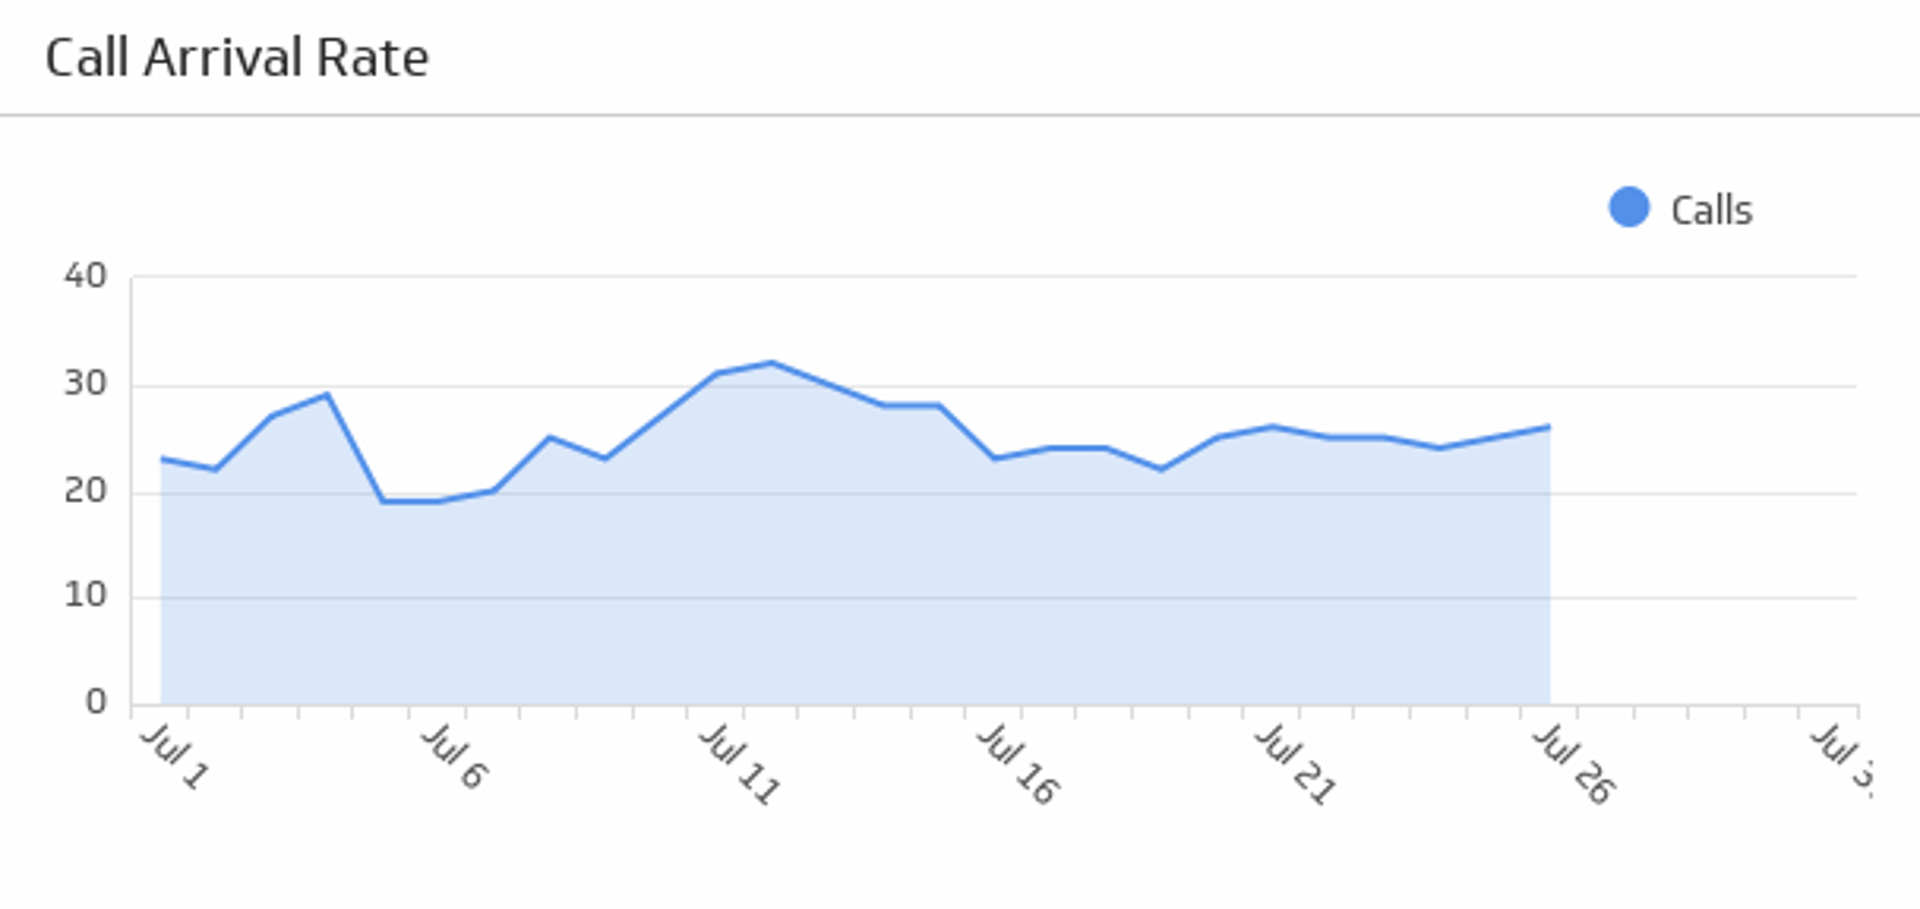
Call Arrival Rate Metric
Track the average number of incoming calls to plan staffing and manage capacity effectively.
Track all your Call Center KPIs in one place
Sign up for free and start making decisions for your business with confidence.
Overview
Call Arrival Rate measures the average number of incoming calls received during a specific time period. This metric helps call centre managers understand call volume patterns and plan staffing accordingly. By tracking how many calls arrive per hour, day, or shift, you can identify peak times, allocate resources effectively, and ensure your team isn't overwhelmed or underutilized.
Call Arrival Rate is foundational for call centre operations. It directly influences decisions about scheduling, hiring, and service level targets. When you know how many calls typically arrive, you can staff appropriately, reduce customer wait times, and improve overall efficiency.
Why Call Arrival Rate Matters
Understanding your call volume helps you:
- Plan staffing levels: Match agent availability to expected call volume so customers don't wait unnecessarily.
- Forecast capacity: Identify peak periods and prepare your team in advance.
- Set realistic targets: Use arrival data to establish achievable service level and average handle time goals.
- Reduce costs: Avoid overstaffing during slow periods and prevent understaffing during busy times.
- Improve customer experience: Adequate staffing means shorter wait times and faster issue resolution.
Call centre managers who monitor this metric consistently can anticipate demand, reduce abandoned calls, and maintain consistent service quality.
How to Calculate Call Arrival Rate
The formula is straightforward:
Call Arrival Rate = Total Incoming Calls / Time Period
Example calculation
If your call centre receives 500 calls in an 8-hour shift:
- Hourly rate: 500 / 8 = 62.5 calls per hour
- Per-minute rate: 500 / 480 minutes = 1.04 calls per minute
You can measure Call Arrival Rate by hour, day, week, or any interval that helps you plan. Most call centres track it hourly to identify patterns within each shift.
Typical targets and benchmarks
Call Arrival Rate targets vary by industry and business type:
- Inbound customer support: 40–80 calls per hour per agent group.
- Sales-focused call centres: 20–50 calls per hour (longer average handle time).
- Technical support: 30–60 calls per hour (depends on complexity).
Your target depends on your average handle time, service level goals, and staffing budget. A call centre with a 5-minute average handle time can manage more arrivals per hour than one with 15-minute calls.
How to track and report Call Arrival Rate
- Reporting frequency: Daily or hourly (depending on your operation size).
- Best practice: Track by shift, agent group, or department to spot variations.
- Visualization: Use line charts to show arrival trends over time, or heat maps to highlight peak hours.
Modern call centre software and dashboards can automatically capture and visualize this data, eliminating manual spreadsheet tracking and giving your team real-time visibility into call volume.
Related metrics to monitor alongside Call Arrival Rate
To get the full picture of call centre performance, combine Call Arrival Rate with these metrics:
- Service Level: The percentage of calls answered within your target time (e.g., 80% answered within 20 seconds).
- Average Handle Time (AHT): How long agents spend on each call, including hold time and after-call work.
- Abandoned Call Rate: The percentage of callers who hang up before reaching an agent.
- Agent Occupancy Rate: The percentage of time agents spend on active calls versus available time.
- First Contact Resolution (FCR): The percentage of calls resolved on the first interaction.
Together, these metrics reveal whether your staffing and processes are truly meeting customer needs.
Variations of this metric
- Peak Hour Arrival Rate: The highest call volume during a single hour.
- Average Calls per Agent: Total calls divided by number of available agents.
- Arrival Rate by Channel: Separate tracking for phone, email, chat, or other contact methods.
- Seasonal Arrival Rate: How call volume changes by season, holiday, or business cycle.
Actionable insights from Call Arrival Rate data
Once you're tracking this metric, use the insights to:
- Adjust schedules: Schedule more agents during predictable peak hours.
- Cross-train staff: Prepare backup support from other departments during surges.
- Implement call queuing: Use call-back features or callback options during high-volume periods.
- Refine forecasting: Use historical data to predict future demand and plan proactively.
- Benchmark performance: Compare your arrival rates to industry standards and your own historical trends.
Summary
Call Arrival Rate is essential data for any call centre. It's the starting point for capacity planning, staffing decisions, and service level management. By monitoring this metric consistently—ideally through a real-time dashboard—you can ensure your team is always prepared to handle incoming demand efficiently and deliver excellent customer service.
Related Metrics & KPIs