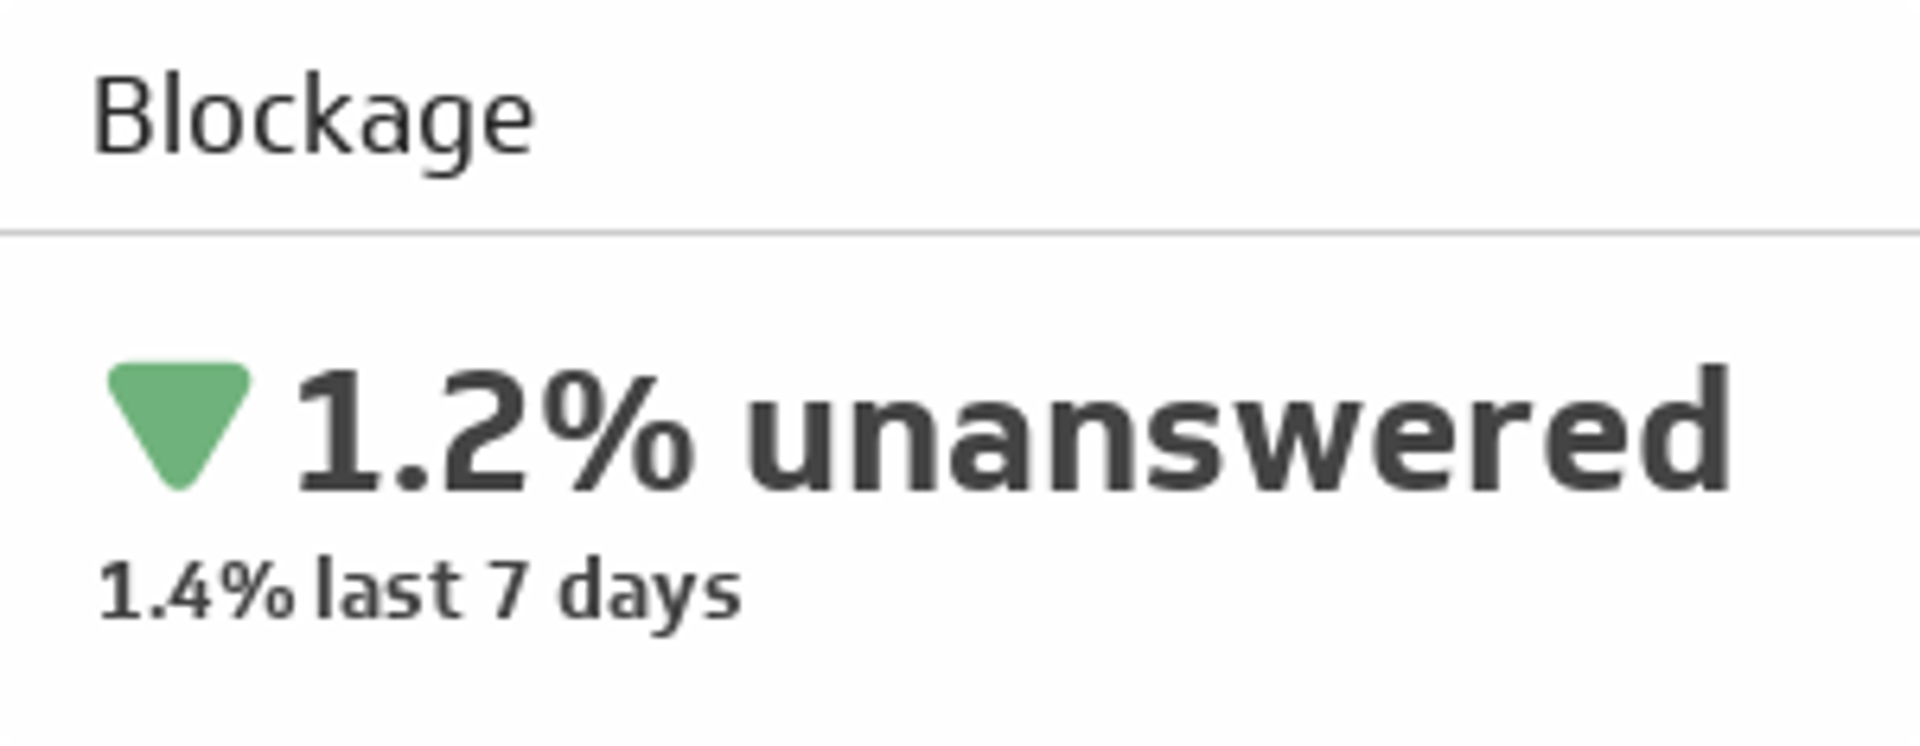
Blockage Metric
Measure the percentage of incoming calls that fail to reach an agent due to staffing or technical issues.
Track all your Call Center KPIs in one place
Sign up for free and start making decisions for your business with confidence.
Overview
The Blockage metric measures the percentage of incoming calls that fail to reach an agent due to insufficient staffing, network issues, or system failures. Tracking blockage helps call centre managers identify capacity constraints and prioritize investments in agent hiring or infrastructure improvements.
In a well-functioning call centre, blockage should remain near zero. High blockage rates signal that customers are unable to connect, which damages customer satisfaction, increases abandonment, and creates missed revenue opportunities. By monitoring this metric alongside call volume and service level, you gain a complete picture of your centre's ability to meet demand.
Why blockage matters
Blocked calls represent lost business. When a customer cannot reach an agent, they may:
- Abandon the call and contact a competitor
- Leave negative reviews or feedback
- Require follow-up outreach, increasing operational costs
- Reduce lifetime value and brand loyalty
Call centre managers use blockage data to make staffing decisions, validate technology investments, and demonstrate the business case for scaling operations.
Formula
Blockage = (Calls that do not reach agents / Total incoming calls) × 100
Worked example
Suppose your call centre receives 1,000 calls in a week. Due to agent shortage and a brief network outage, 45 calls fail to connect to an agent.
Blockage = (45 / 1,000) × 100 = 4.5%
A blockage rate of 4.5% means nearly 1 in 20 customers cannot reach your team—a significant operational issue that warrants immediate action.
Reporting frequency
Weekly (or daily during periods of high call volume or known staffing constraints).
Example KPI target
0% or as close to zero as operationally feasible. Industry benchmarks typically aim for blockage below 1%.
Audience
- Call centre managers: Monitor blockage to assess staffing adequacy and queue performance.
- Operations leads: Use blockage trends to forecast hiring needs and infrastructure upgrades.
- Finance/leadership: Review blockage as a proxy for customer experience and revenue risk.
Related metrics
To gain deeper insight into call centre health, track blockage alongside:
- Service level: Percentage of calls answered within a target time (e.g., 80% within 20 seconds).
- Abandoned call rate: Percentage of calls disconnected by customers before reaching an agent.
- Average handle time: Average duration of agent interactions, including hold and after-call work.
- First contact resolution: Percentage of issues resolved during the first customer interaction.
High blockage combined with high abandonment suggests capacity is the primary constraint. If blockage is low but abandonment is high, long wait times or poor agent quality may be the issue.
Variations
- Blocked incoming calls: Alternative term for the same metric.
- Call blocking rate: Used interchangeably in some organisations.
- Calls not offered: Calls rejected by the system before entering the queue (a subset of blockage).
How to reduce blockage
Staffing: Hire additional agents or adjust scheduling to match peak call volumes.
Technology: Upgrade phone systems, implement call routing algorithms, or migrate to cloud-based platforms to reduce dropped calls.
Process: Implement callback options, IVR self-service, or chat channels to deflect lower-priority inquiries away from voice agents.
Monitoring: Set real-time alerts for blockage spikes so your team can respond quickly to capacity issues.
Related Metrics & KPIs