
HR Dashboard
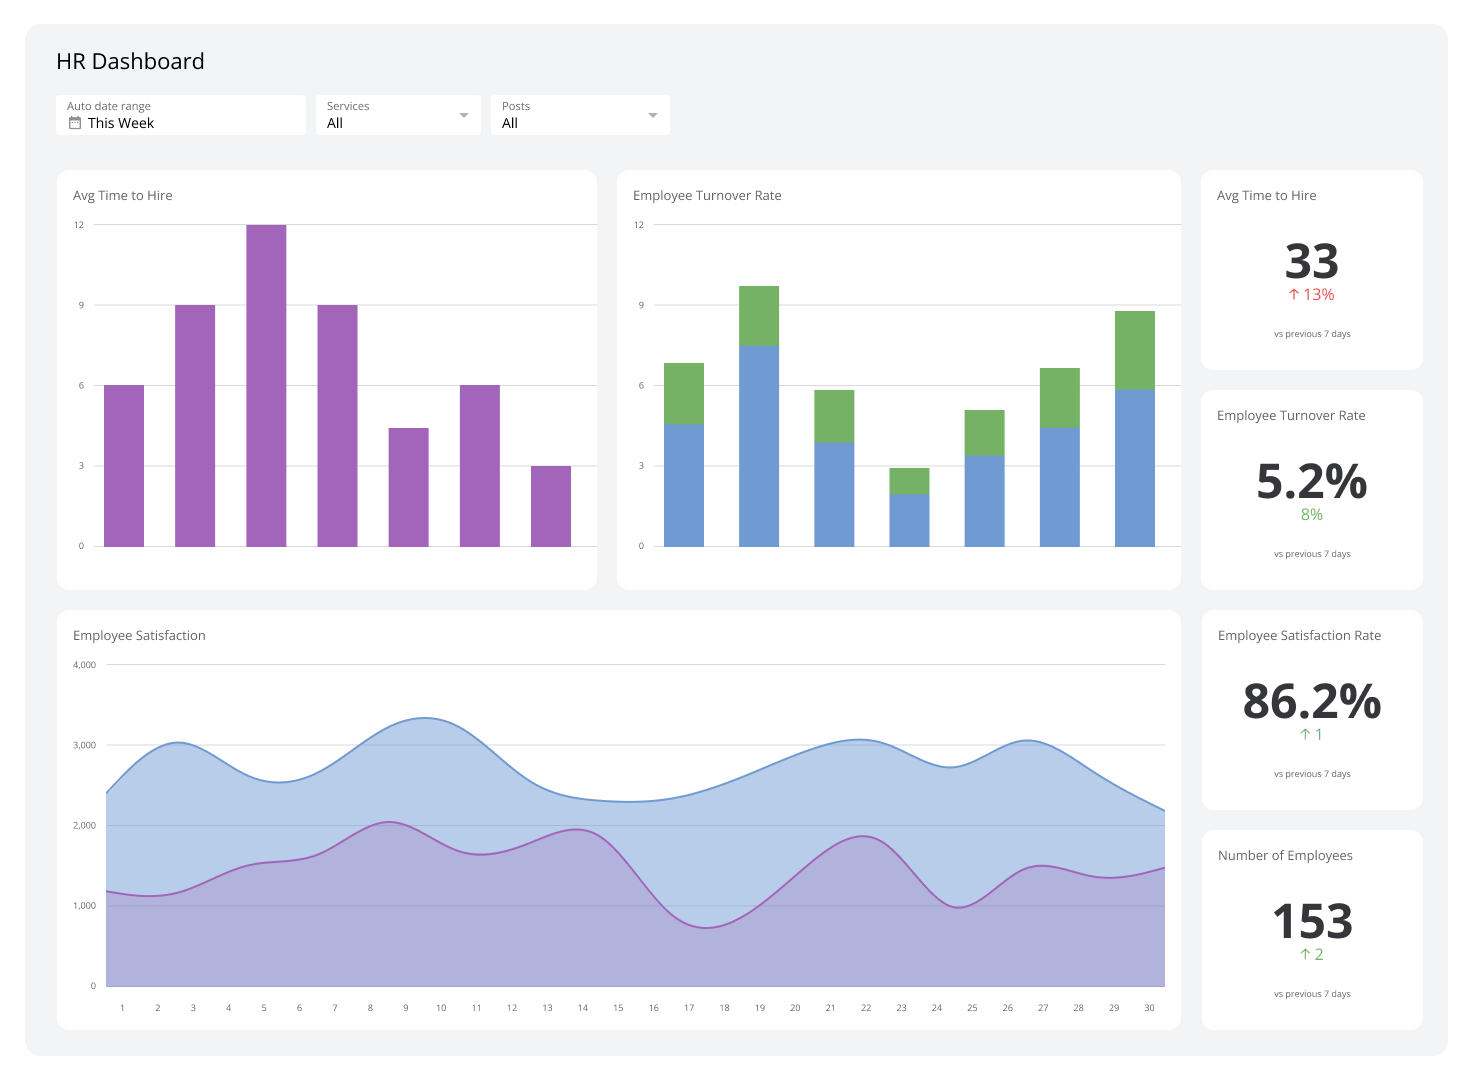
An HR dashboard gives you a real-time view of the metrics that matter most to your workforce: who's staying, who's leaving, and whether your people programmes are working.
What is an HR dashboard?
An HR dashboard gives you a real-time view of the metrics that matter most to your workforce: who's staying, who's leaving, and whether your people programmes are working.
HR dashboards pull data from your HR systems into one place, so you stop waiting for someone to run a report and start seeing what's actually happening. They cover everything from absenteeism and engagement to recruitment pipeline and pay equity. The result is fewer guesses, faster decisions, and a clearer picture of whether your team is set up to succeed.
Examples of HR dashboards
HR Overview Dashboard
An HR Overview Dashboard is a central hub for tracking workforce data: employee tenure, department performance, and headcount changes. It shows you the overall health of your workforce at a glance, so you're not piecing together numbers from three different spreadsheets or asking someone to pull a summary.
This dashboard surfaces trends you might otherwise miss, like when hiring volumes spike or where turnover is quietly climbing. If something needs attention, whether it's a skill gap or a department losing people faster than it's replacing them, you see it before it becomes a bigger problem.
| Who's it for | HR managers, HR analysts, recruiters, talent acquisition specialists, organizational development teams, payroll specialists, department heads, CHROs, senior executives, employee engagement teams |
|---|---|
| How often it's needed | Daily, weekly, monthly, quarterly, yearly |
| Covered KPIs | Employee headcount, turnover rate, employee retention rate, average time to hire, absenteeism rate, training completion rates, employee satisfaction scores, compensation distribution, workforce demographics, diversity and inclusion metrics, performance review outcomes, promotion rates, employee engagement scores, benefits utilization, payroll costs, overtime expenses, job vacancy rates, compliance metrics, succession planning progress, new hire retention rates |
Employee Performance Dashboard
An Employee Performance Dashboard tracks individual performance against targets and KPIs: completion rates, peer feedback, and ratings. It gives managers a consistent, reliable view of how each person is doing, so coaching conversations start from facts rather than impressions.
Live data means you can act quickly, whether that's scheduling a development conversation, adjusting targets, or recognizing someone who's outperforming. You're not waiting for a quarterly review to find out something went sideways two months ago.
| Who's it for | HR managers, team leaders, department heads, performance analysts, CHROs, senior executives, project managers, employee development specialists |
|---|---|
| How often it's needed | Daily, weekly, monthly, quarterly |
| Covered KPIs | Individual productivity levels, goal completion rates, task completion rates, employee utilization rates, attendance and punctuality, training and skill development progress, peer and manager feedback scores, performance review ratings, project contributions, sales or output targets, customer satisfaction scores tied to specific employees, error rates, initiative participation, leadership potential assessments, alignment with company objectives |
Employee Engagement Dashboard
An employee engagement dashboard tracks how connected and satisfied your people are: engagement survey results, retention rates, sentiment breakdowns, and participation in company initiatives.
Engagement data is easy to ignore when it lives in a survey tool nobody checks regularly. A dedicated dashboard keeps it visible, so you know when sentiment is shifting and can respond before people start looking elsewhere. It shows what's driving engagement and what's eroding it, giving you a clear basis for the initiatives worth investing in.
| Who's it for | Employee experience specialists, team leaders, organizational development professionals, HR managers, senior executives, employee satisfaction analysts, CHROs |
|---|---|
| How often it's needed | Daily, weekly, monthly, quarterly |
| Covered KPIs | Employee satisfaction scores, eNPS (Employee Net Promoter Score), turnover rates, retention rates, participation in surveys and feedback sessions, engagement in company initiatives, absenteeism rates, employee wellness program utilization, internal mobility rates, training participation rates, recognition and rewards frequency, workplace collaboration scores, sentiment analysis from employee feedback, stress and burnout indicators, alignment with company values and culture |
HR Dashboard Examples
- HR
Recruitment Dashboard
Track pipeline, time-to-hire, and Cost-Per-Hire in one view.
- HR
Employee Engagement Dashboard
Understand your team's morale and build a better workplace with data.
- HR
Diversity Dashboard
Diversity Dashboard
- HR
Training Dashboard
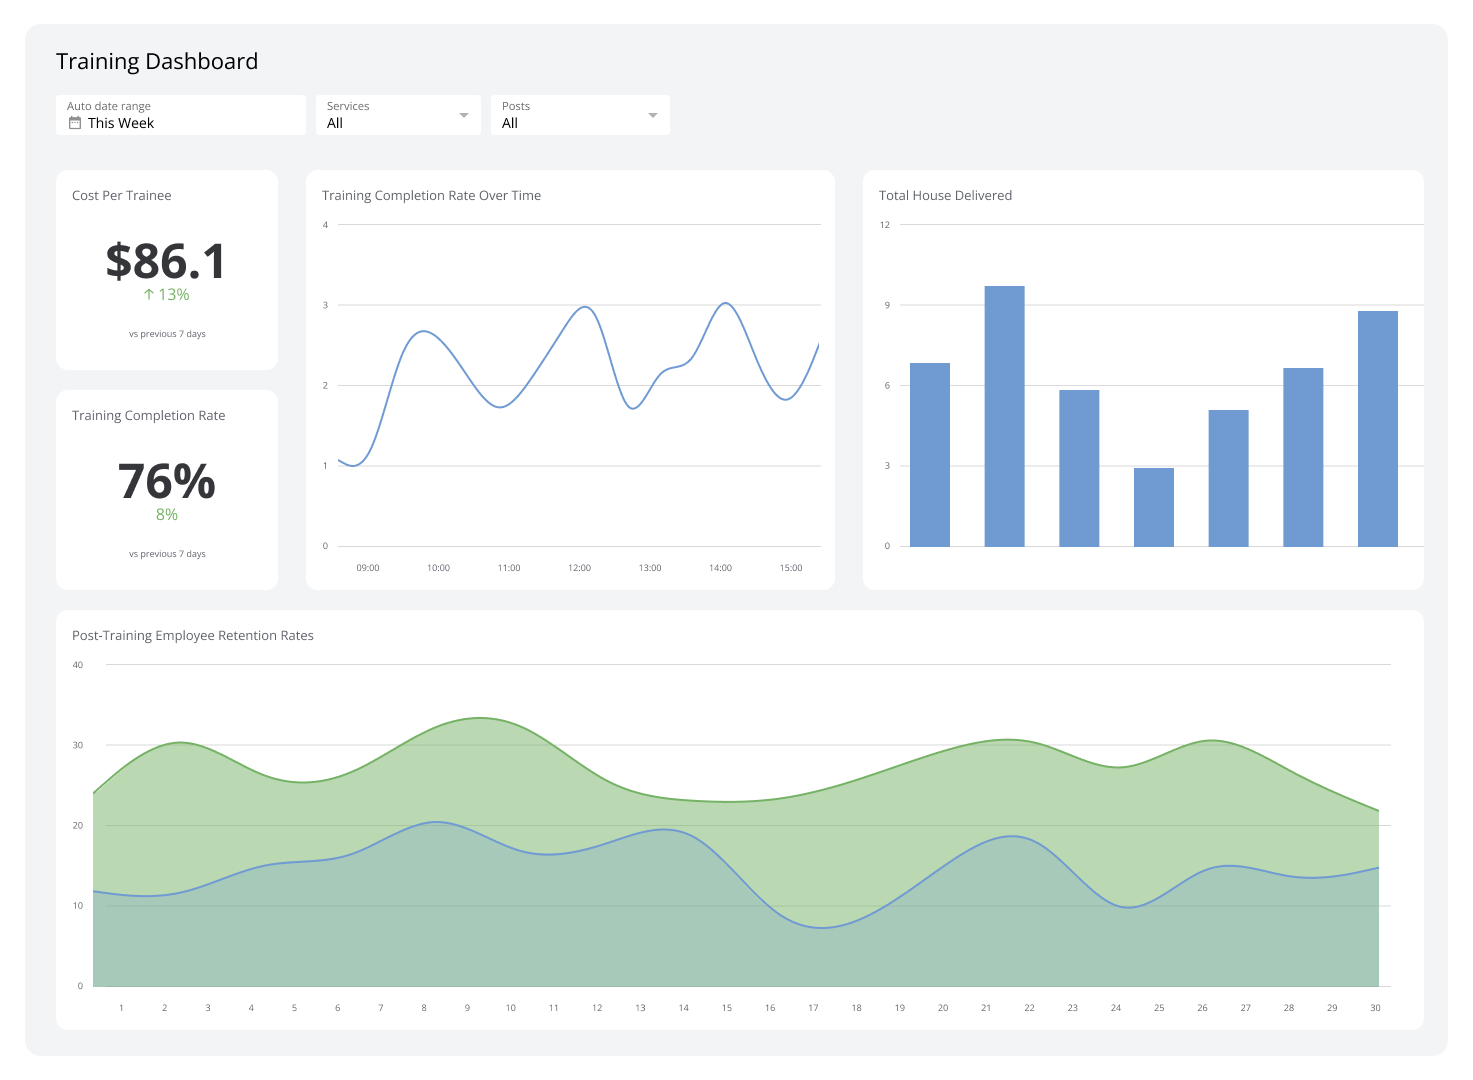
Track completion, costs, and impact across your training programs.
Diversity Dashboard
A diversity dashboard visualizes employee demographics across age, ethnicity, gender, and disability status. It surfaces metrics like leadership diversity, salary gaps, and recruitment trends so you can see exactly where your inclusion efforts are working and where they aren't.
Without this data in one place, it's easy to assume progress is happening when it isn't. The dashboard gives you a consistent, honest read on representation across your organization so your DEI commitments stay grounded in what the numbers actually show.
| Who's it for | Diversity and inclusion officers, HR managers, recruitment specialists, organizational development professionals, compliance officers, senior executives, CHROs |
|---|---|
| How often it's needed | Daily, weekly, monthly, quarterly, yearly |
| Covered KPIs | Demographic breakdowns by gender, age, ethnicity, and disability status, hiring and promotion rates by diversity category, representation across leadership roles, pay equity analysis, turnover rates segmented by demographics, employee satisfaction scores by group, participation in diversity training programs, employee resource group (ERG) membership, inclusivity survey results, recruitment pipeline diversity, retention rates for underrepresented groups, workplace accessibility metrics, supplier diversity metrics, alignment with DEI goals |
Recruitment Dashboard
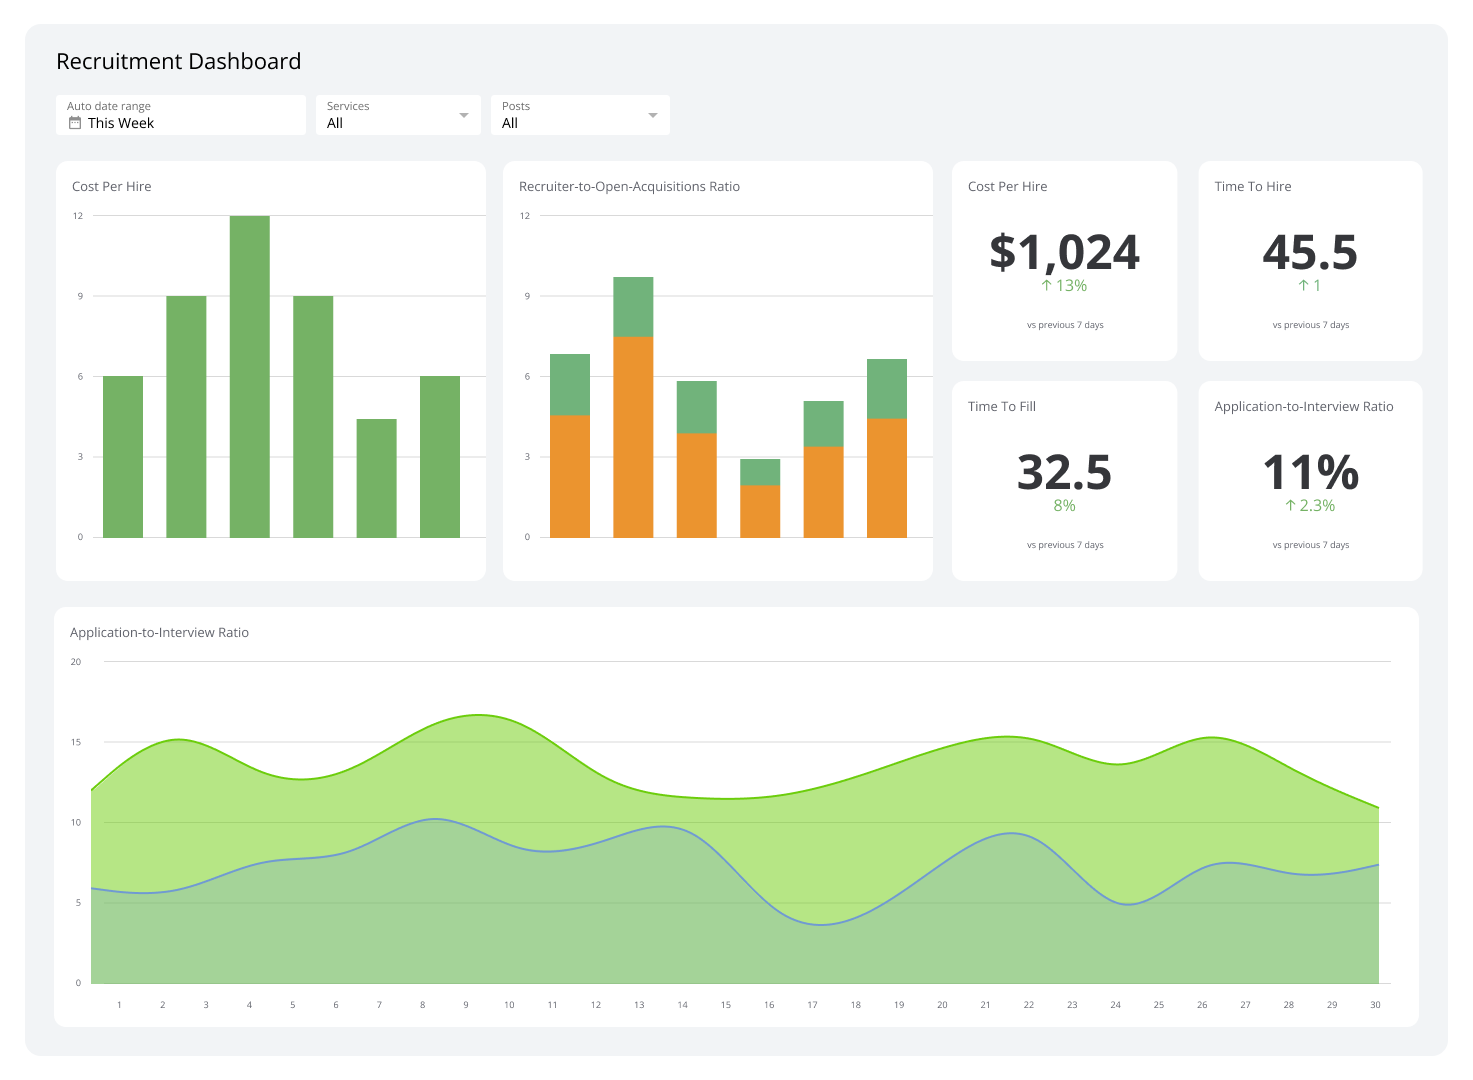
Recruitment dashboards give you a live snapshot of your hiring pipeline: time-to-hire, candidate satisfaction, offer acceptance rates, and recruiter efficiency. Instead of chasing updates from hiring managers or piecing things together from your ATS, you see where every role stands right now.
The dashboard also surfaces patterns you can act on, like seasonal hiring spikes that let you plan ahead, or bottlenecks in interview scheduling that are quietly slowing everything down.
| Who's it for | Talent acquisition specialists, HR managers, recruitment agencies, hiring managers, HR analysts, CHROs, senior executives overseeing workforce planning |
|---|---|
| How often it's needed | Weekly, monthly, quarterly, yearly |
| Covered KPIs | Open job requisitions, applicant volume per role, time-to-hire, cost-per-hire, candidate source effectiveness, application-to-interview ratio, interview-to-offer ratio, offer acceptance rate, recruitment funnel conversion rates, diversity in the candidate pool, quality of hire, candidate satisfaction scores, passive versus active candidate ratios, average time to fill positions, onboarding efficiency, retention rates of new hires, alignment with workforce planning goals |
Create custom dashboards for you and your team.
Get started with KlipsEmployee Development Dashboard
An Employee Development Dashboard monitors training, skill-building, and career progression across your organization. It brings together metrics like skill gap analyses, training participation rates, and employee feedback so you can see which programmes are delivering results and which aren't worth the investment.
This dashboard also shows whether employee growth is keeping pace with where the business is heading. That alignment matters: a team that's well-equipped for today's challenges is a competitive advantage, not just an HR metric.
| Who's it for | HR managers, learning and development (L&D) specialists, training coordinators, team leaders, department heads, CHROs |
|---|---|
| How often it's needed | Daily, weekly, monthly, quarterly |
| Covered KPIs | Training participation rates, training completion rates, average training hours per employee, training effectiveness scores, skills gap analysis, employee progress in competency development, certification completion rates, performance improvement post-training, budget utilization for training programs, e-learning module engagement rates, manager feedback on development programs, career progression rates, internal promotion rates, succession planning readiness, employee satisfaction with development opportunities |
Workplace Demographics Dashboard
A Workplace Demographics Dashboard breaks down workforce composition by job roles, experience levels, department sizes, and employee age. It gives you a broader picture of how your workforce is structured, which is different from what a diversity dashboard does.
Where a Diversity Dashboard focuses on equitable representation and recruitment equity, a Workplace Demographics Dashboard helps you understand trends that affect operations and succession planning. You can use it to spot staffing gaps before they become urgent and plan training or recruitment with the full picture in view.
| Who's it for | D&I specialists, recruitment teams, executives, compliance officers, department heads, HR managers |
|---|---|
| How often it's needed | Weekly, monthly, quarterly, yearly |
| Covered KPIs | Employee count by age group, gender distribution, ethnic or racial representation, educational qualifications, years of experience, job roles and levels, veteran status, disability representation, marital status, geographic distribution, part-time vs. full-time employee ratios, contractor vs. permanent employee ratios, new hires by demographic category, retention rates by demographic group, diversity hiring metrics, pay equity analysis across various groups |
Employee Turnover Dashboard
An Employee Turnover Dashboard tracks employee departures: overall turnover rates, voluntary vs. involuntary exits, and turnover by department. It also captures why people are leaving, whether for personal reasons, retirement, or lack of career development.
That context is what makes the dashboard useful. Knowing your turnover rate is one thing; knowing it's concentrated in a specific team, or that exit interviews consistently point to the same manager, tells you where to act. The dashboard gives you both the number and the story behind it.
| Who's it for | Talent acquisition specialists, department heads, HR managers, executives, workforce planners |
|---|---|
| How often it's needed | Weekly, monthly, quarterly, yearly |
| Covered KPIs | Total employee turnover rate, voluntary vs. involuntary turnover, turnover rate by department or team, turnover rate by job role or level, tenure of departing employees, reasons for leaving (exit survey analysis), retention rates, cost of turnover, new hire turnover rate, high-performer turnover rate, time to fill vacancies, demographic breakdown of turnover (age, gender, ethnicity), comparison of turnover rates to industry benchmarks |
Gender Salary Comparison Dashboard
A Gender Salary Comparison Dashboard shows pay distribution across genders, broken down by department, role, and other demographic factors. It makes salary disparities visible so you can act on them, rather than assuming pay equity is in place because no one has raised it.
For leaders who want a fair and inclusive workplace, this dashboard removes the guesswork. It tells you exactly where gaps exist and gives you the data to make a case for change, whether that's in a leadership conversation or a board report.
| Who's it for | HR managers, diversity and inclusion officers, payroll teams, executives, legal teams, compliance teams |
|---|---|
| How often it's needed | Weekly, monthly, quarterly, yearly |
| Covered KPIs | Average salary by gender, median salary by gender, salary range comparisons by job role and level, total compensation breakdown (including bonuses, benefits, and equity) by gender, gender pay gap percentage, salary distribution by department or location, proportion of men and women in leadership roles, tenure-to-salary analysis by gender, pay raise frequency and amount by gender, hiring salary comparisons by gender, promotions and associated pay increases by gender, salary trends over time segmented by gender |
Open Positions Dashboard
An Open Positions Dashboard gives you a live view of every active vacancy: organized by type, location, and priority so you know which roles are most urgent. You can see how many candidates are in the pipeline for each position and where they are in the hiring process, without having to ask your recruiter for a status update.
For lean HR teams managing multiple open roles at once, this dashboard replaces the manual tracking that tends to fall through the cracks.
| Who's it for | HR managers, recruitment teams, hiring managers, department heads, executives |
|---|---|
| How often it's needed | Real-time, daily, weekly, monthly, quarterly, yearly |
| Covered KPIs | Total number of open positions, open positions by department or location, average time-to-fill for current openings, number of candidates in the pipeline per position, stages of candidates in the hiring process, positions with the longest time-to-fill, cost-per-hire for open roles, average applications received per position, job posting performance metrics (views, clicks, and applications), priority or critical roles flagged as urgent, internal versus external hiring rates |
Terminations Dashboard
A Terminations Dashboard organizes employee exits by type: voluntary, involuntary, or retirement. It shows where turnover is concentrated and how long departing employees typically stayed, so you can see whether the issue is with onboarding, management, or something else entirely.
That breakdown matters because the right response depends on the pattern. A dashboard that surfaces those patterns consistently means you're making decisions based on what's actually happening, not on instinct or anecdote.
| Who's it for | HR managers, recruitment teams, department heads, executives |
|---|---|
| How often it's needed | Real-time, daily, weekly, monthly, quarterly, yearly |
| Covered KPIs | Total number of terminations (voluntary and involuntary), termination rate, terminations by department or location, reasons for termination (resignation, performance issues, layoffs), average tenure of terminated employees, exit interview insights, turnover by employee demographics (age, gender, tenure), cost of turnover, retention rate, rehire eligibility of terminated employees |
HR Compliance Dashboard
An HR Compliance Dashboard monitors your legal obligations in real time: wage distribution, workplace safety, employee certifications, and regulatory deadlines. It alerts you to gaps before they become violations, so compliance stays proactive rather than reactive.
For HR leaders accountable to legal and executive teams, this dashboard replaces the manual tracking that tends to surface problems too late. You get a clear view of what's current, what's overdue, and what needs attention now.
| Who's it for | HR managers, compliance officers, legal teams, senior executives |
|---|---|
| How often it's needed | Real-time, daily, weekly, monthly, quarterly |
| Covered KPIs | Compliance training completion rate, workplace safety incident reports, adherence to labour laws, employee benefits eligibility, legal audit results, employee certifications and licenses, diversity compliance metrics, adherence to internal policies and procedures, regulatory reporting deadlines, audit findings and corrective actions taken |
Absenteeism Dashboard
An Absenteeism Dashboard tracks attendance patterns across your organization: types of absence (sick leave, vacation, personal), frequency, duration, and which departments are most affected. It gives you the data to distinguish a one-off spike from a pattern that signals a deeper issue.
When absenteeism is concentrated in a specific team or role, that's often a signal worth investigating, whether it points to workload, management, or wellbeing. The dashboard keeps that signal visible so it doesn't get missed.
| Who's it for | HR managers, department heads, team leaders, executives |
|---|---|
| How often it's needed | Real-time, daily, weekly, monthly, quarterly |
| Covered KPIs | Total number of absences, absenteeism rate, absenteeism by department or location, absenteeism trends (seasonal, monthly), reasons for absenteeism (sick leave, personal leave, family emergencies), average duration of absence, patterns of frequent absenteeism, absenteeism by employee demographics (age, gender, tenure), impact of absenteeism on productivity, return-to-work rates |
Create custom dashboards for you and your team.
Get started with KlipsStop piecing it together, start knowing it
The numbers you need to lead your workforce well are already in your systems. The problem is they're scattered, stale by the time someone pulls them, or buried in a spreadsheet that only one person knows how to read.
Klipfolio's HR dashboards bring that data together in one place, updated automatically, and presented so the right people can act on it without waiting for a report. Try them out today.