Net Promoter Score (NPS)
NPS is a management tool that can be used to gauge the loyalty of a firm's customer relationships. It serves as a measure of how willing customers are to recommend a company's products or services to others.
Track all your Digital Marketing KPIs in one place
Sign up for free and start making decisions for your business with confidence.
Net Promoter Score =
Proportion of Detractor Scores - Proportion of Promoter Scores
What is a Net Promoter Score?
Net Promoter Score or NPS® is a measure of a customer's willingness to promote a product or service to colleagues and friends.
It is based on the results of a current customer survey, which asks respondents to answer the following question:
“(On a scale of 1-10) “how likely is it that you would recommend (brand or product X) to a friend or colleague?” (10 being ‘extremely likely’ and 1 being ‘not likely at all’)?”
Responses then are grouped as follows: 10s and 9s are brand “Promoters,” 8s and 7s are “Neutrals,” and any responses below 7 are brand “Detractors.”
NPS has grown to be an incredibly popular metric among marketing and customer support departments, valued for its simplicity and for its focus on customer satisfaction and loyalty as the prime measures of organizational performance. NPS can be an especially important metric to organizations focused on growth through account expansion or referrals - the “Viral Engine of Growth” in Eric Ries’ terms.
Net Promoter Score Example
- Detractors: 6 (4.8%)
- Neutrals: 64 (51.2%)
- Promoters: 55 (44%)
- Total: 125 (100%)
Net Promoter Score = 44% - 4.8% = 39.2
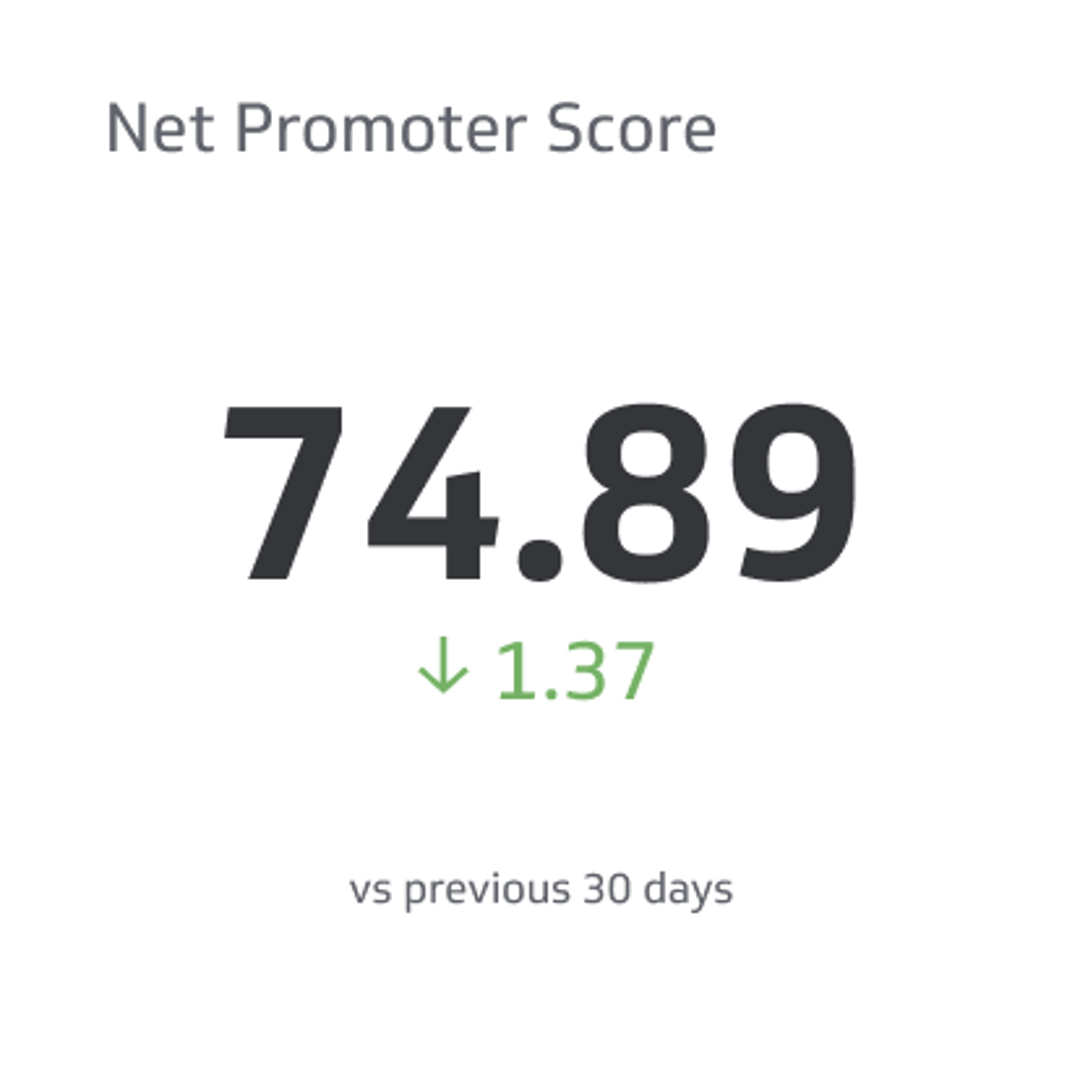
Here are two samples of NPS Klips we’re experimenting with at Klipfolio (A ‘Klip’ is our term for a visualization that places data in context and delivers business insights):

How Does NPS Compare To Other Customer Satisfaction Metrics?
When it comes to gauging customer satisfaction, businesses have several tools at their disposal. While the Net Promoter Score (NPS) is a popular choice, it's essential to understand how it stacks up against other metrics.
Customer Satisfaction Score (CSAT)
Customer Satisfaction Score (CSAT) evaluates a customer's immediate satisfaction with a particular interaction or transaction. It typically asks, "How satisfied were you with your experience?" and offers a scale from “Very Unsatisfied” to “Very Satisfied.” The score provides insights into specific touchpoints in the customer journey.
The metric is specific and can pinpoint particular areas of a business that need improvement. It's especially useful for assessing individual transactions or interactions.
However, it's a short-term metric and might not reflect a customer's overall sentiment or loyalty to a brand. CSAT scores can be influenced by recent events and might not capture long-term satisfaction.
To measure CSAT, ask customers to rate their satisfaction on a scale (e.g., 1-5 or 1-7) after a specific interaction or transaction. The CSAT score is the average rating, often converted to a percentage.
Customer Effort Score (CES)
CES gauges the ease with which customers can get their issues resolved or needs met. A common question might be, "How easy was it to get the help you needed?" The score reflects the efficiency and simplicity of processes from the customer's perspective.
One of its main strengths is that it can highlight friction points in the customer journey, helping businesses streamline processes and improve user experience. It's valuable for service-oriented businesses where ease of resolution is crucial.
However, like CSAT, CES is transactional and might not capture a customer's broader relationship or loyalty to a brand. It focuses on effort rather than emotion or sentiment.
Typically, you can gauge this by asking customers to rate the ease of their experience on a scale (e.g., "Very Difficult" to "Very Easy") after a service interaction. The CES score is the average rating across all responses.
Integrating NPS, CSAT, and CES for better customer insights
While each of the metrics - NPS, CSAT, and CES - offers unique insights into different facets of the customer experience, using them in tandem can provide businesses with a more holistic view of customer satisfaction.
Start with NPS to gauge the overall loyalty and sentiment of your customer base. It helps you understand the bigger picture – are your customers willing to recommend you? If your NPS is low, it indicates a need for broader strategic changes, while a high NPS suggests that your overarching business strategies are resonating well with your customers.
Then, leverage CSAT to help you zoom in on specific interactions. Measure CSAT across various touchpoints:
- Post-purchase
- Post-support
- After using a new feature
This way, you can identify areas that excel and those that need improvement. It's a great way to get actionable feedback on distinct aspects of your business.
Next, use CES to gain insights into the ease of interaction with your business. Are customers facing hurdles when trying to resolve issues or access services?
A low CES indicates friction in the customer journey, suggesting areas that need streamlining. On the other hand, a high CES means customers find it easy to interact with your business, which can lead to increased loyalty.
Analyze the results of all three metrics together to get a 360-degree view of their customer experience. For instance, if NPS is high but CES is low, it might indicate that while customers love your product, they find it challenging to get support or navigate certain processes.
Conversely, a high CSAT for a specific feature but a low NPS might suggest that other overarching issues affect customer loyalty while the feature is appreciated. Regularly measuring and comparing these metrics allows businesses to track the impact of changes and improvements.
Net Promoter Score Benchmarks
There are many online resources to provide your company with an NPS benchmark. Net Promoter Network provides the following list of Average NPS by Industry:
Highest Scores:
- Department & Specialty Stores: 58
- Brokerage & Investments: 45
- Table Computers: 44
- Smartphones: 40
Lowest Scores:
- Software & Apps: 19
- Health Insurance: 12
- Cable/ Satellite TV Service: 3
- Internet Service: -3
When it comes to NPS, clearly, the higher the number, the better, but there are no definitive benchmarks for SaaS companies. Here’s some expert advice and rules of thumb:
- According to surveys completed in 2015, the average NPS for software companies of all sizes is 23.
- Surveys completed by software companies range from 91 to 1, with a lot of companies reporting net promoter scores between 20 and 40.
- The average NPS of all Survey Monkey clients who use NPS is 31, according to their NPS Benchmark Report.
Not listed? Not a problem! Search the Net Promoter Score benchmark for your company, tag, or industry on NPS Benchmarks.
Factors Influencing NPS
The NPS is a powerful metric, but you should be aware of what influences it. Understanding these factors can help businesses interpret their score more effectively and take appropriate actions to enhance customer experiences.
Here are 10 factors that can impact NPS:
Product quality and reliability
The most direct influence on NPS is the quality and reliability of a product or service. If customers consistently encounter issues or find the product doesn't meet their expectations, they're less likely to recommend it to others.
Moreover, maintaining consistent product quality is paramount. This is particularly true today, where word-of-mouth and online reviews play a crucial role in purchasing decisions. Companies that prioritize quality assurance and continuous improvement often see a positive correlation with their NPS.
Customer service experience
Poor customer service can significantly drag down NPS even if a product is top-notch. Quick response times, knowledgeable support staff, and a genuine commitment to resolving issues can boost customer satisfaction and NPS.
In many instances, a customer's interaction with support can leave a lasting impression, sometimes even overshadowing the product experience itself. Investing in training and empowering customer service teams can lead to enhanced customer loyalty.
Pricing
The perceived value for money can influence NPS. Customers who feel they're getting excellent value are more likely to promote the product or service. Conversely, they might detract if they deem it overpriced for the value delivered.
Businesses must strike a balance between offering competitive pricing and delivering unmatched value. Regular market research and understanding customer price sensitivity can guide pricing strategies that align with customer expectations.
Brand reputation
A brand's overall reputation in the market can sway NPS. Negative news or controversies can lower scores, while positive publicity and corporate social responsibility initiatives can enhance it. Proactive public relations and community engagement can help mitigate potential reputation risks.
User experience (UX)
The ease of use and overall experience of interacting with a product, service, or platform can significantly impact NPS. A seamless and intuitive UX can lead to higher scores.
Ensuring a cohesive and user-friendly experience across all platforms becomes essential as digital touchpoints multiply. Regular user testing and feedback loops can help businesses refine their UX, leading to increased customer satisfaction.
Communication and engagement
How a company communicates with its customers, engagement frequency, and relevance of the content shared can influence NPS. Transparent, honest, and timely communication can foster trust and loyalty.
Personalized communication, understanding customer preferences, and offering relevant content can enhance the overall customer relationship. Doing so can lead to higher NPS scores.
Market trends and external events
External factors, such as economic downturns, global events, or industry-specific trends, can influence customer sentiment and, in turn, NPS.
Staying agile and adapting to these external changes. Meanwhile, keeping customers informed can help maintain or even improve NPS during challenging times.
Competitor actions
If competitors introduce innovative features, aggressive pricing, or superior customer service, it can set new industry standards and affect a company's NPS. Regular competitor analysis and staying ahead of industry trends can help businesses remain competitive and maintain a high NPS.
Post-purchase experience
The experience after the purchase, including onboarding, training, and value-added services, can be crucial in determining NPS. Ensuring customers smoothly transition from purchase to usage and derive maximum value from their purchase can lead to higher satisfaction levels and positive recommendations.
Feedback implementation
How a company acts on the feedback received can influence future NPS. Customers appreciate when their feedback is taken seriously, which leads to tangible improvements. Creating a feedback loop where customers see their suggestions being implemented fosters a sense of belonging and trust, enhancing overall loyalty and NPS.
Net Promoter Score Challenges
Without a plan to monitor and act on information obtained through net promoter scoring, NPS is useless, and you’ve disrupted your customer base for no good reason.
Developing, executing, and extracting value from NPS surveys is not without its challenges. These can include:
Reaching a broad customer base
One of the primary challenges in NPS is distributing the survey to a vast customer base without coming off as intrusive or bothersome. Striking the right balance ensures customers are willing to provide feedback without feeling overwhelmed.
Different customer segments may have varying preferences for communication. While some prefer email surveys, others respond better to in-app prompts or SMS. Understanding and tailoring the survey distribution method to each segment can enhance response rates and ensure that feedback is comprehensive.
Communicate the purpose of the survey clearly to the respondents. Customers are more likely to participate willingly when their feedback is used to enhance products or services, not just for marketing purposes.
Ensuring a meaningful response rate
A significant response rate is crucial for NPS results to be genuinely insightful. A low response rate can skew the data, making it less representative of the broader customer sentiment.
Offering incentives, whether in the form of discounts, exclusive content, or loyalty points, can motivate more customers to take the survey. This boosts response rates and can enhance the overall customer experience.
A well-designed, concise, and user-friendly survey can significantly impact response rates. Ensuring the survey is mobile-responsive, has a clear call to action, and is easy to complete can encourage more customers to provide feedback.
Getting real-time feedback for immediate action
Now that consumers can share their sentiments online right away, getting real-time NPS feedback can be invaluable. It allows businesses to act swiftly, addressing concerns and instantly leveraging positive feedback.
Businesses can immediately flag and address specific customer concerns by integrating NPS tools with CRM systems. This seamless integration ensures that no feedback falls through the cracks and that every customer concern is addressed promptly.
Advanced analytics and AI tools can help businesses instantly analyze NPS feedback, identifying patterns and trends. This immediate insight allows companies to make data-driven decisions quickly, ensuring they stay ahead of any potential issues.
Performing continuous monitoring
Many companies fall into the trap of periodic and ad hoc NPS reporting. This sporadic approach can lead to missed trends and insights, reducing the metric's overall effectiveness.
Instead of waiting for periodic reports, businesses should aim for continuous monitoring of NPS. This proactive approach ensures that companies are always in tune with their customers' sentiments.
To truly benefit from NPS, it's essential to delve deeper than surface-level metrics. Businesses can gain a holistic view of their performance by understanding the reasons behind scores and integrating them with other metrics like Customer Referral Rate. For more on the NPS vanity trap, see Beyond Vanity Metrics: NPS and Customer Referral Rate.
Net Promoter Score Best Practices
In order to better understand your customers, you should implement the Net Promoter Score (NPS) into your business strategy. Following a few best practices is important to make this metric valuable and accurate.
It not only makes your NPS surveys more effective, but it also makes sure the feedback you get turns into real action. Here are a few best practices to keep in mind:
Start with clear objectives
Before deploying an NPS survey, it's essential to understand why you're asking for feedback and how you plan to use the information. This clarity will guide the survey design and your subsequent actions based on the results.
A clear objective streamlines the feedback process and ensures the collected data aligns with your business goals. Setting specific targets lets you measure the effectiveness of your NPS strategy and make necessary adjustments to enhance customer satisfaction.
Segment your audience
Not all customers have the same experiences or perspectives. Segmenting your audience allows you to tailor your surveys to different groups, ensuring more relevant and actionable feedback.
Segmentation goes beyond just tailoring surveys. You must understand the unique needs and preferences of different customer groups. This way, you can offer personalized experiences, leading to increased loyalty and better overall satisfaction.
Use a consistent scale
Always use the same scale to ensure that your NPS results are consistent and comparable over time. Whether you choose a scale of 1-10 or 1-5, you should make sure to use the same one when gathering scores.
A uniform scale maintains data collection consistency and ensures respondents are familiar with the rating system. Familiarity can lead to more honest feedback, as customers can easily relate their experiences to the scale provided.
Include open-ended questions
While the primary NPS question is quantitative, including a few open-ended questions can provide deeper insights into the reasons behind a score. This type of question serves as a platform for customers to voice their concerns, praises, or suggestions. These qualitative insights reveal underlying issues or opportunities that a simple score might overlook.
Act on the feedback
Collecting feedback is just the first step. You must also analyze the results, identify areas for improvement, and take concrete actions based on the insights.
Taking action demonstrates a company's commitment to its customers. Addressing concerns and implementing changes allows businesses to foster trust and show customers that their feedback genuinely matters.
Communicate changes to customers
Let your customers know that their feedback is valued. Communicate this back to them if you make changes based on their suggestions. It shows that you listen and care about their opinions.
Transparency in communication strengthens the bond between a brand and its customers. Keep them informed about the changes made based on their feedback. As a result, businesses can reinforce the idea that they value customer opinions.
Re-survey at regular intervals
Customer sentiments can change over time. Regularly re-surveying ensures that you stay updated with current customer perceptions and can track changes in satisfaction and loyalty.
Consistent feedback helps businesses stay aligned with evolving customer needs. When you understand customer sentiment dynamics, you can proactively address issues and adapt to the shifting market landscape.
Incentivize survey participation
To boost response rates, consider offering incentives for completing the survey. This could be in the form of discounts, loyalty points, or exclusive content.
Incentives motivate customers to participate and convey appreciation for their time and effort. Recognizing and rewarding their contribution can enhance the overall survey experience and foster positive brand sentiment.
Integrate NPS with other metrics
As mentioned above, while NPS provides insights into customer loyalty, integrating it with other metrics like Customer Satisfaction Score (CSAT) or Customer Effort Score (CES) can give a more holistic view of the customer experience.
A comprehensive understanding of customer experience requires a multi-faceted approach. When you consider NPS with other metrics, you can identify patterns and draw more accurate conclusions. Moreover, you can devise strategies catering to various customer journey aspects.
Educate your team
Ensure that everyone in your organization understands the importance of NPS and how it's calculated. This collective understanding will foster a more customer-centric culture and drive efforts to improve the score.
An informed team is an empowered team. By ensuring that every member understands the nuances of NPS, businesses can cultivate a unified approach toward enhancing customer satisfaction and loyalty.
How to Monitor Net Promoter Score in Real-time
Monitoring your Net Promoter Score (NPS) in real-time is essential for businesses that want to stay agile and responsive to customer feedback. Here's how you can effectively keep an eye on your NPS:
Use NPS software solutions
Numerous software solutions are available that specialize in real-time NPS tracking. These platforms collect and display scores and offer analytics tools to dissect the data, helping you understand the reasons behind the scores.
Many of these software solutions also come with features that allow for easy integration with other business tools. This ensures a seamless flow of data for continuous monitoring. They also often provide historical data analysis. As such, businesses can track their NPS trends over time and assess the effectiveness of their customer satisfaction strategies.
Set up alerts
Set up automated alerts to ensure you never miss significant shifts in customer sentiment. If your NPS drops or spikes suddenly, immediate notifications can help you react promptly, addressing potential issues or capitalizing on positive feedback.
These alerts can be customized based on thresholds you set, ensuring that only the most critical changes trigger a notification. This proactive approach ensures that you're always one step ahead, ready to take action when it matters most.
Visualize data with dashboards
Dashboards visually represent your NPS data, making it easier to interpret and analyze. Consolidating data into easy-to-read graphs and charts lets quickly gauge customer sentiment at a glance.
Furthermore, modern dashboards are interactive, allowing users to drill down into specific data points, compare different time periods, and even forecast future trends. This level of detail and flexibility empowers businesses to make informed decisions based on real-time insights.
Learn more about how to track your Net Promoter Score on a Digital Marketing Dashboard.
Integrate with other systems
Combine your NPS data with other systems like CRM or customer support platforms. This integration provides a holistic view of the customer experience, allowing you to identify correlations between NPS and other key performance indicators.
Having a unified platform lets you spot patterns easily, such as how specific customer interactions or marketing campaigns influence NPS. This interconnected data ecosystem ensures that every decision is backed by comprehensive insights from multiple touchpoints.
Encourage team engagement
Make your NPS data accessible to relevant teams. Whether it's customer support, sales, or marketing, ensuring everyone is aware of the current NPS can foster a more customer-centric approach.
Regular team meetings or workshops centered around NPS data can spark discussions and foster collaborative solutions. Having everyone aligned to understand the importance of customer feedback creates a cohesive strategy that prioritizes customer satisfaction across all departments.
Regularly review and adjust
As you gather more data, take the time to review your monitoring processes. Are there more efficient ways to track your NPS? Are there new tools or methods you should consider? Regular reviews ensure that your monitoring process remains effective and up-to-date.
It's also an opportunity to reassess your goals, ensuring that your NPS strategy aligns with broader business objectives. You must stay adaptable and open to change. This way, you can leverage the best tools and methodologies to keep your finger on the pulse of customer sentiment.
Your Compass To Customer Satisfaction
NPS provides businesses with insights into customer loyalty. Analyzing factors like product quality and service allows companies to refine their customer experience. Moreover, combining NPS with metrics like CSAT and CES offers a holistic view of the customer journey. Continuous monitoring of this feedback should be implemented for growth and to maintain a customer-focused approach.
Net Promoter Score: Top Resources
The Smart Marketer’s Guide to Net Promoter Score (NPS), Iona Lupec
Net Promoter Score(NPS)-a balanced view, Customer Champions
Why NPS is a growth-focused KPI, Christian Reni
To gain deeper insights into your overall marketing performance, be sure to explore our comprehensive guide on vital digital marketing metrics that complement your Net Promoter Score (NPS) analysis and drive informed decision-making.
Related Metrics & KPIs