Business Dashboards
Business dashboards help you monitor your business's state by consolidating all related metrics and KPIs in easily understandable, interactive charts, graphs, and tables.
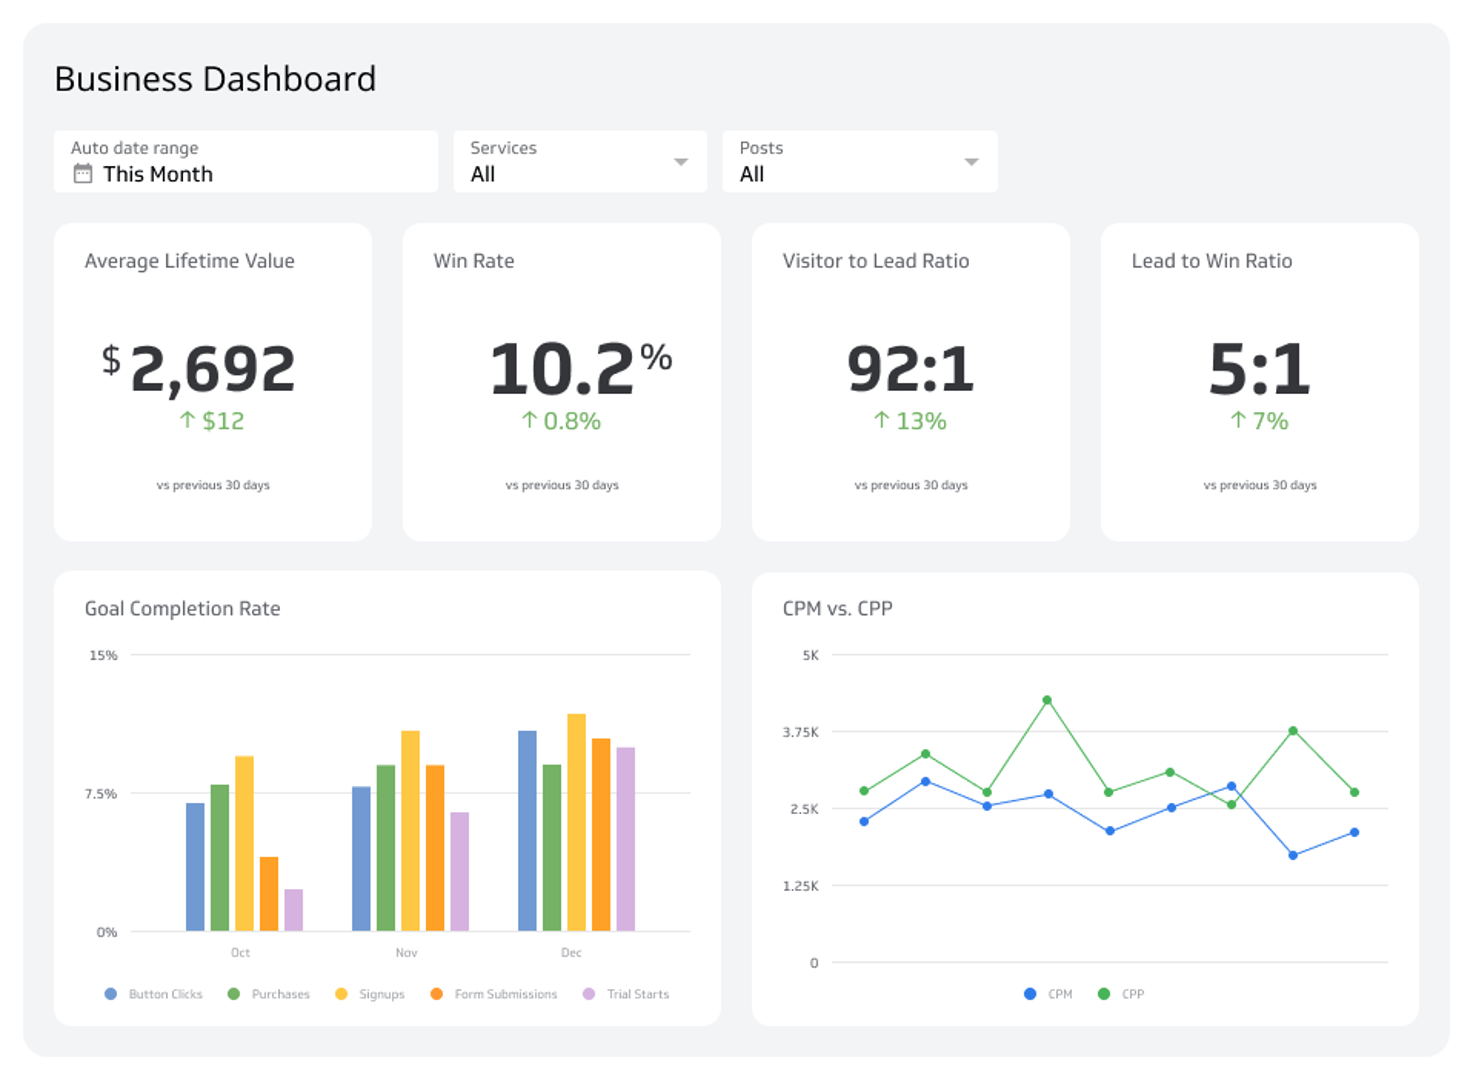
What is a Business Dashboard?
A business dashboard gathers information from numerous sources, such as data warehouses, published reports, web-based services, and artificial intelligence. This information is often fed to you in real time, meaning you can rapidly respond to trends, market shifts, and issues regarding team or individual performance.
Getting regular updates from your business dashboard will help you acquire a dynamic view of your business landscape. For instance, viewing real-time sales figures enables you to acknowledge demand spikes, what is driving these spikes, and which of your offerings is selling the most.
Knowing this, you can make changes like expanding inventory before seasonal demand increases, ensuring you won’t run out of stock and lose buyers to your competitors in the marketplace.
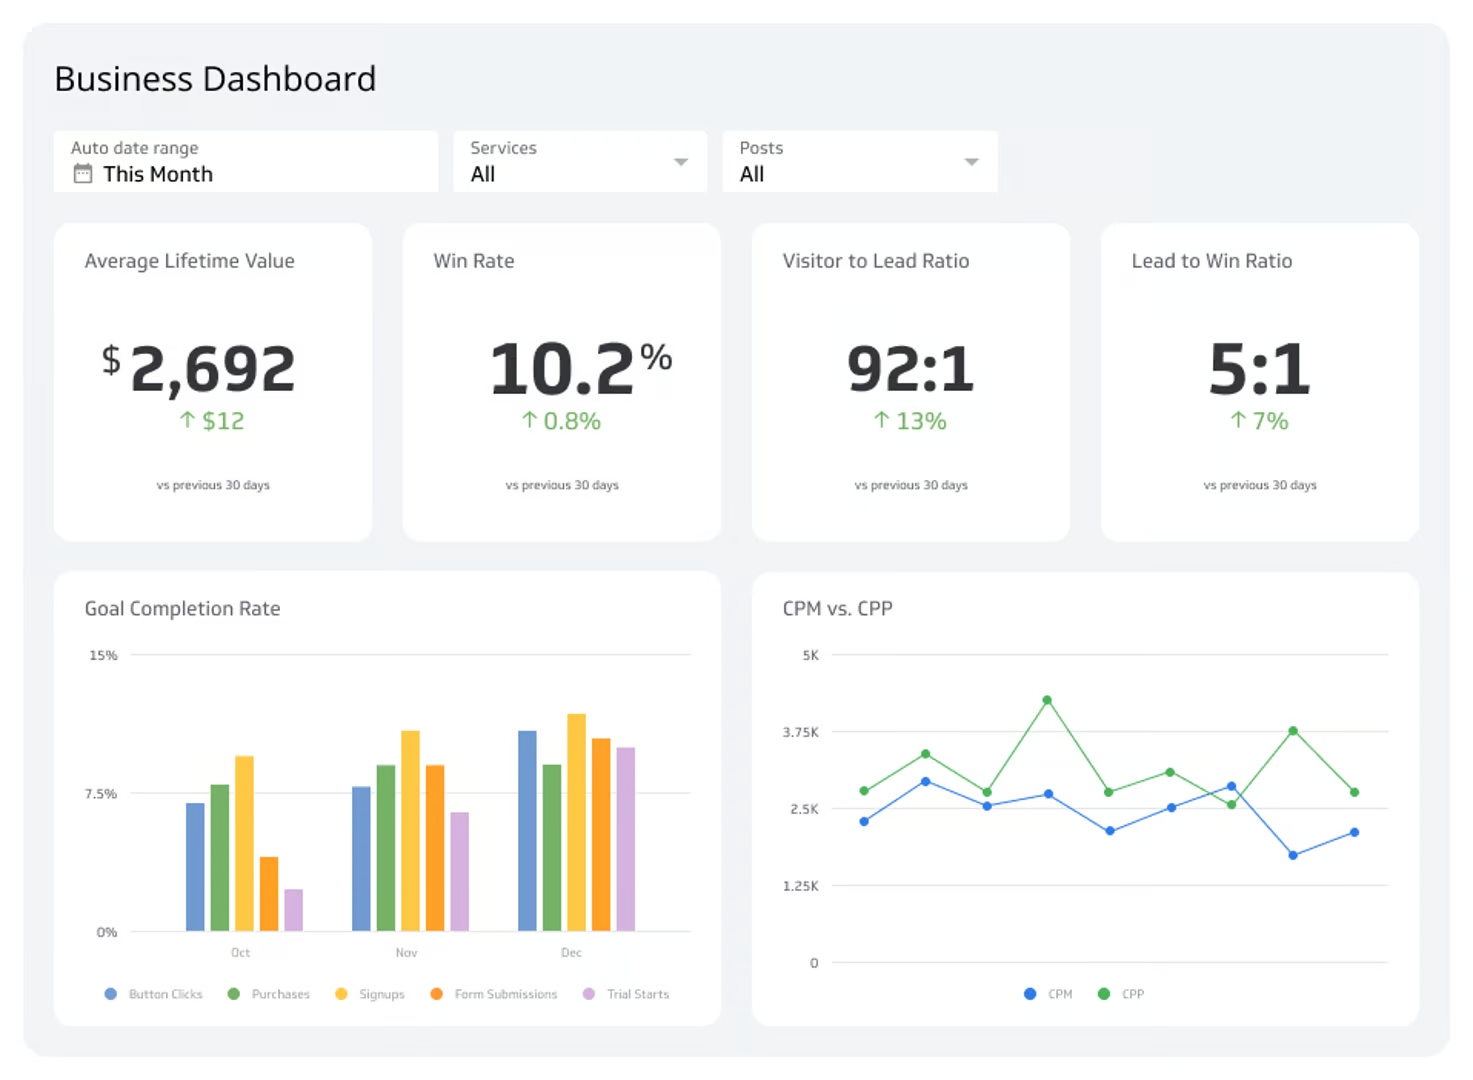
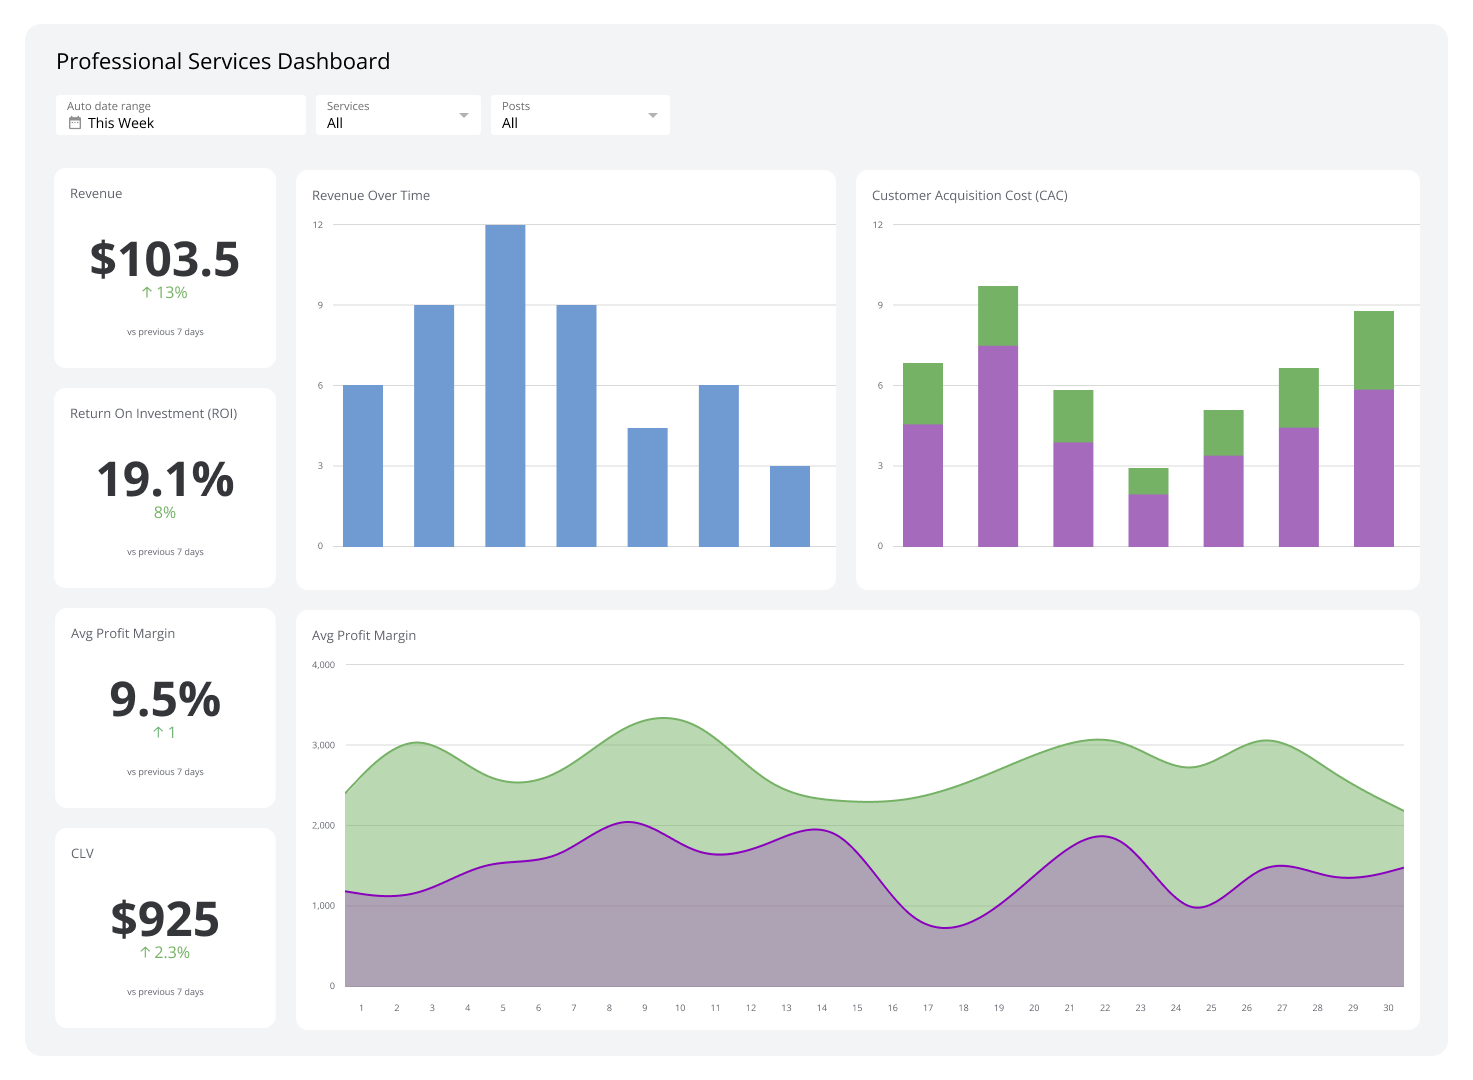
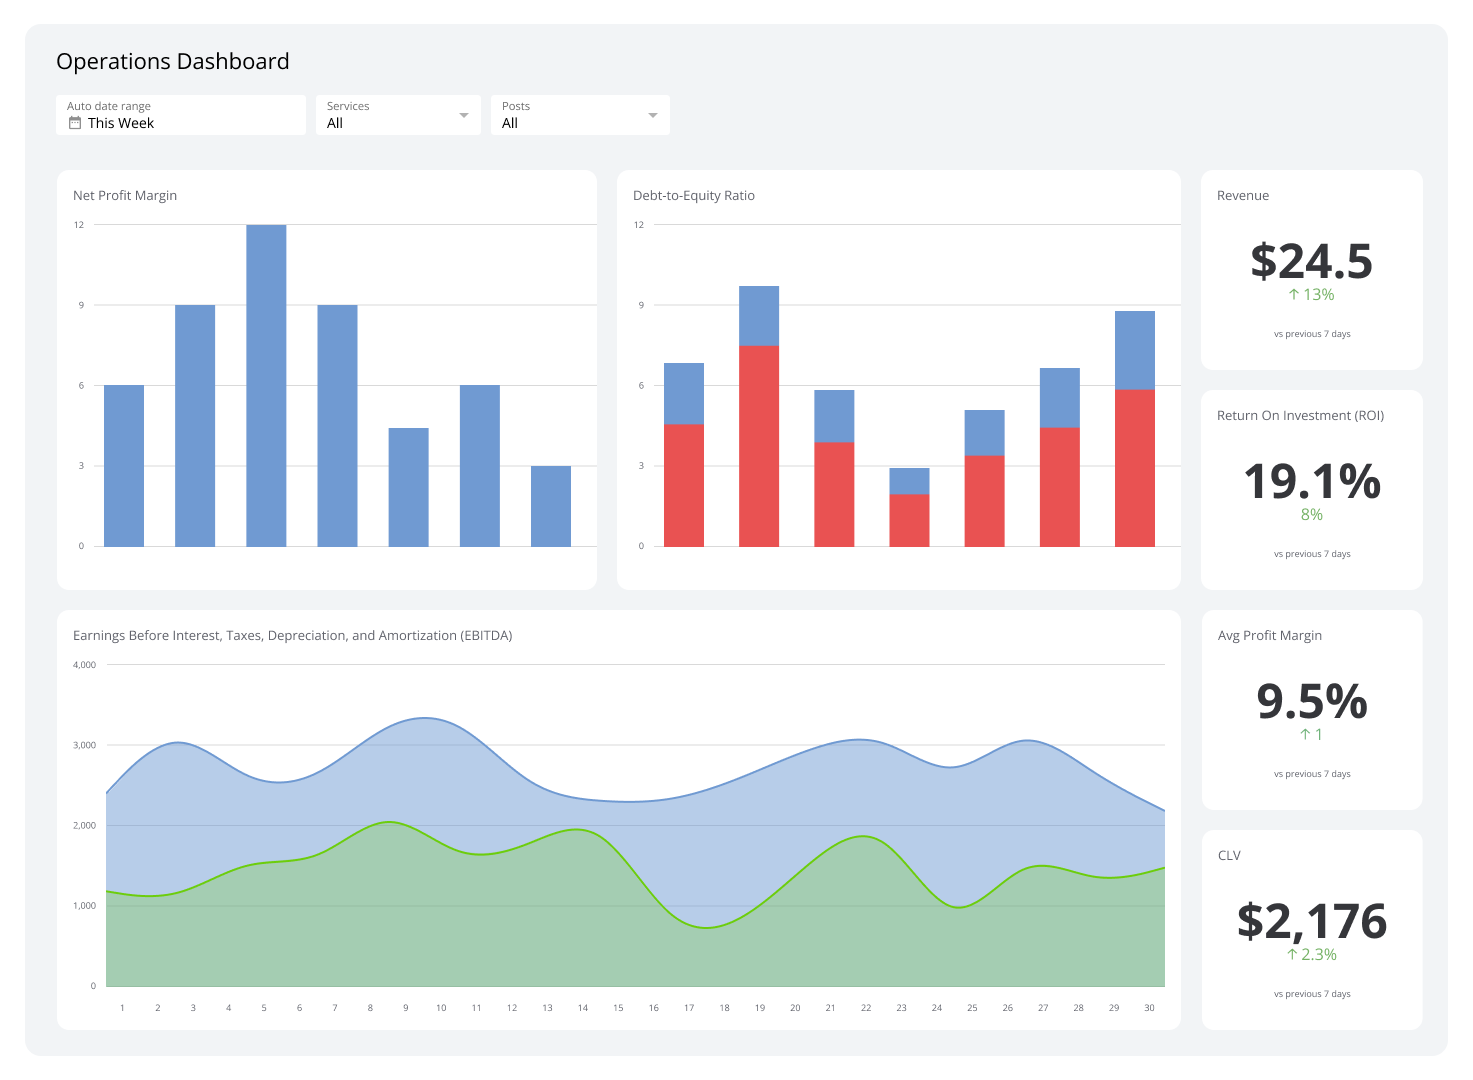
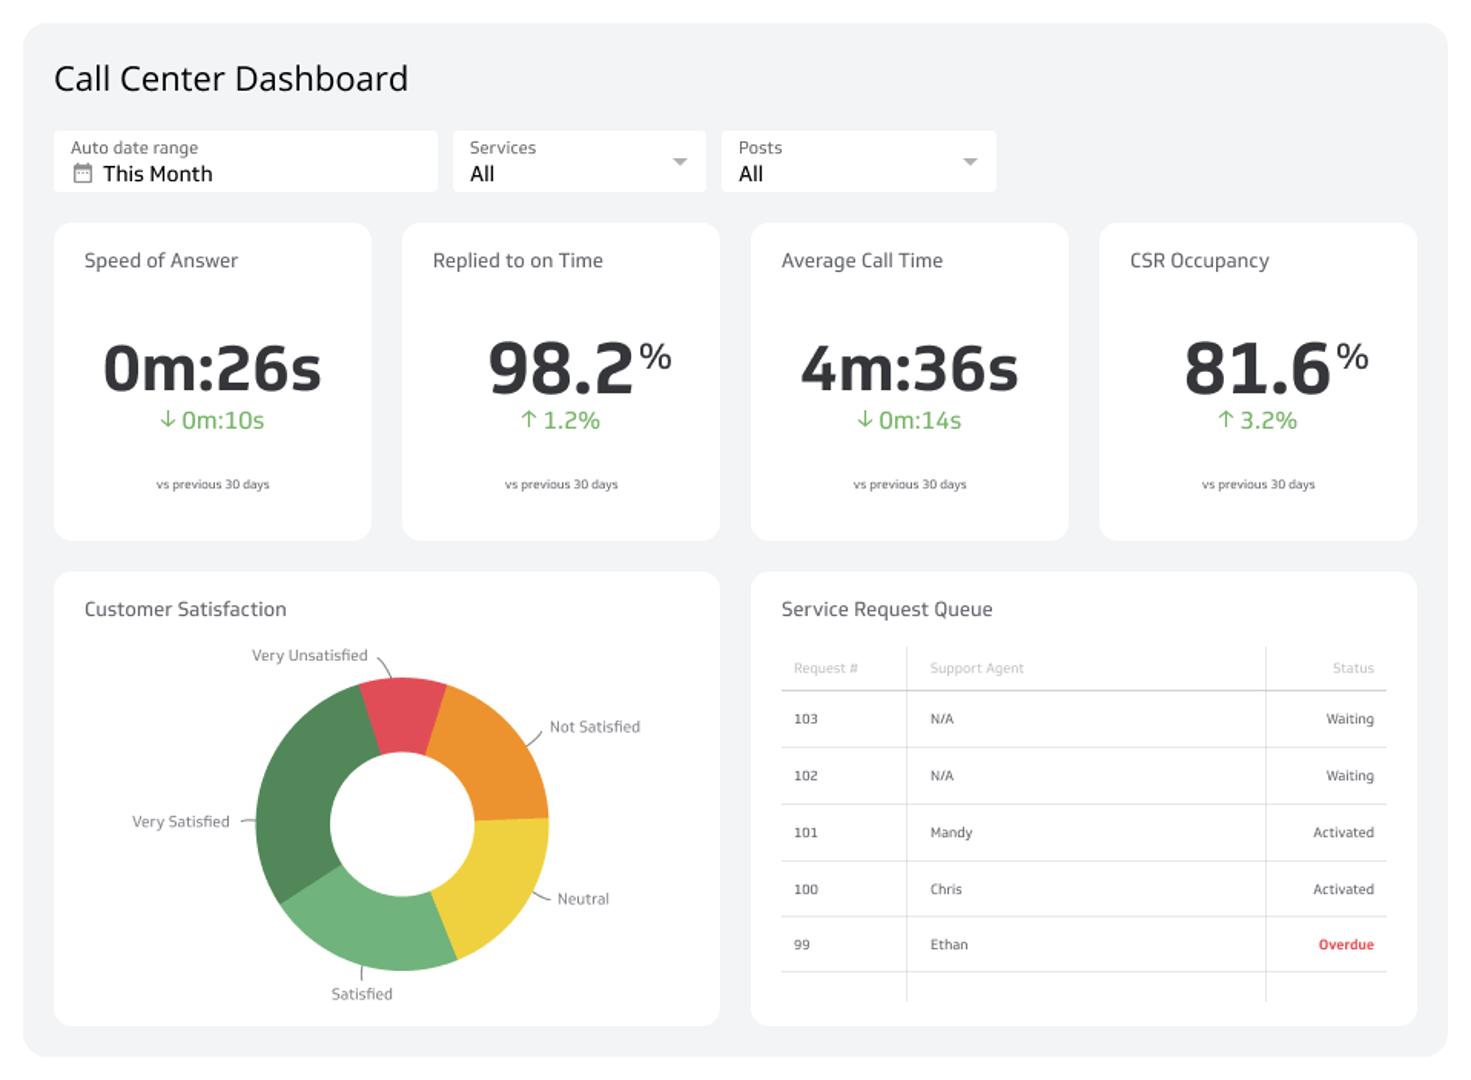
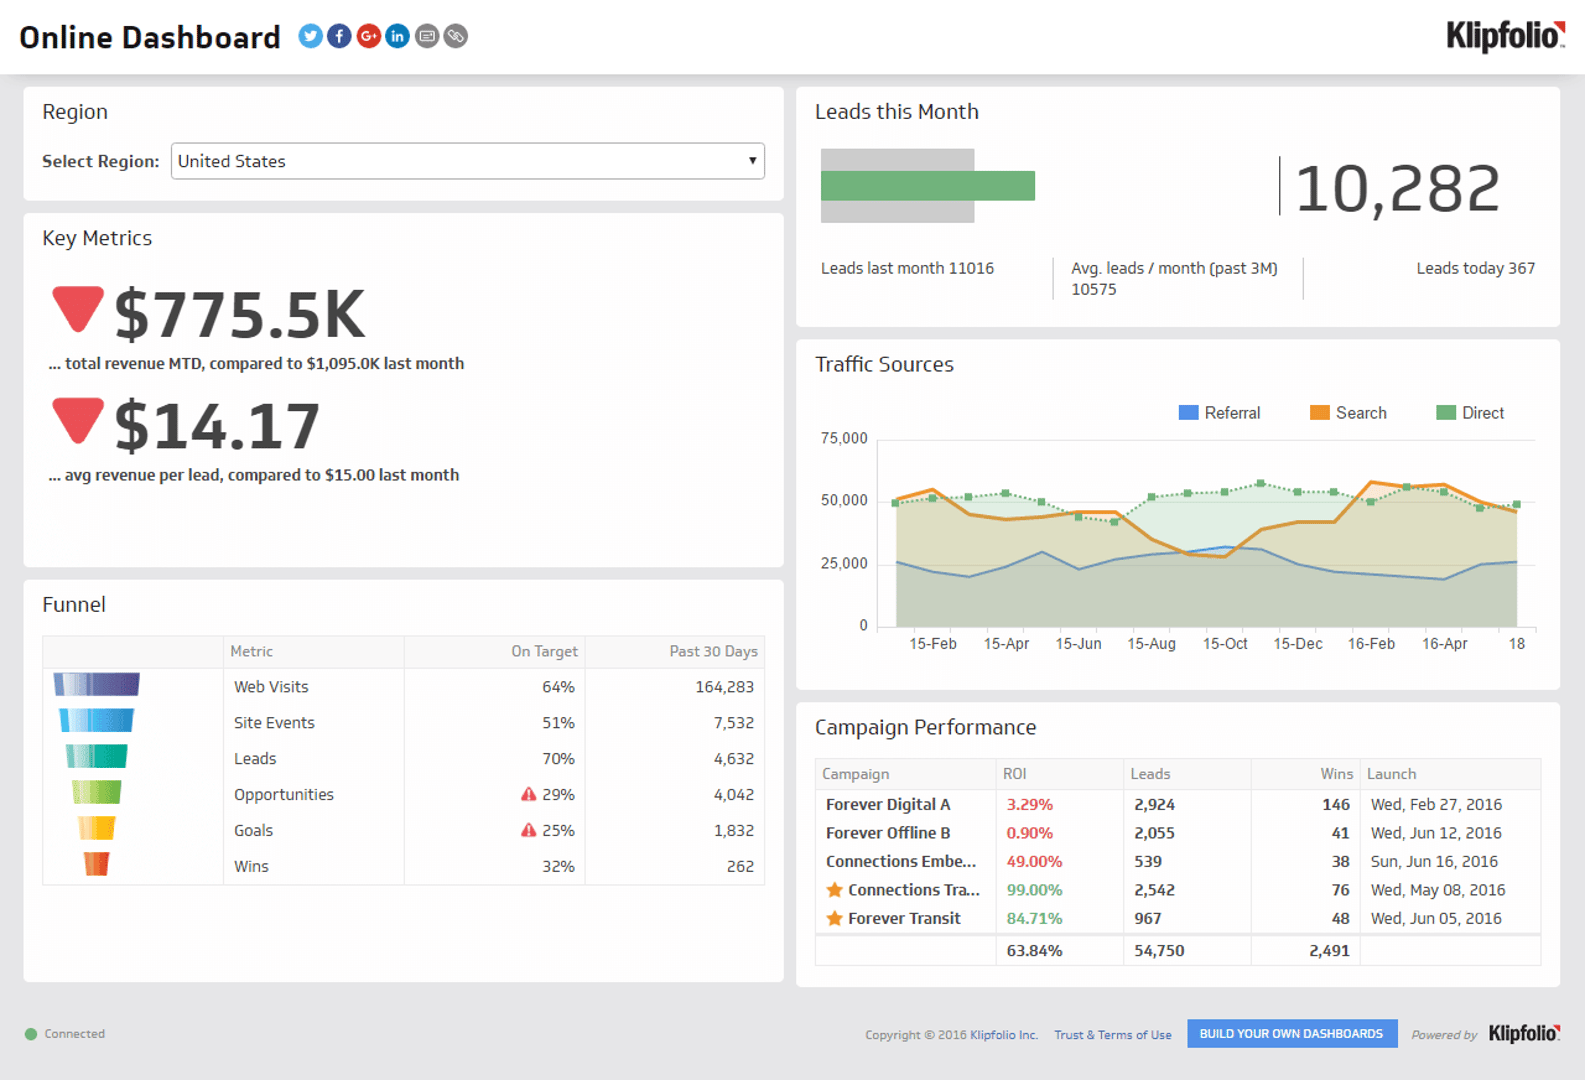
Business Dashboard Examples
View all dashboard examples- Business
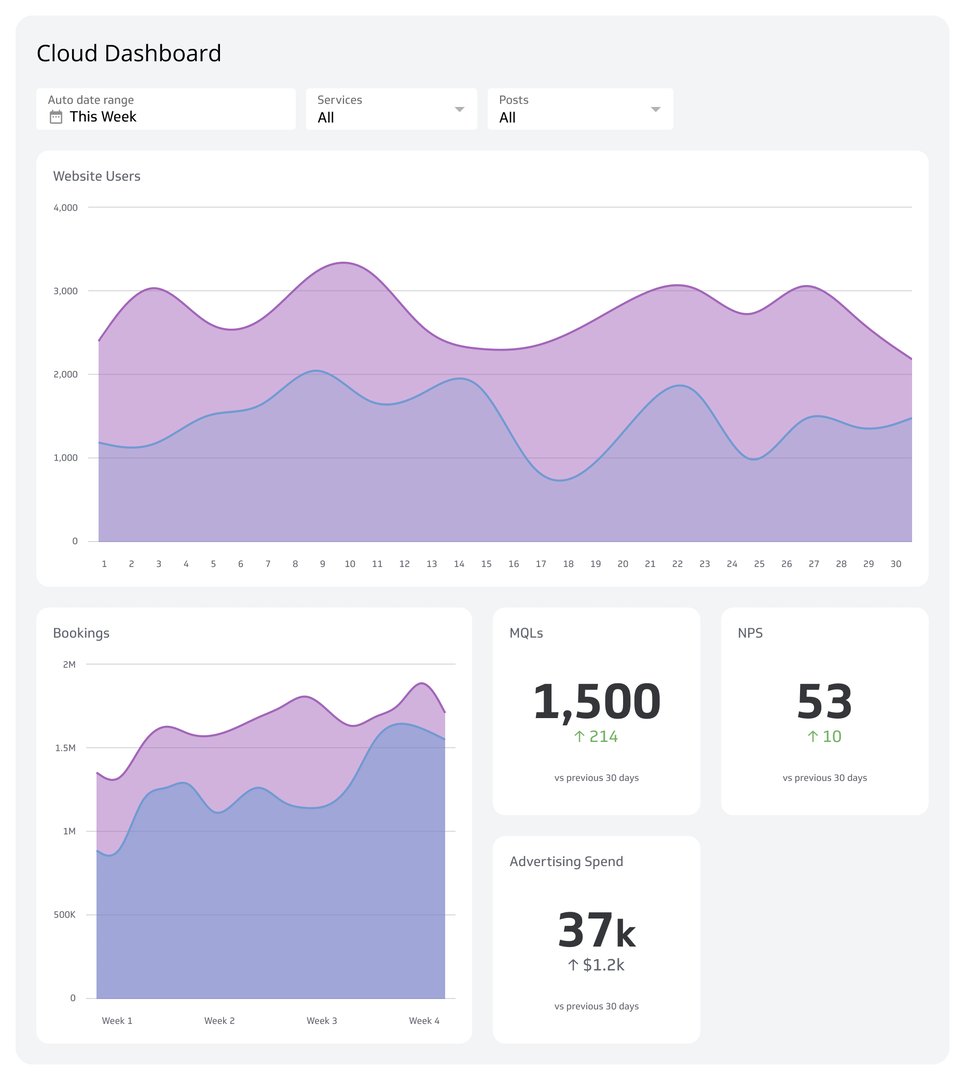
Cloud Dashboard
A cloud dashboard gives you and your team real-time access to key business metrics from any device, without installing software or managing servers. This guide explains what a cloud dashboard is, why it outperforms on-premise tools, and how to unify your data sources into one clear, shareable view.
- Business
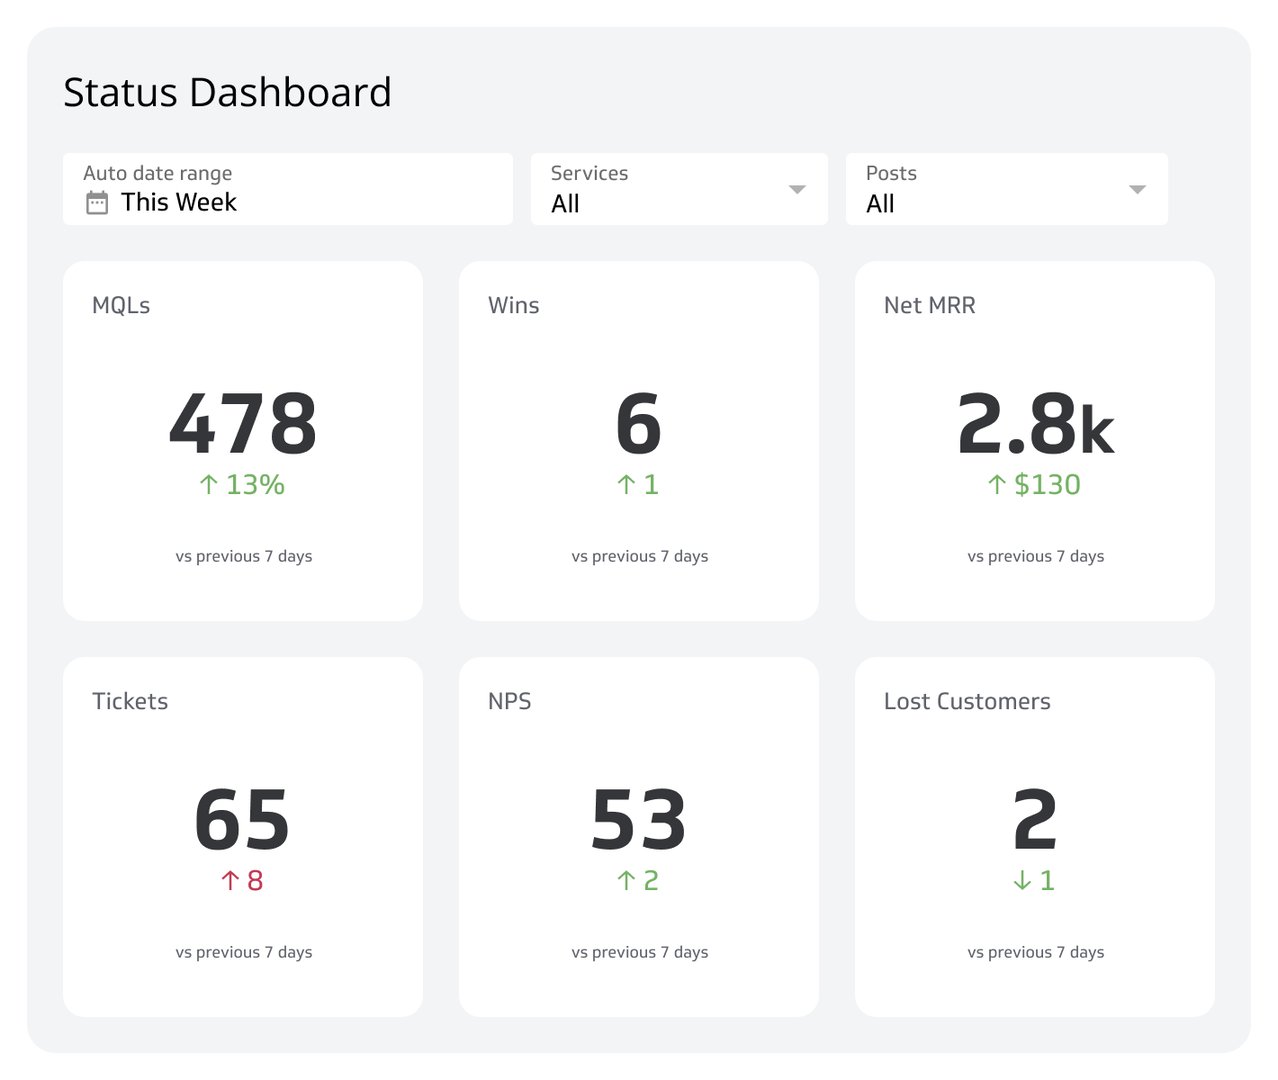
Digital Dashboard
Struggling to track performance across different apps and spreadsheets? This guide explains what a digital dashboard is and how it centralizes your most important data. Discover how to monitor key metrics, identify trends, and align your entire team around a single source of truth.
- Business
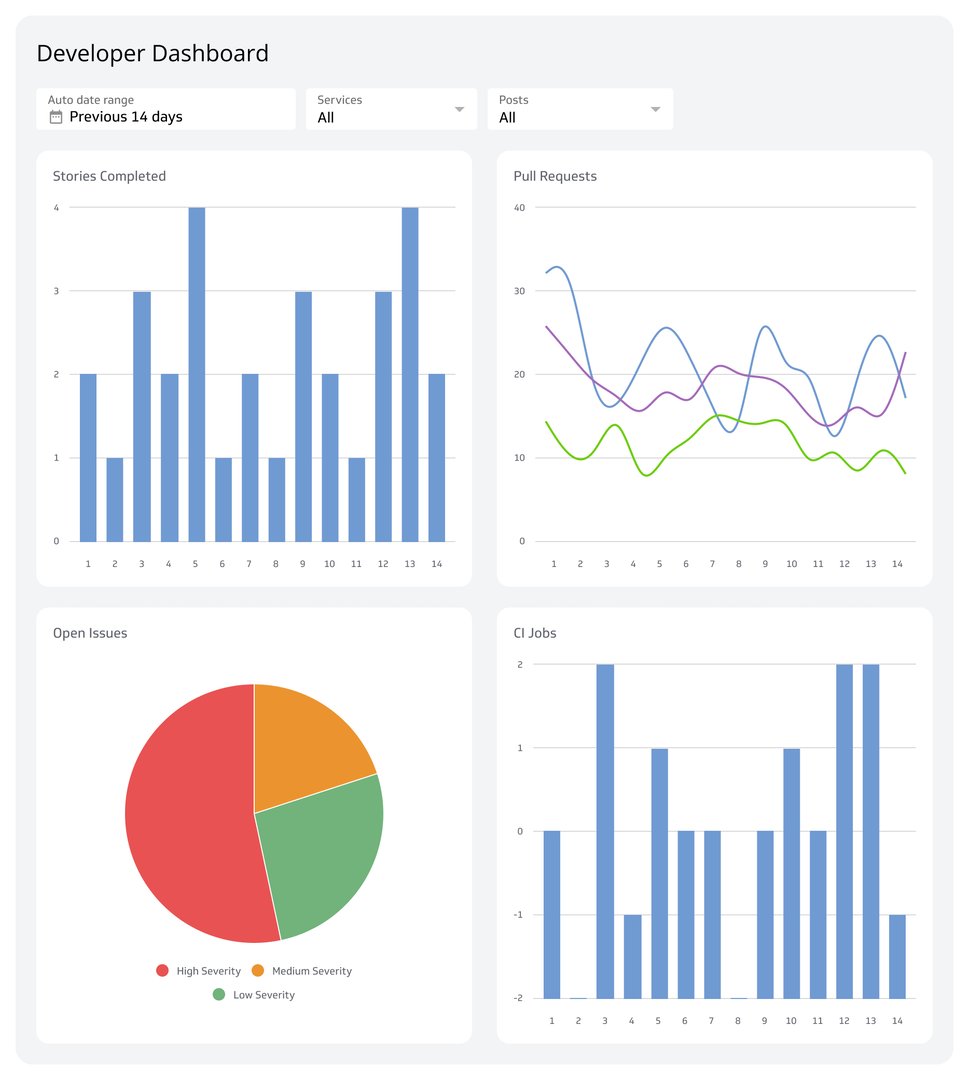
Software Development Dashboard
Stop guessing if your engineering team is on track. This guide explains how a software development dashboard pulls data from tools like Jira and GitHub to give you a single, real-time view of your most important agile and DevOps metrics. Learn which KPIs to track — from burndown charts to DORA metrics — and how to use them to ship better code, faster.
- Business
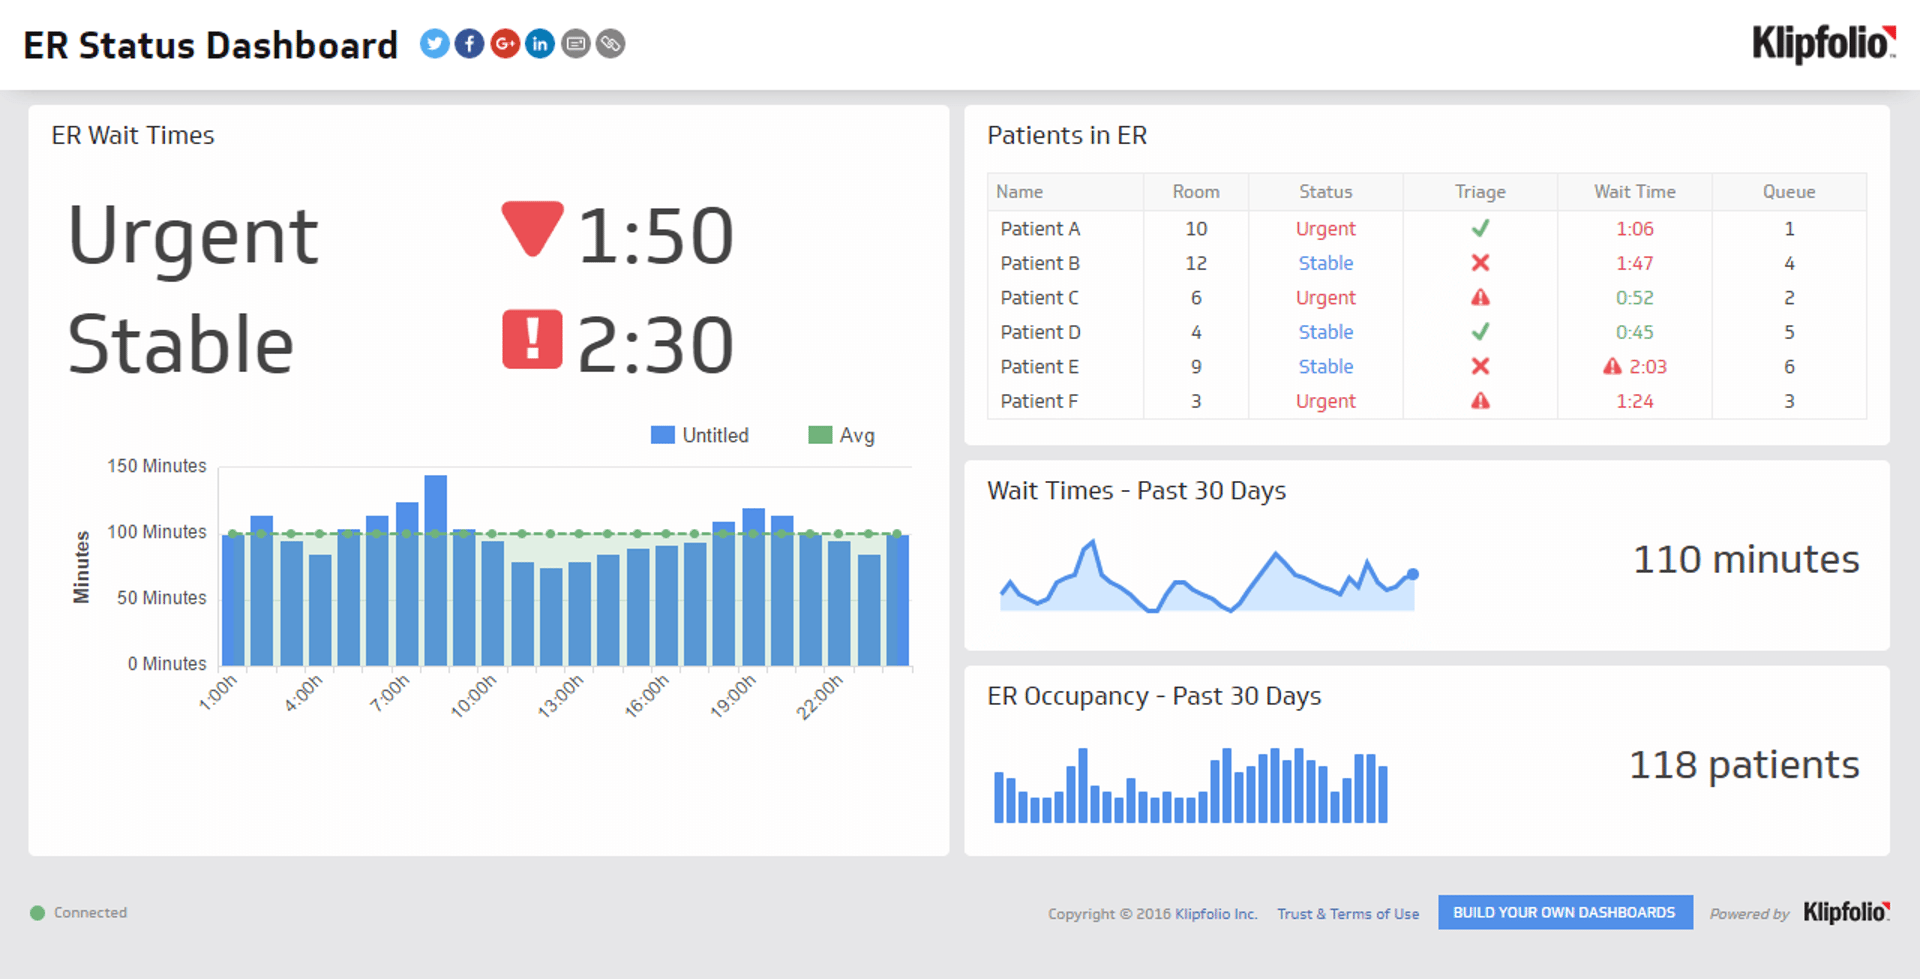
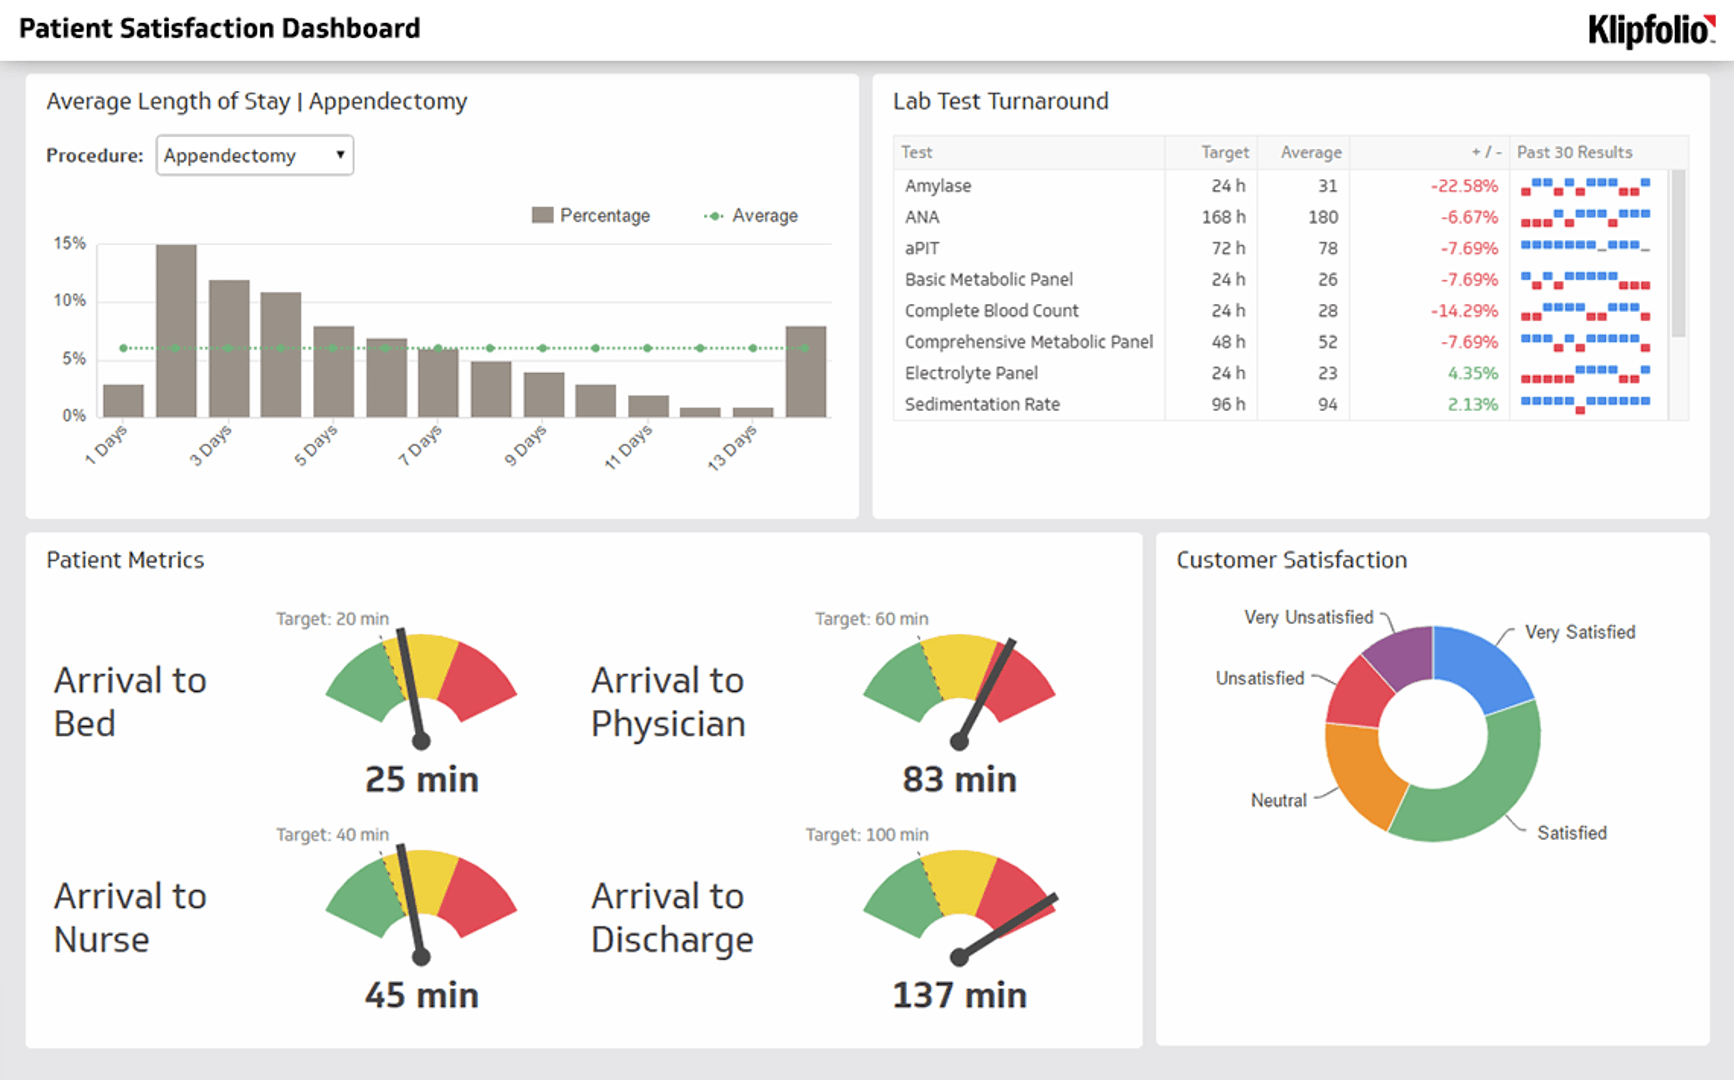
ER Status Dashboard
An emergency room runs on split-second decisions. This page explains how a real-time ER status dashboard gives hospital teams a single, accurate view of patient wait times, room occupancy, and patient volume — so staff can act decisively, allocate resources effectively, and deliver better patient care.

Acquire Key Business Data Without Difficulty
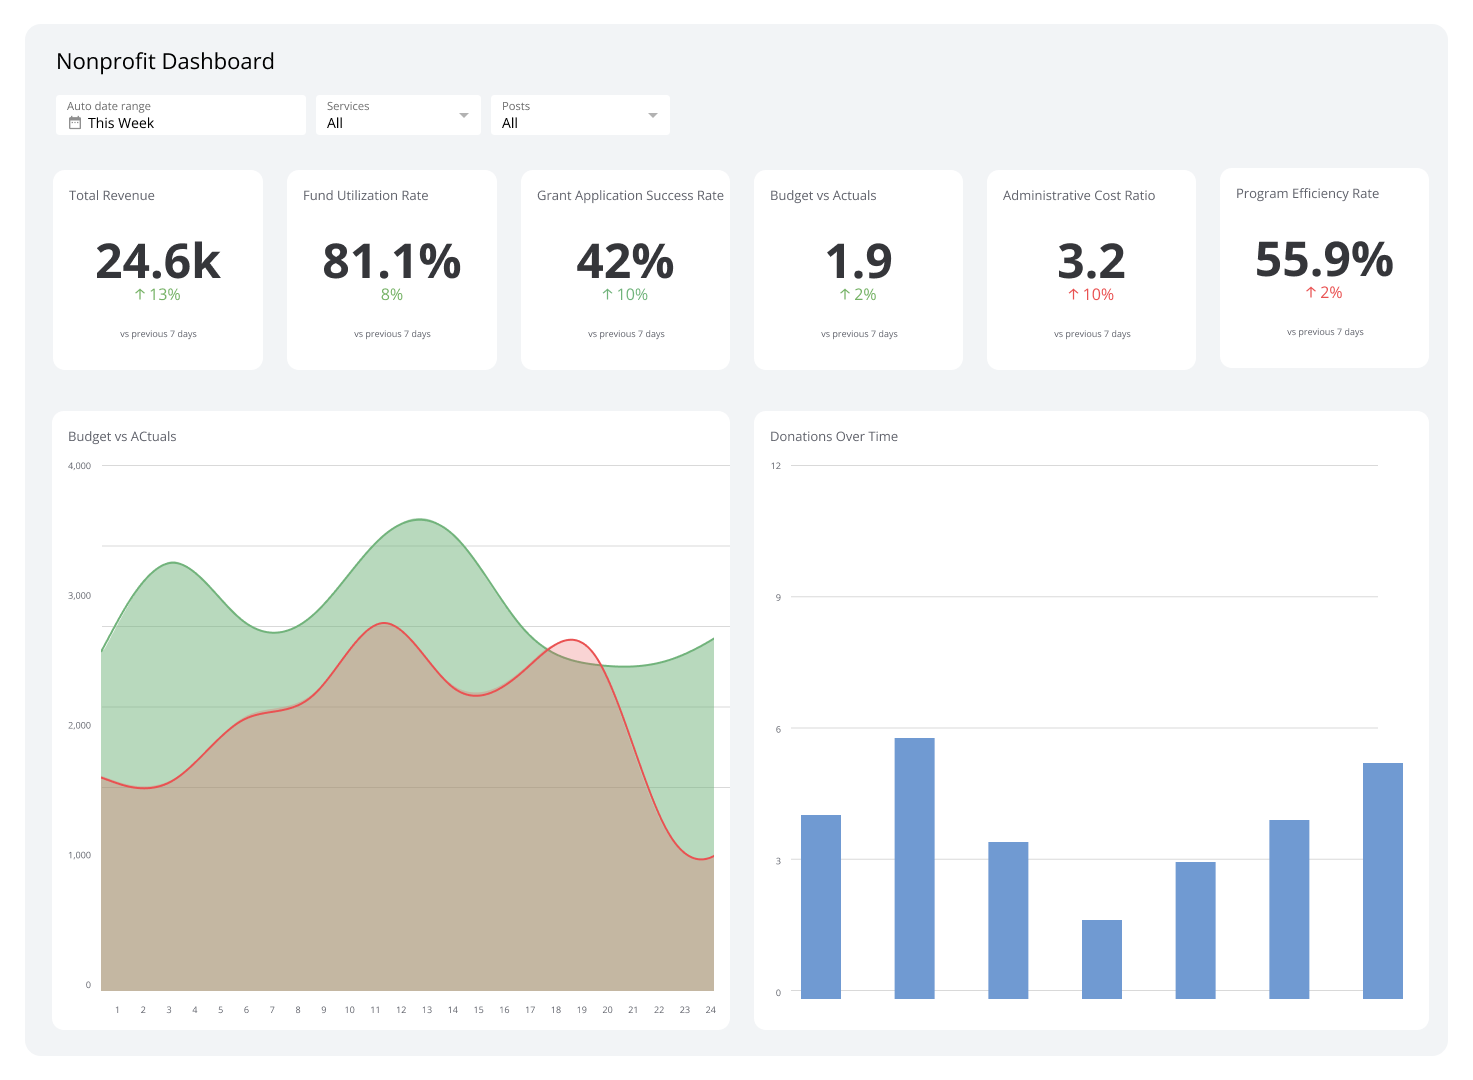
Business dashboards give you an overview of the health of your business by displaying vital metrics and KPIs in one intuitive platform. Analyzing lets you better understand the inner workings of your company, spot trends, reduce costs, and come up with informed decisions that lead to growth.
Klipfolio’s customizable dashboards can help you streamline the business data acquisition process. Find out by trying it for free today!
