Customer Service Dashboard
Customer service dashboards turn raw data into insights. Offering live visibility across channels like phone, email, and chat helps managers quickly spot and fix service issues.
What is a customer service dashboard?
A customer service dashboard provides real-time visibility into support tickets, agent performance, and customer interactions across all channels. It enables managers to quickly identify and resolve service issues, improving both customer satisfaction and team efficiency.
By tracking key metrics like response times and resolution rates, these dashboards help teams prioritize urgent cases and optimize their support process. The result: better resource allocation, faster response times, and improved customer experiences.
Ticket volume by channel dashboard
The ticket volume by channel dashboard shows the number of inquiries coming through different support channels—email, chat, phone, social media, and self-service. It helps teams see which channels are busiest and when, so they can allocate staff where they're needed most.
By analyzing channel-specific data, businesses can identify where to invest in training, automation, or process improvements. For example, if chat volume spikes during evenings, you might add evening coverage or improve chatbot capabilities.
Who's it for
Customer service teams, product managers, team leaders
How often it's needed
Daily, weekly, monthly
Covered KPIs
Ticket volume by channel, peak hour traffic, ticket volume trends over time, response times per channel, channel preference distribution
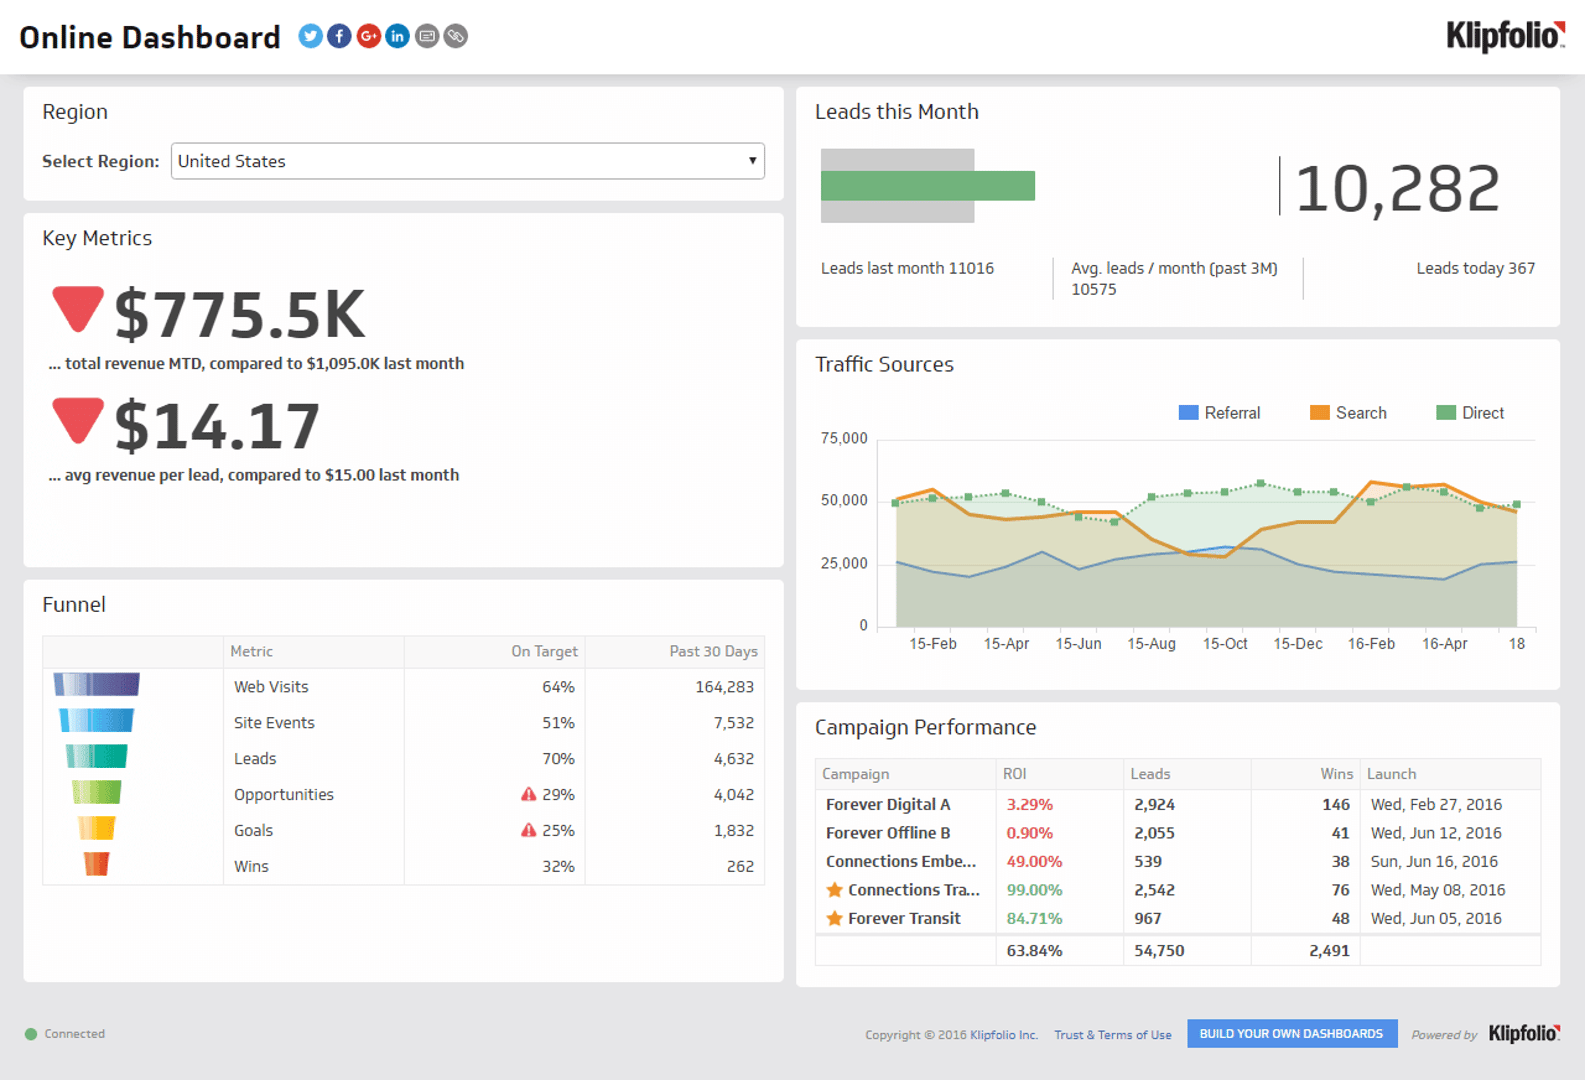
Multi-channel support dashboard
A multi-channel support dashboard shows how well customer support is performing across channels like chat, phone, email, and self-help options. Support teams use this tool to identify bottlenecks, allocate resources strategically, and maintain consistent service quality everywhere.
For example, you might discover that emails are taking too long to answer or that many customers are abandoning live chats. This visibility lets you make targeted improvements to each communication channel.
Who's it for
Customer support managers, team leaders, chief operating officers (COOs), operations analysts
How often it's needed
Daily, weekly, monthly, quarterly
Covered KPIs
Time from inquiry to response, average handle time, customer satisfaction scores (CSAT), net promoter score (NPS), ticket volume per channel, resolution rate, channel preference, cost per contact, agent productivity, self-service success rate
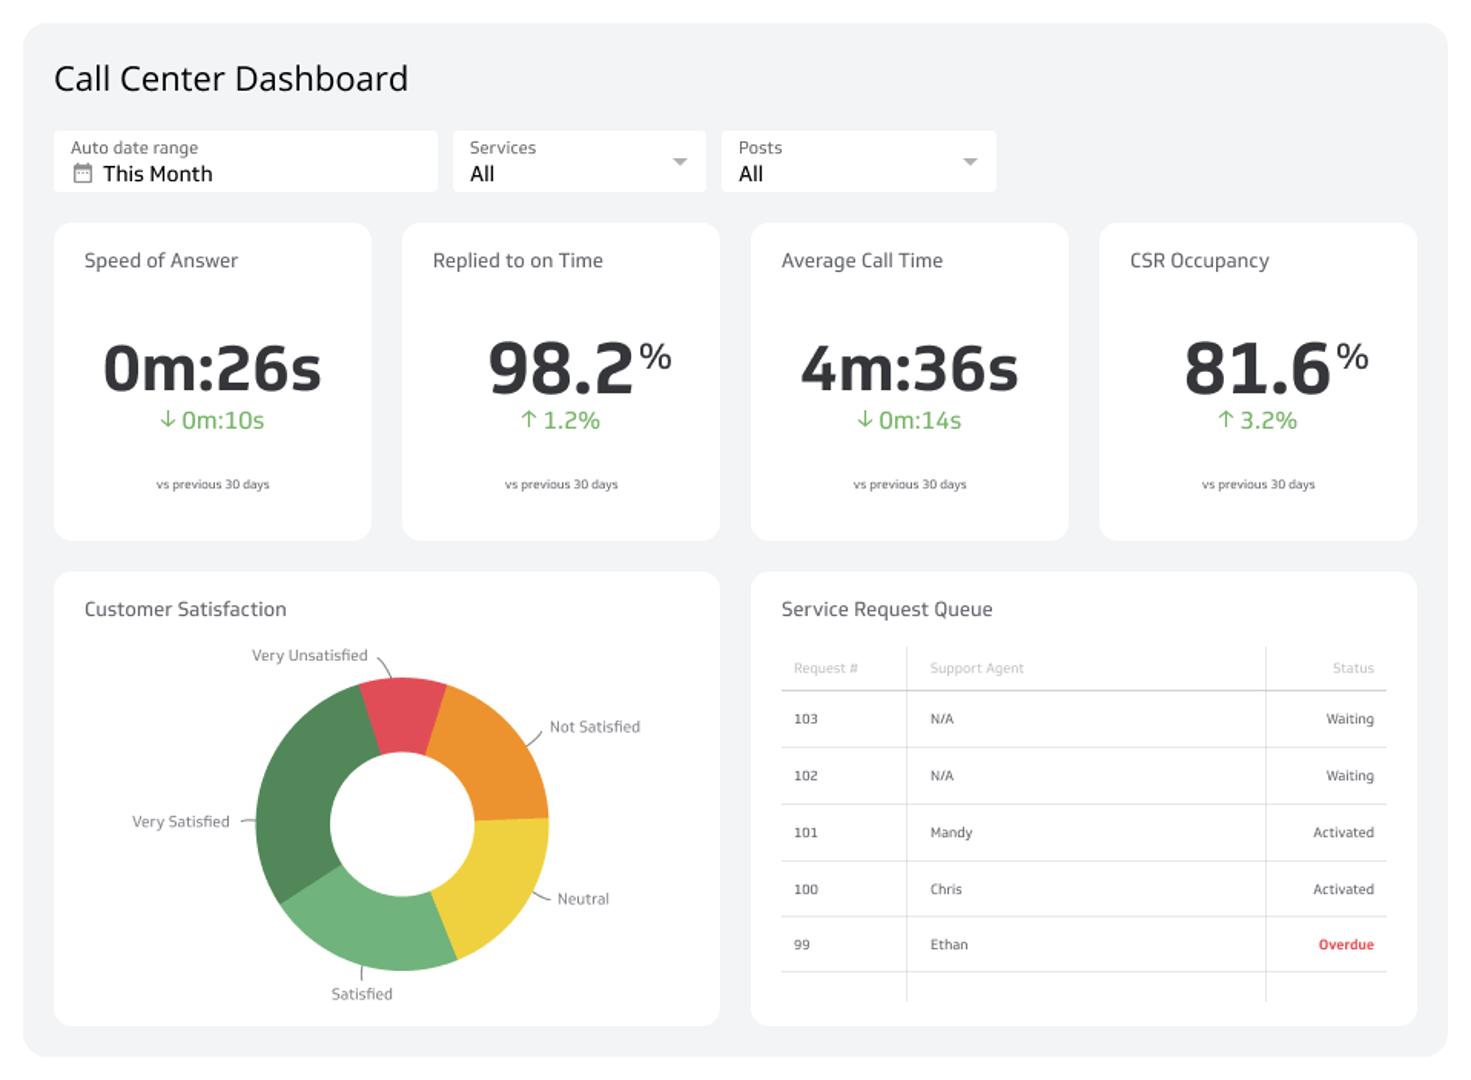
Call center dashboard
A call center dashboard shows real-time metrics like call volume, wait times, and CSAT scores. It helps team leaders spot and resolve unexpected call surges, extended wait times, declining satisfaction scores, and agent performance issues.
Who's it for
Call center managers, team leaders, customer service representatives, operations analysts
How often it's needed
Real-time, daily, weekly, monthly
Covered KPIs
Call volume, CSAT score, average handle time, call resolution, call abandonment, service level, CSR occupancy rate, speed of answer, customer effort score
Customer satisfaction dashboard
A customer satisfaction dashboard helps businesses quickly identify trends and track agent performance. This tool drives improvement by highlighting successes, encouraging healthy competition, and enabling swift responses to customer feedback.
Who's it for
Customer service managers, team leaders, front-line customer service agents, customer experience analysts
How often it's needed
Real-time, daily, weekly, monthly
Covered KPIs
CSAT, NPS, customer effort score (CES), first contact resolution rate, average response time, customer retention rate, sentiment analysis, agent performance, channel-specific satisfaction ratings, customer feedback themes or categories
Customer retention dashboard
A customer retention dashboard provides clear insights into important metrics like churn rate and customer lifetime value. By monitoring these indicators, businesses can spot issues early, recognize trends, and take proactive steps to improve customer loyalty.
For example, by focusing on strategies like onboarding and training, companies can lower churn rates, stabilize revenue, and demonstrate the importance of customer retention across the team.
Who's it for
Customer success managers, sales directors, marketing executives, product managers, executives
How often it's needed
Daily, weekly, monthly, quarterly
Covered KPIs
Customer churn rate, customer lifetime value (CLV), net revenue retention (NRR), saved revenue, customer health score, renewal rate, upsell and cross-sell revenue, customer engagement score, NPS, average revenue per user (ARPU)
Customer experience dashboard
Customer experience dashboards gather key data about how customers feel and interact with your products. Teams use this information to identify issues, enhance services, and improve customer satisfaction. These dashboards typically integrate with CRMs like Zendesk and Salesforce.
Who's it for
Customer experience (CX) teams, customer service managers, product teams, product managers, executives
How often it's needed
Real-time, daily, weekly, monthly
Covered KPIs
NPS, average response time, first contact resolution rate, total number of tickets, new users added, reports added, product engagement metrics
Self-service analytics dashboard
A self-service analytics dashboard tracks how customers use resources like knowledge bases, FAQs, and chatbots. Customer experience teams use it to see which self-service options work well and what needs improvement.
Who's it for
Customer experience managers, product managers, UX/UI designers, customer support team leaders, self-service content creators
How often it's needed
Daily, weekly, monthly
Covered KPIs
Self-service usage rate, successful resolution rate, time to resolve complaints, user satisfaction scores, deflection rate, most frequently accessed resources, search query analysis, shopping carts abandoned, escalation rate to live support, cost savings from self-service
Get everyone on the same page with a customer service dashboard
Customer service dashboards transform raw data into actionable insights. They offer a clear view of performance across channels and help teams make informed decisions that boost efficiency and customer satisfaction.
Klipfolio's customer service dashboards bring all your key metrics into one interface. This lets your team monitor customer satisfaction and service performance in real time, spot issues before they escalate, and respond faster to customer needs.
Start your free trial today—no credit card required.
At a glance
Focus Area
Support operations, multi-channel management, customer satisfaction tracking, agent performance
Metrics List
CSAT, NPS, response time, resolution rate, ticket volume, handle time, customer retention
Reference Rate
Daily, weekly, monthly, quarterly, and real-time monitoring depending on the dashboard type and role
Watch: Customer Service Dashboard Overview
Related Dashboards
View all dashboards