Digital Dashboard
Your all-in-one command center for business performance.
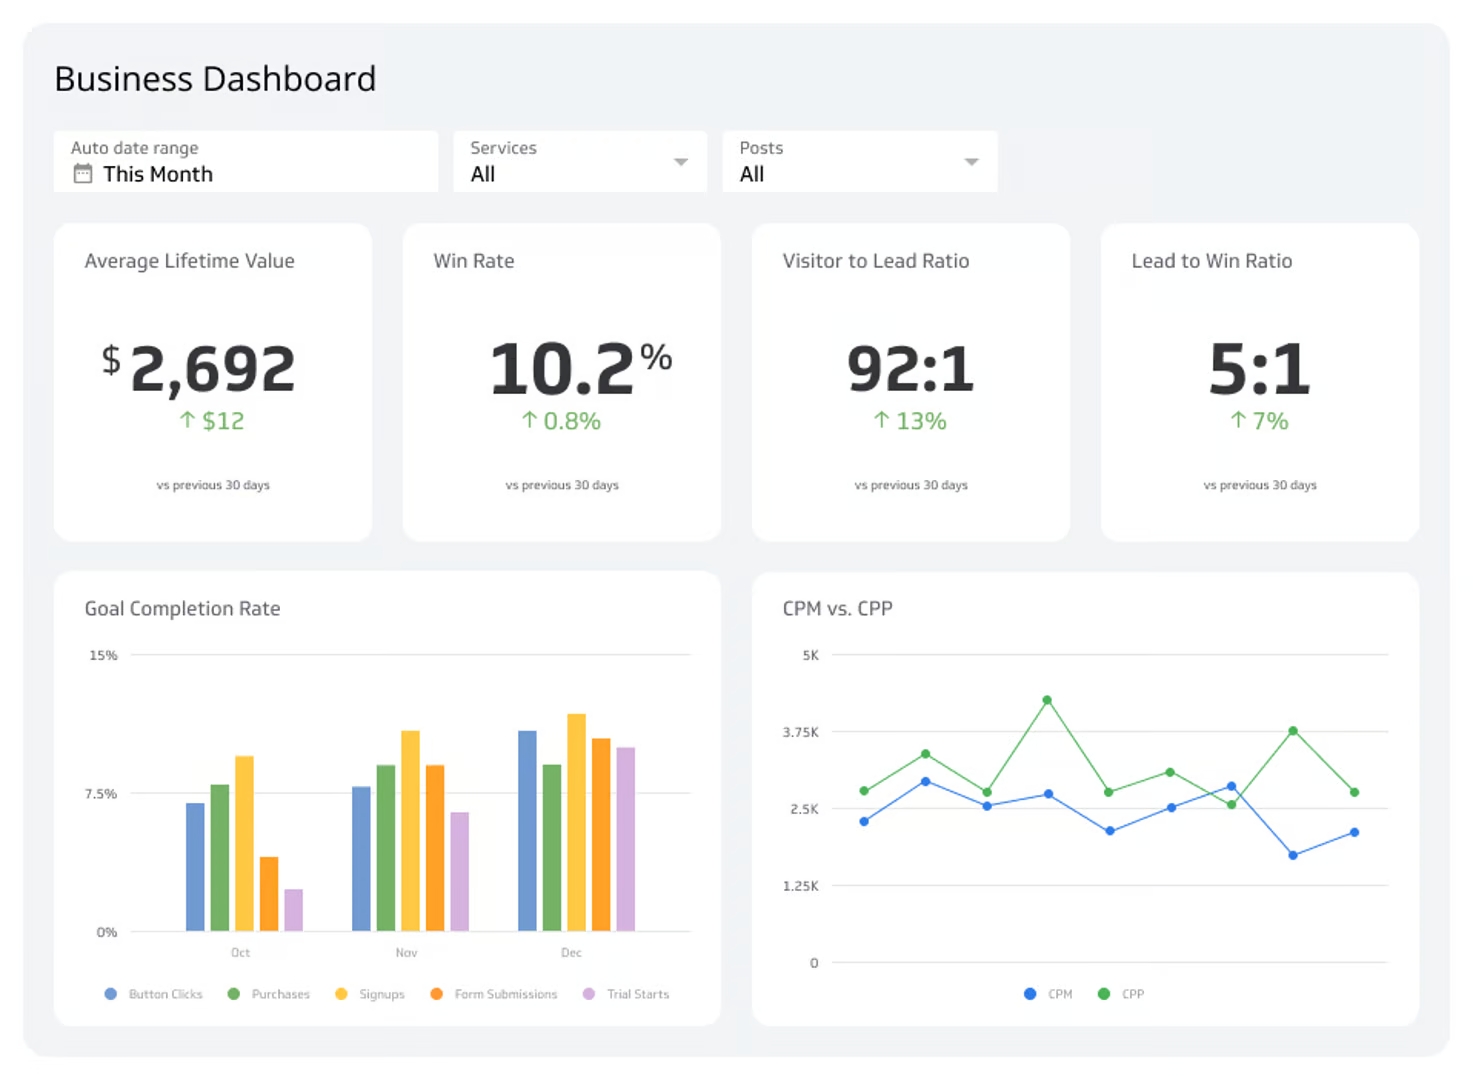
Is your business data scattered across spreadsheets, cloud services, and apps? A digital dashboard solves this by consolidating your critical metrics into one centralized, real-time view.
What is a digital dashboard?
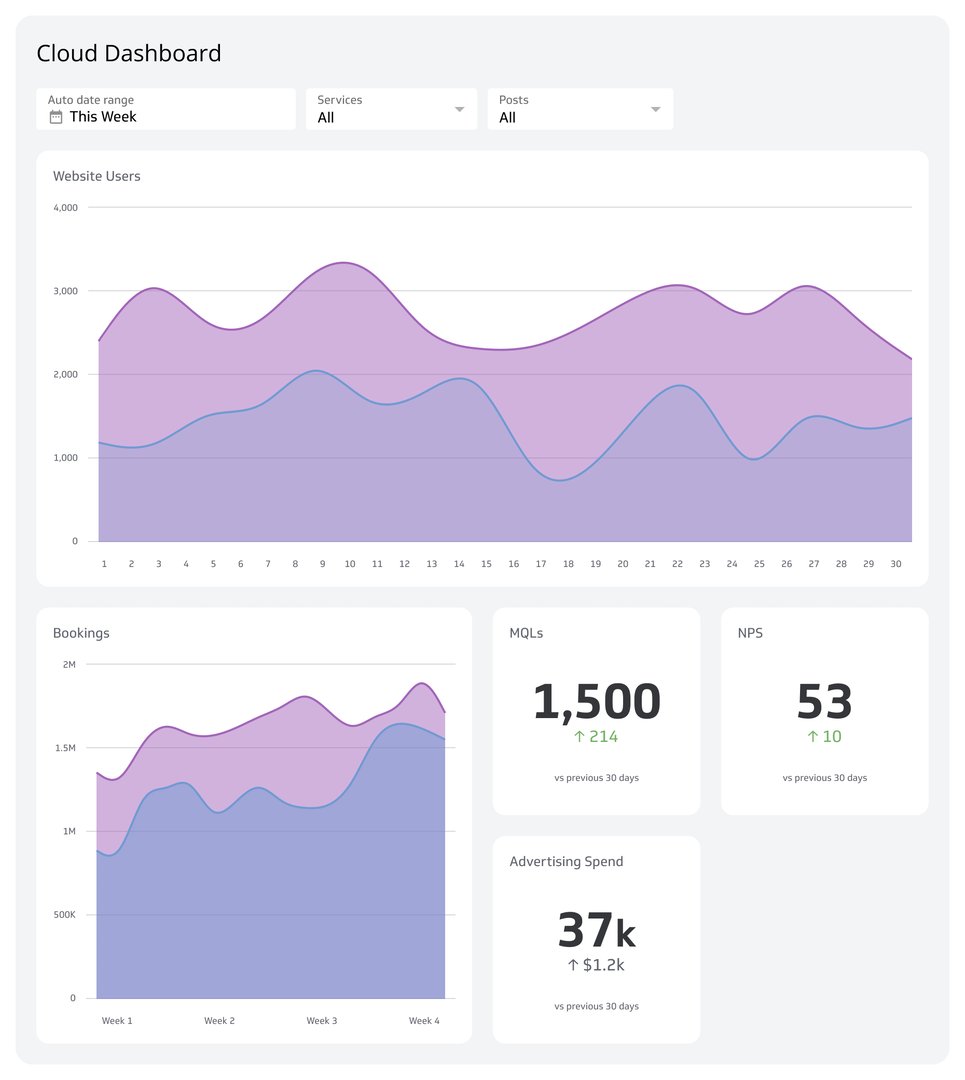
A digital dashboard is a data visualization tool that consolidates and displays your most important KPIs and metrics on a single screen. It connects to multiple data sources, from databases and spreadsheets to cloud services, to give you a unified, real-time view of business performance.
Think of it as the instrument panel for your business. Instead of manually compiling reports or pasting numbers into a spreadsheet every week, a dashboard automates the process and presents complex data through charts, graphs, and tables you can read at a glance. You spot trends, catch problems early, and know what to do next, without having to ask anyone to pull a number.
Why your business needs a digital dashboard
For growing businesses, staying agile means knowing what's happening before it becomes a problem. A business dashboard customized to your goals keeps you focused on the metrics that actually drive decisions, not the ones that just fill a report.
Here's what changes when your data is centralized and current:
- A single source of truth: Everyone on your team works from the same numbers. No more conflicting reports or misaligned metrics.
- Real-time performance tracking: You see a dip in conversion or a spike in costs when it happens, not at the end of the month.
- Clear, simple visualizations: Complex data becomes something anyone, from an exec to a team lead, can read and act on immediately.
- Faster, more confident decisions: When you trust the numbers in front of you, decisions take minutes, not meetings.
- Improved team alignment: Shared visibility keeps everyone accountable and focused on the same objectives.
Whether you're a CEO monitoring company health, a marketing manager tracking campaign ROI, or a sales leader watching your pipeline, a well-designed dashboard hands you answers, not a tool to operate.
Key features of digital dashboards
Real-time updates, interactive visualizations, and customizable metrics and KPIs are the three defining features of digital dashboards.
Real-time data updates
One of the most important features of a digital dashboard is real-time data updates. With current data always on screen, you can monitor performance and respond quickly to changes without waiting for a weekly report or a manual refresh. The useful version of this keeps you informed without requiring you to go looking.
Interactive visualizations
Digital dashboards go beyond static reports by engaging users with interactive visualizations such as clickable charts and graphs. You can click on a segment of a pie chart to see more detailed information, or hover over a data point on a line graph to view exact values. This makes it easier to explore data and uncover insights quickly.
Customizable metrics and KPIs
Digital dashboards let you choose which metrics and KPIs to track and how they appear on screen. If your main goal is to grow sales, you can set up your dashboard to highlight Revenue, Conversion Rates, and Customer Acquisition Cost. This level of customization keeps your dashboard focused on what actually drives your business forward.
Why use a digital dashboard?
A digital dashboard helps you make data-driven decisions in real time. It also supports communication, collaboration, efficiency, and productivity across your organization.
Make data-driven decisions
With up-to-the-minute information in front of you, you can act quickly and with confidence. Digital dashboards also make it easy to spot trends and outliers through data visualization, so you can respond before small issues become large ones.
Keep your organization on the same page
When everyone has access to the same information, they work together more efficiently toward common goals. That consistency matters more than most leaders expect: misalignment often comes from people referencing different versions of the same metric. A shared dashboard removes that friction.
Improve efficiency and productivity
Instead of accessing multiple sources for information, you and your team can view all critical data in one place, saving time and reducing the complexity of data analysis. Automated data updates cut the time spent generating reports, which means less manual effort, fewer errors, and more time acting on what the data shows.
Types of digital dashboards
Every department in an organization can use digital dashboards. These generally fall into four types.
Strategic dashboards
Strategic dashboards provide a high-level overview of the organization's long-term goals and KPIs, making them useful for executives and senior leadership. They focus on crucial data points like revenue growth, market share, and overall company health, giving you the insights needed to steer your business toward its objectives.
Operational dashboards
Operational dashboards are used by mid-level managers and team leaders to monitor daily activities and processes. They display real-time information about the current status of various operations, tracking metrics such as production efficiency, order fulfillment, and customer service performance, so day-to-day operations run smoothly.
Analytical dashboards
Analytical dashboards dig deep into data to uncover trends, patterns, and insights. Often used by data analysts, these dashboards help you understand the underlying causes of performance trends and make data-driven decisions. They can handle large volumes of data and complex queries, giving you a comprehensive view of performance over time.
Tactical dashboards
Tactical dashboards combine elements of strategic and operational dashboards. Middle management uses them to support short-term decision-making, tracking metrics related to project management, departmental performance, and short-term campaigns. They allow you to monitor efficiency, evaluate outcomes, and adjust strategies as needed.
Examples of digital dashboards
Every department in your organization can use digital dashboards to support decision-making. Here are eight common examples.
Marketing dashboards
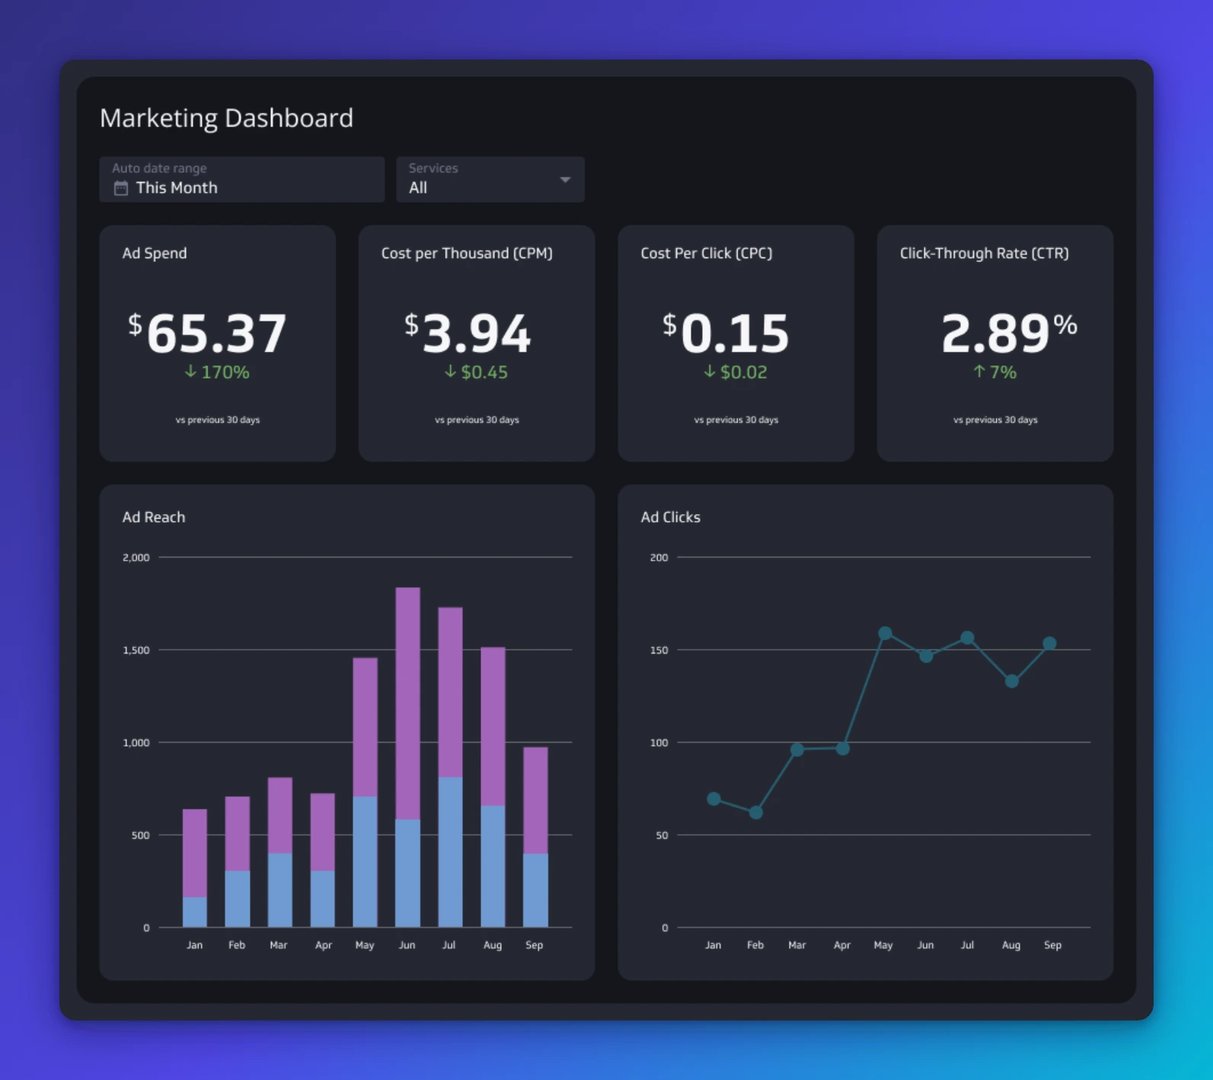
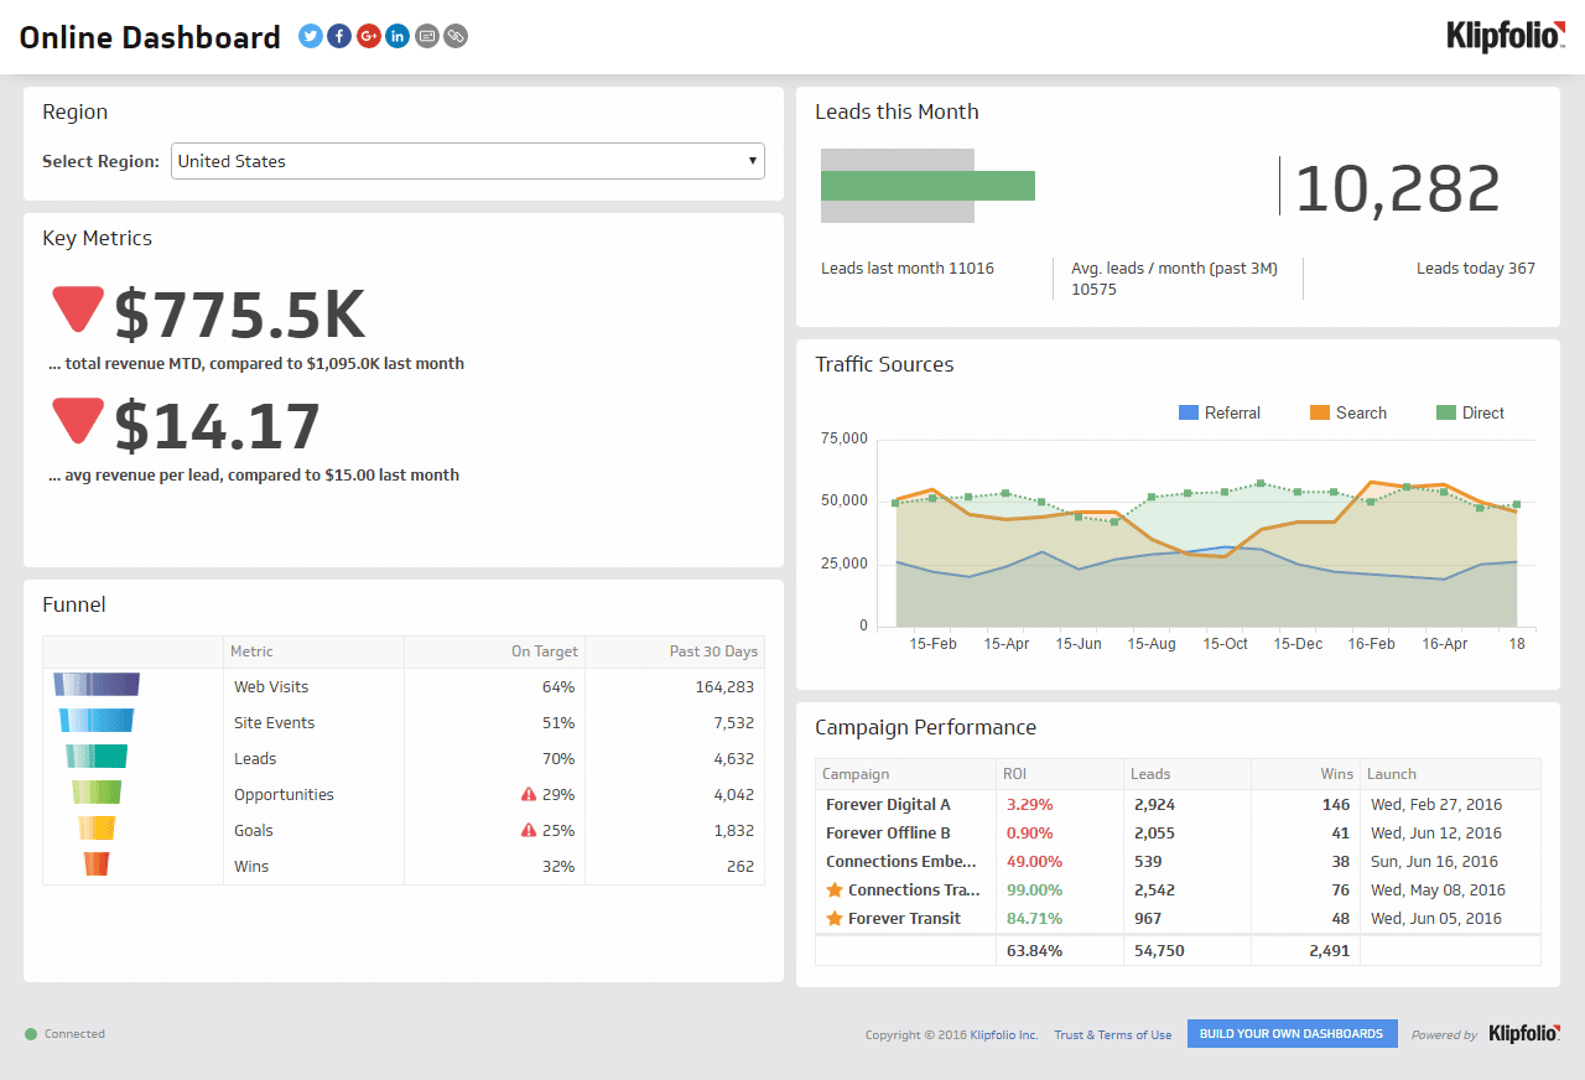
Marketing dashboards provide real-time data on campaign performance, letting you monitor Click-Through Rate, Conversion Rate, and ROI. They also track social media engagement, including likes, shares, comments, and reach, across platforms, and surface SEO metrics like keyword rankings, organic traffic, and backlinks so you can improve your search visibility.
Sales dashboards
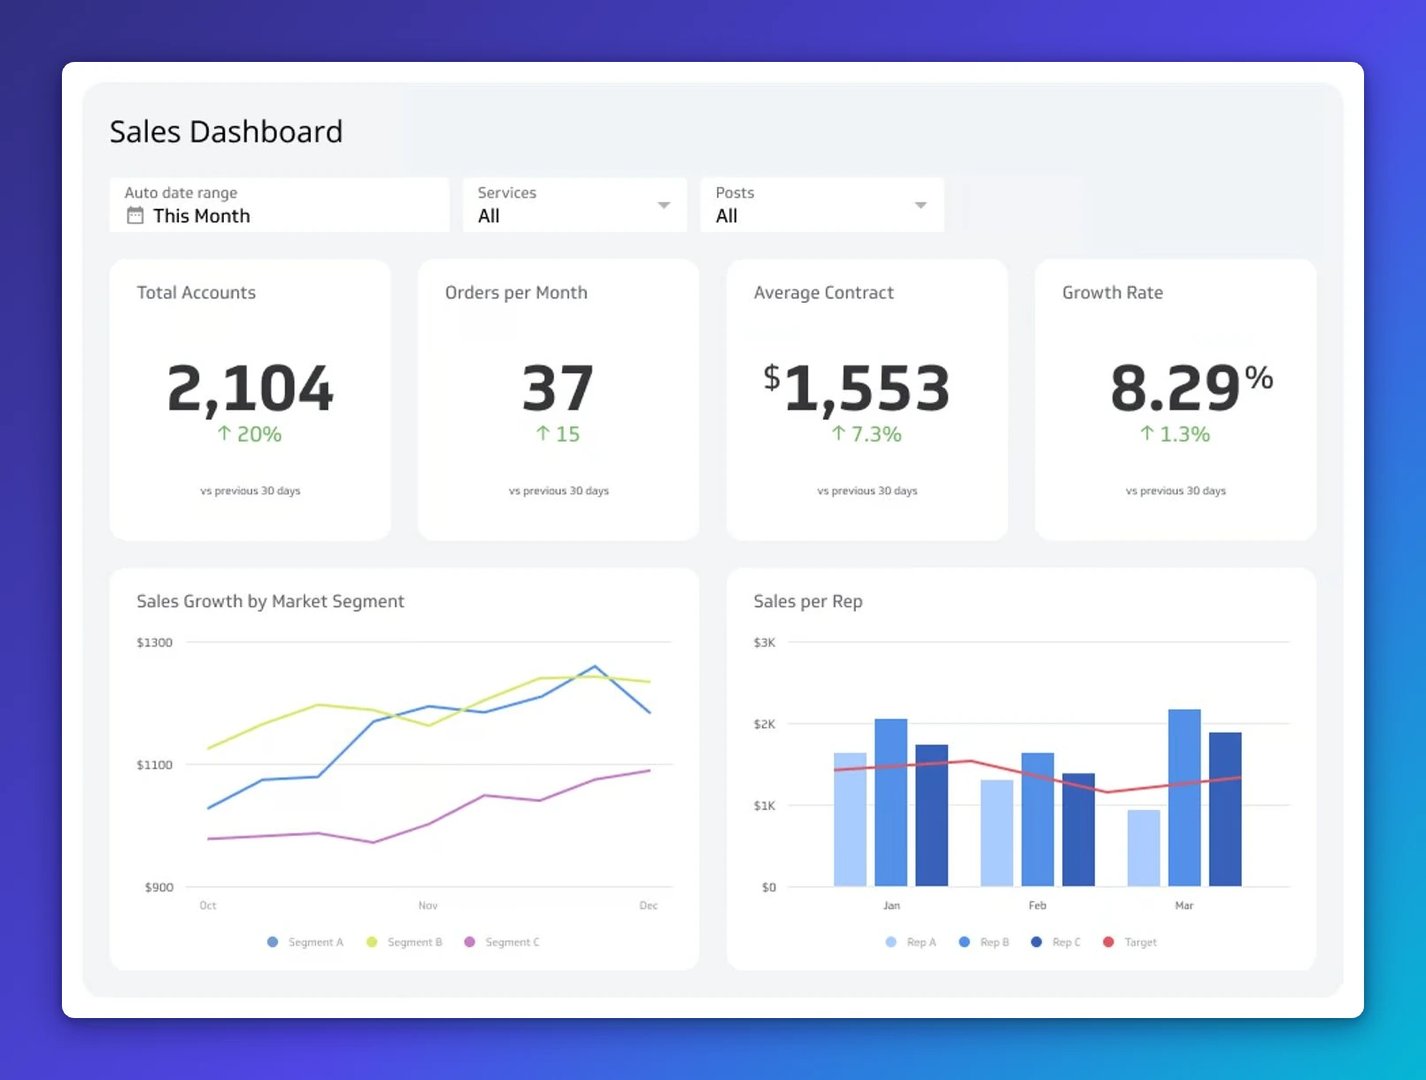
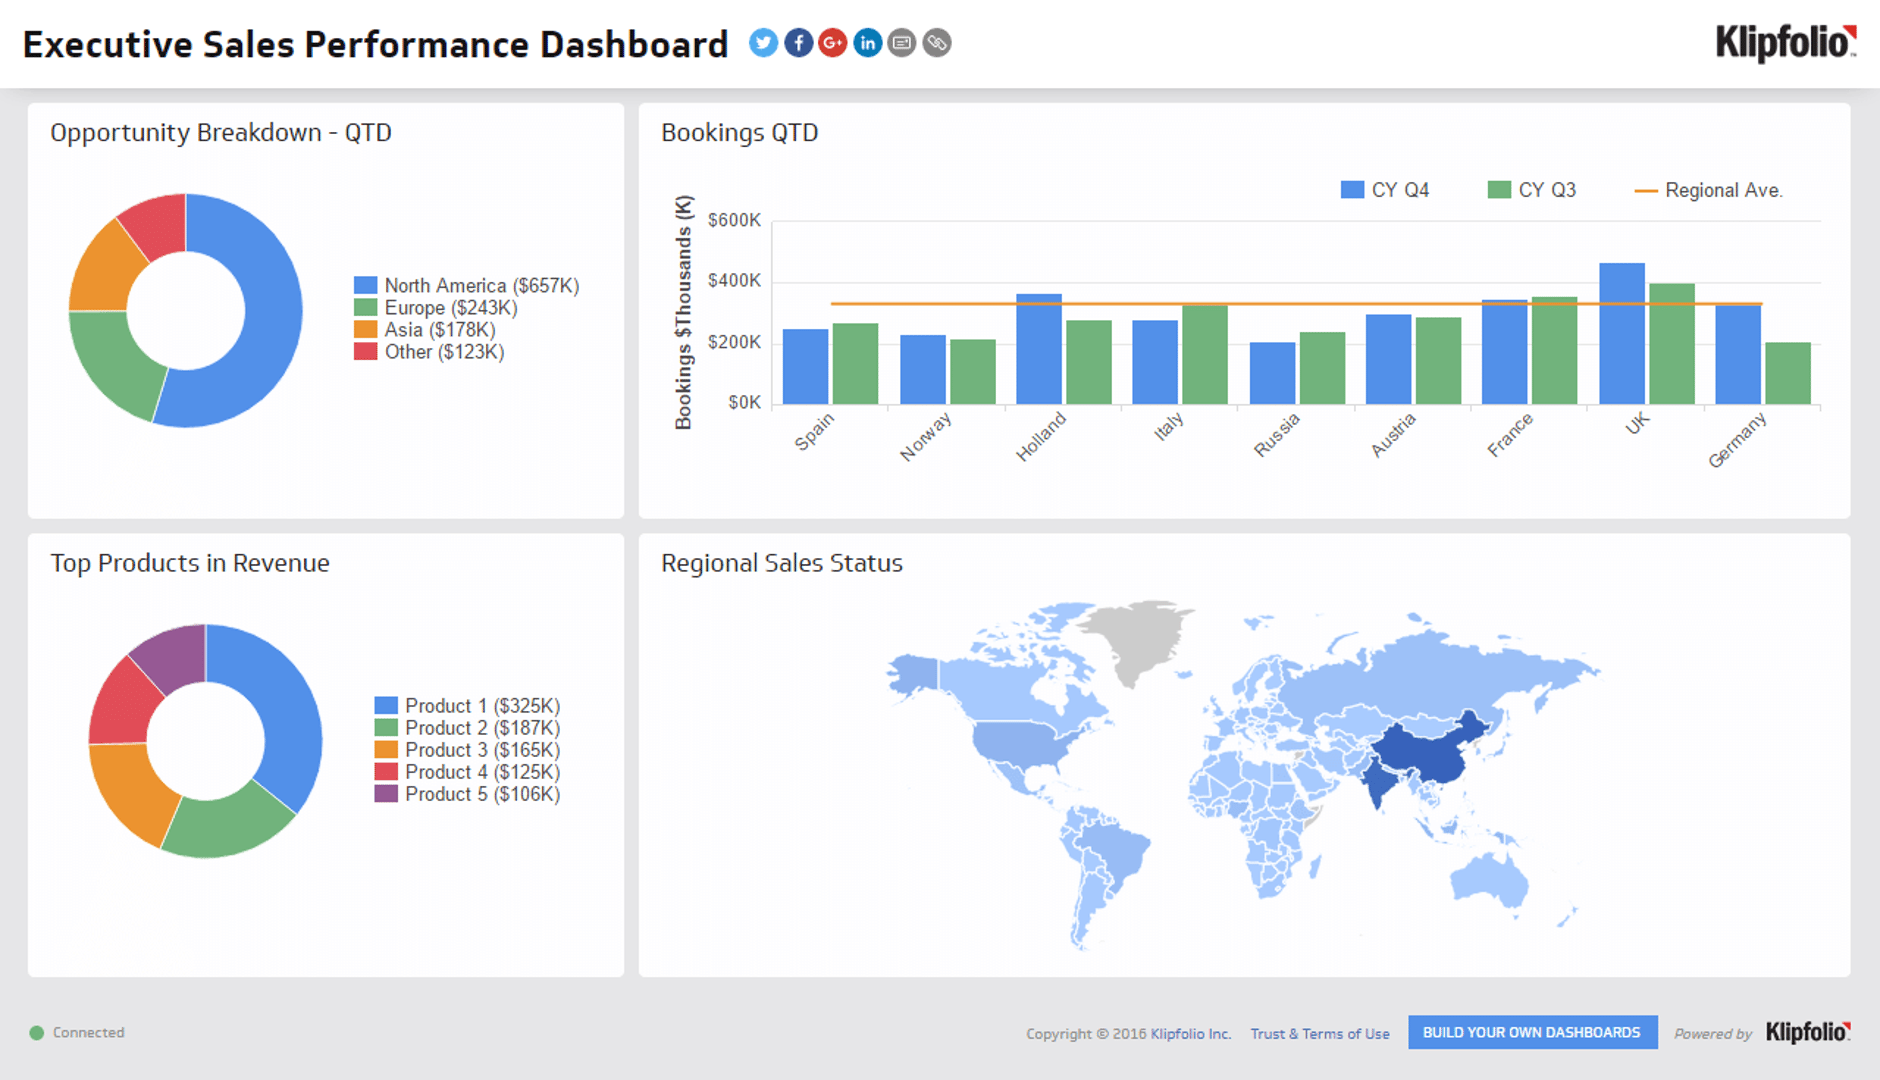
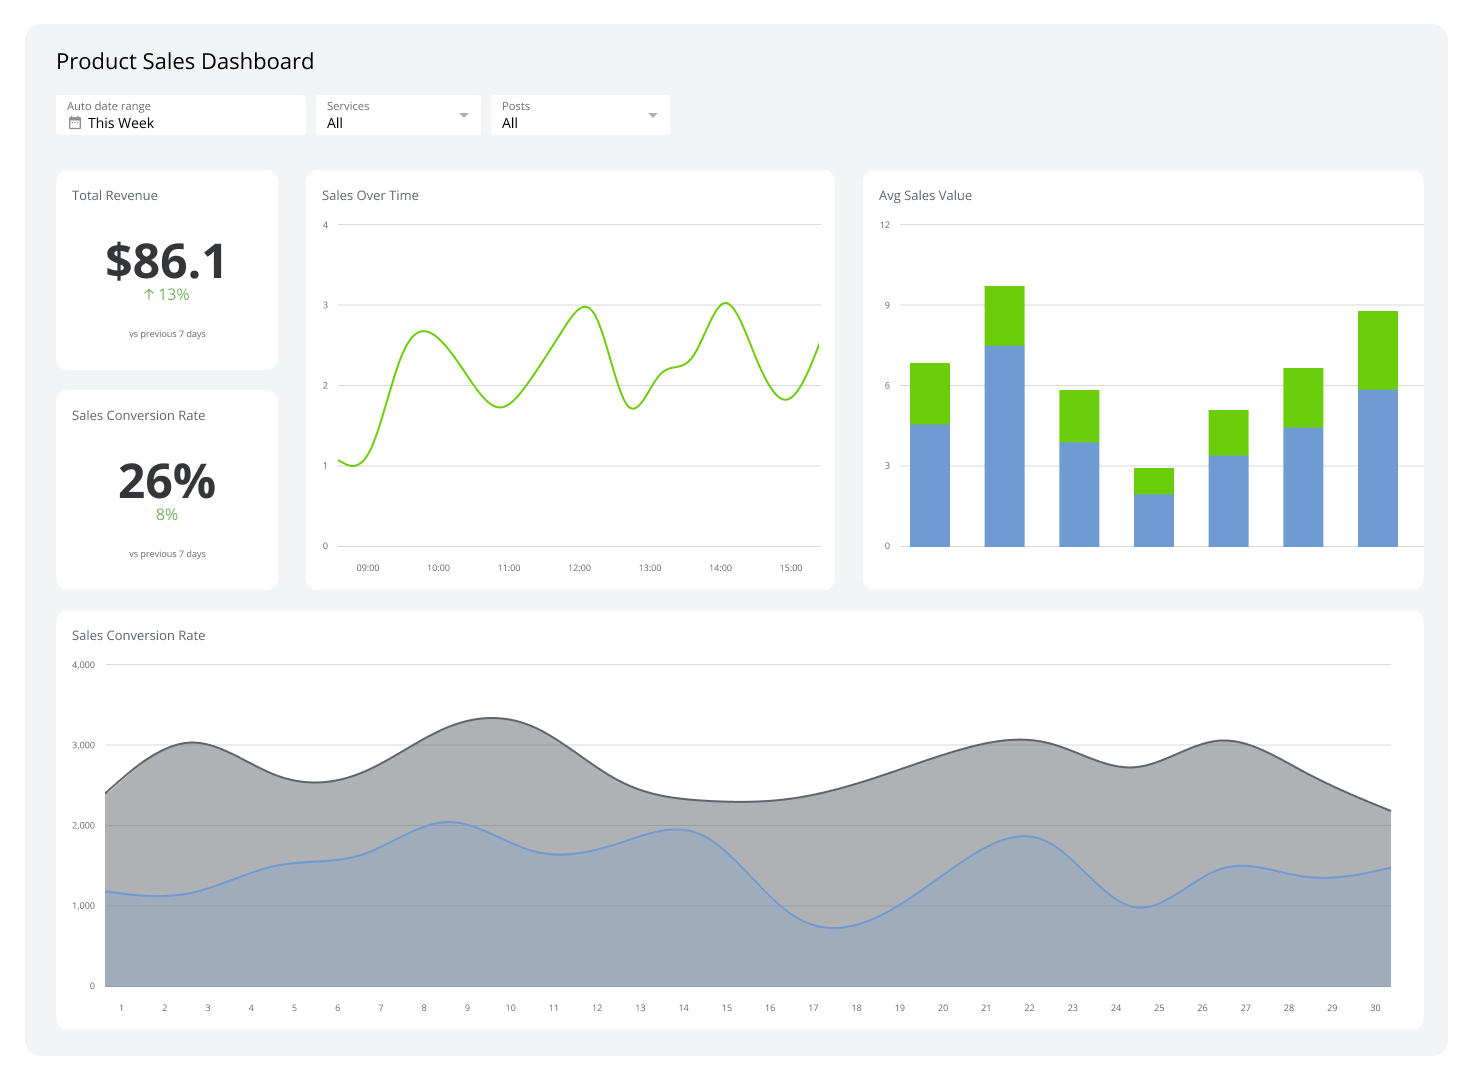
Sales dashboards give you a comprehensive view of your sales data, including Total Revenue, sales by product, and sales by region. You can also track Lead Conversion Rate and visualize your pipeline from initial contact to closed deals, helping you identify bottlenecks and keep your team on track to meet targets.
Create custom dashboards for you and your team.
Get started with KlipsFinancial performance dashboards
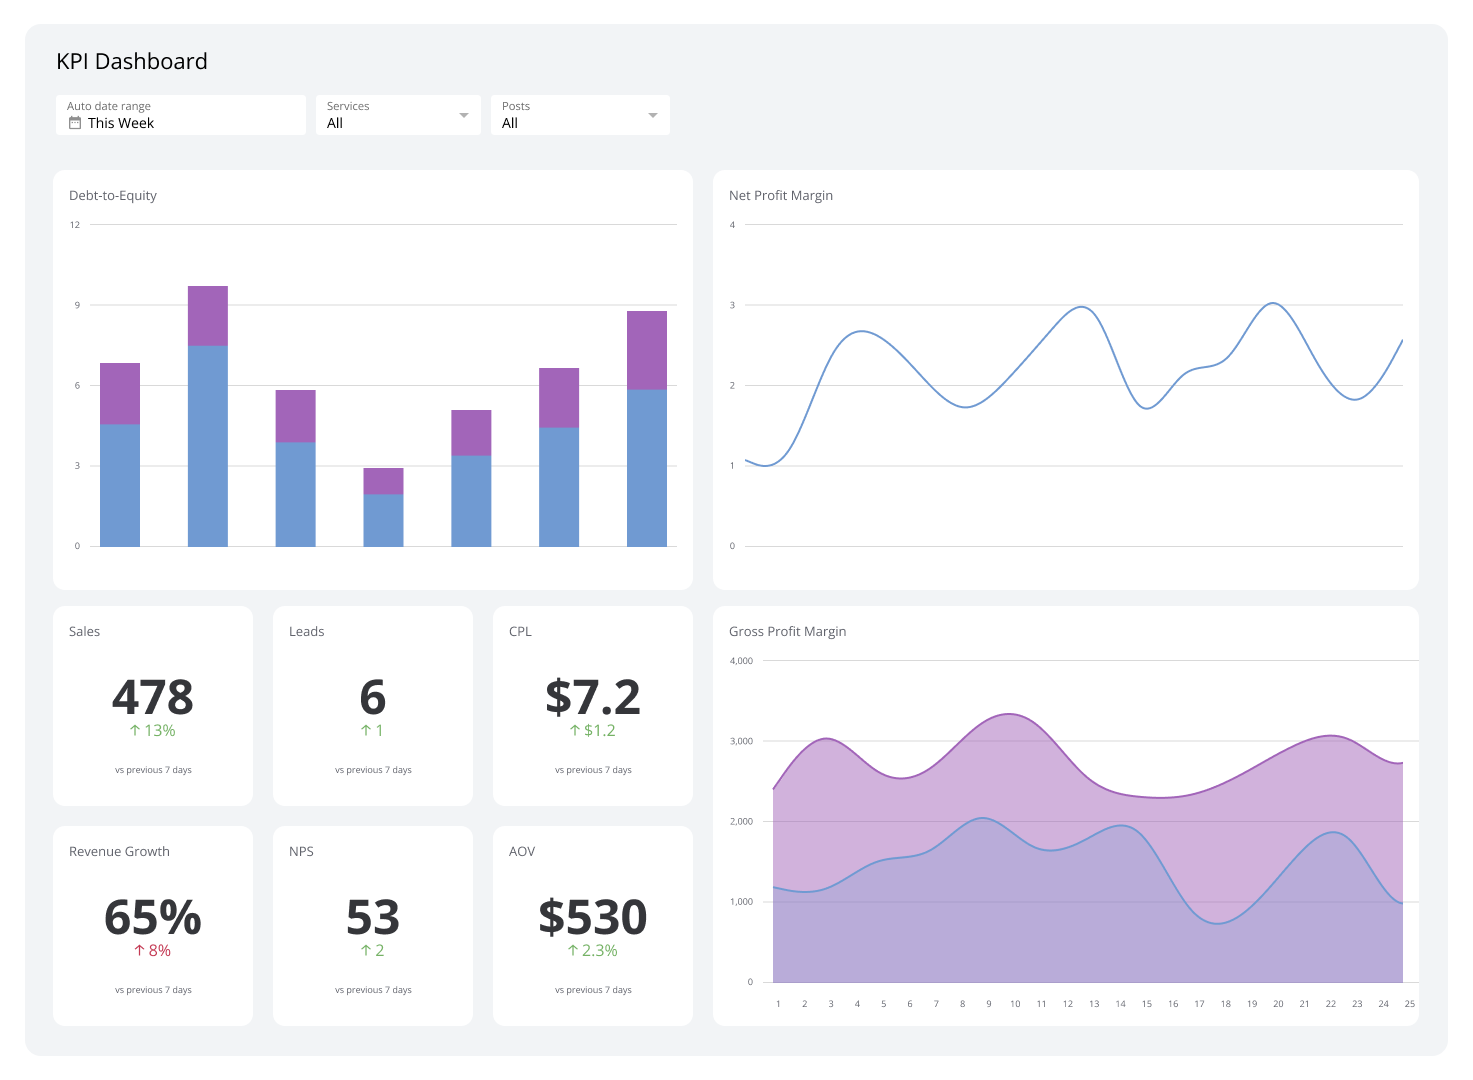
Financial performance dashboards keep you informed of your company's revenue streams, expenses, and financial health indicators like Profit Margin, Cash Flow, and debt levels. By monitoring these metrics together, you can identify cost-saving opportunities and assess financial stability before risks escalate.
Executive dashboards
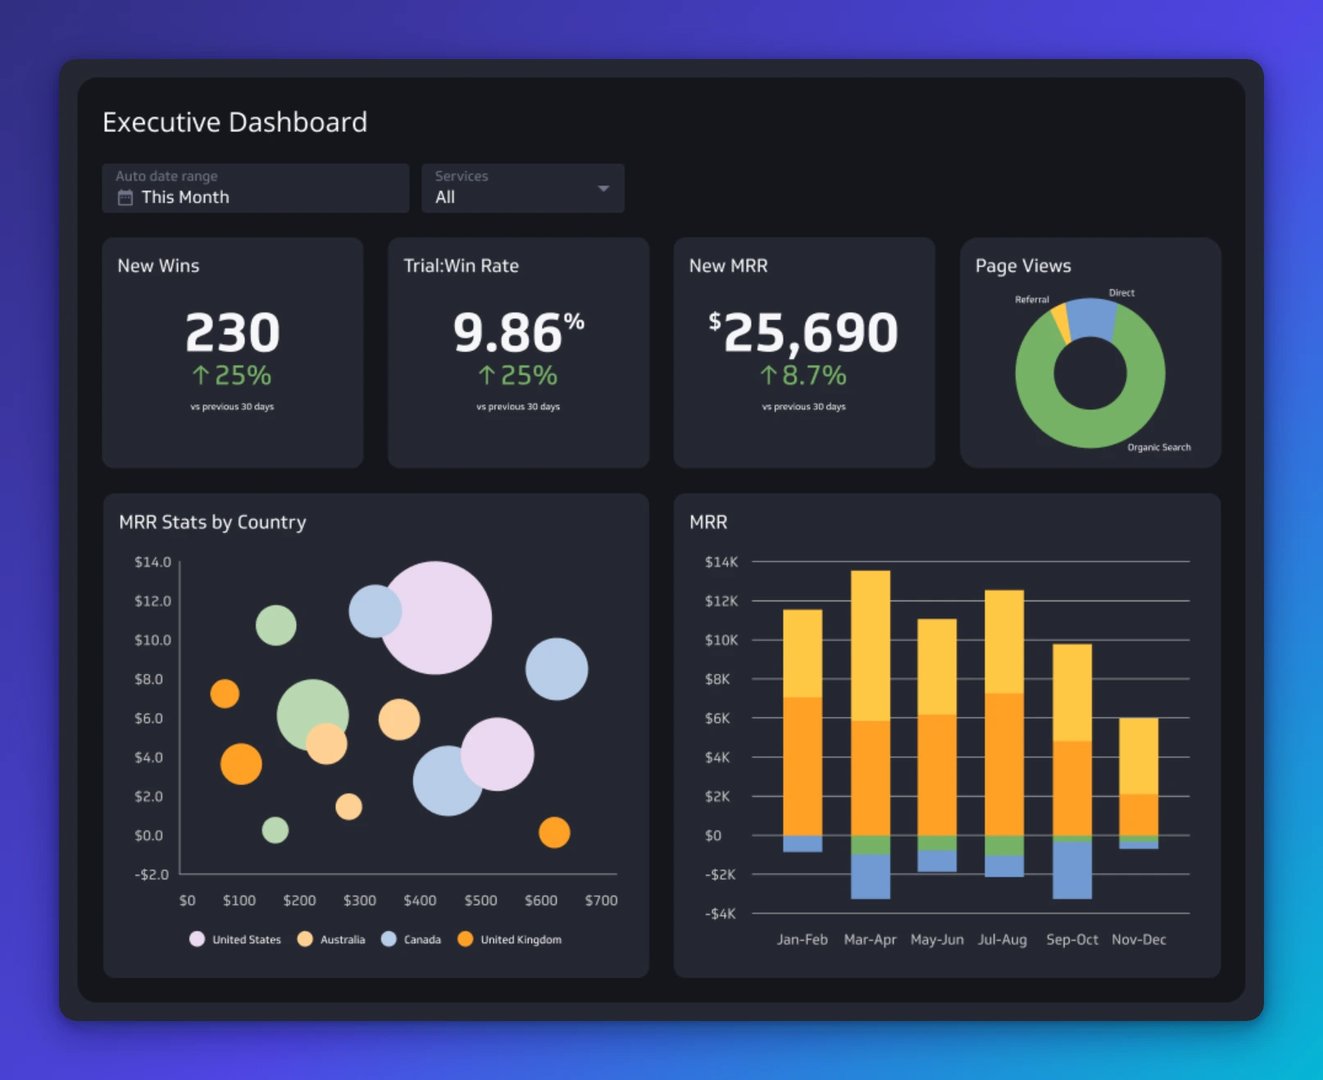
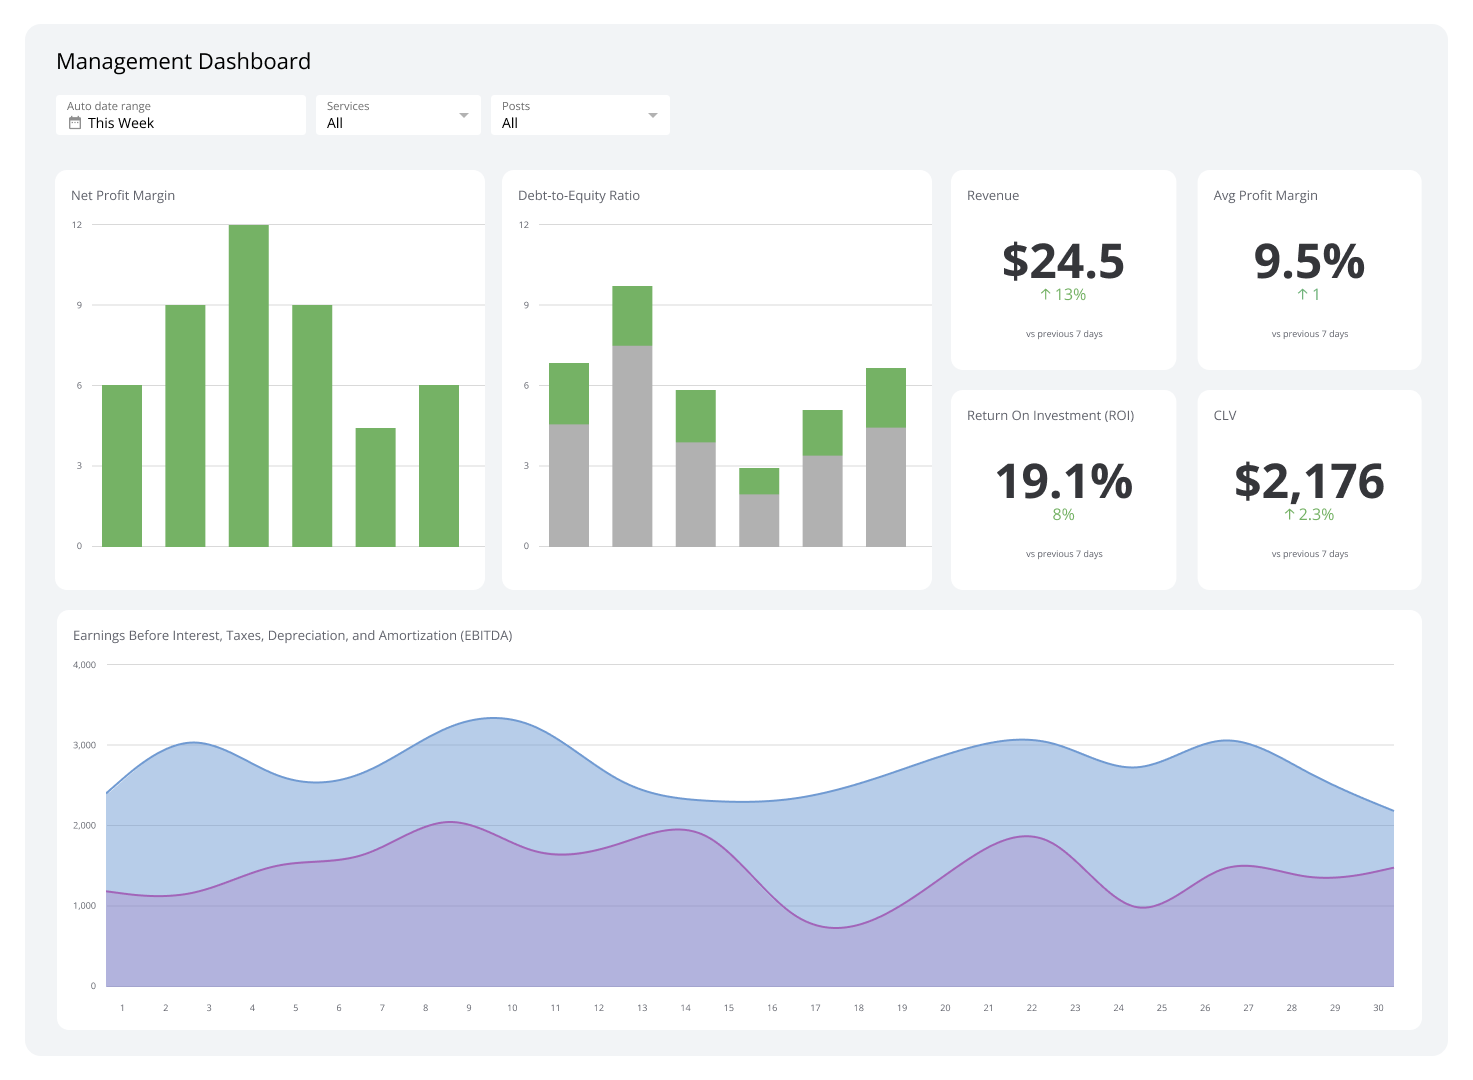
Executive dashboards compile data from finance, sales, marketing, and support into a single platform. Effective executive dashboards include metrics like Gross Profit Margin, EBITDA, Revenue, Opportunity Pipeline, ticket volume, and Average Resolution Time, giving leaders a clear picture of how the company is performing across all areas.
Klipfolio Klips can help you connect to various data sources, create dynamic visualizations, and deliver real-time updates so your executive team always has the most current information available.
SaaS dashboards
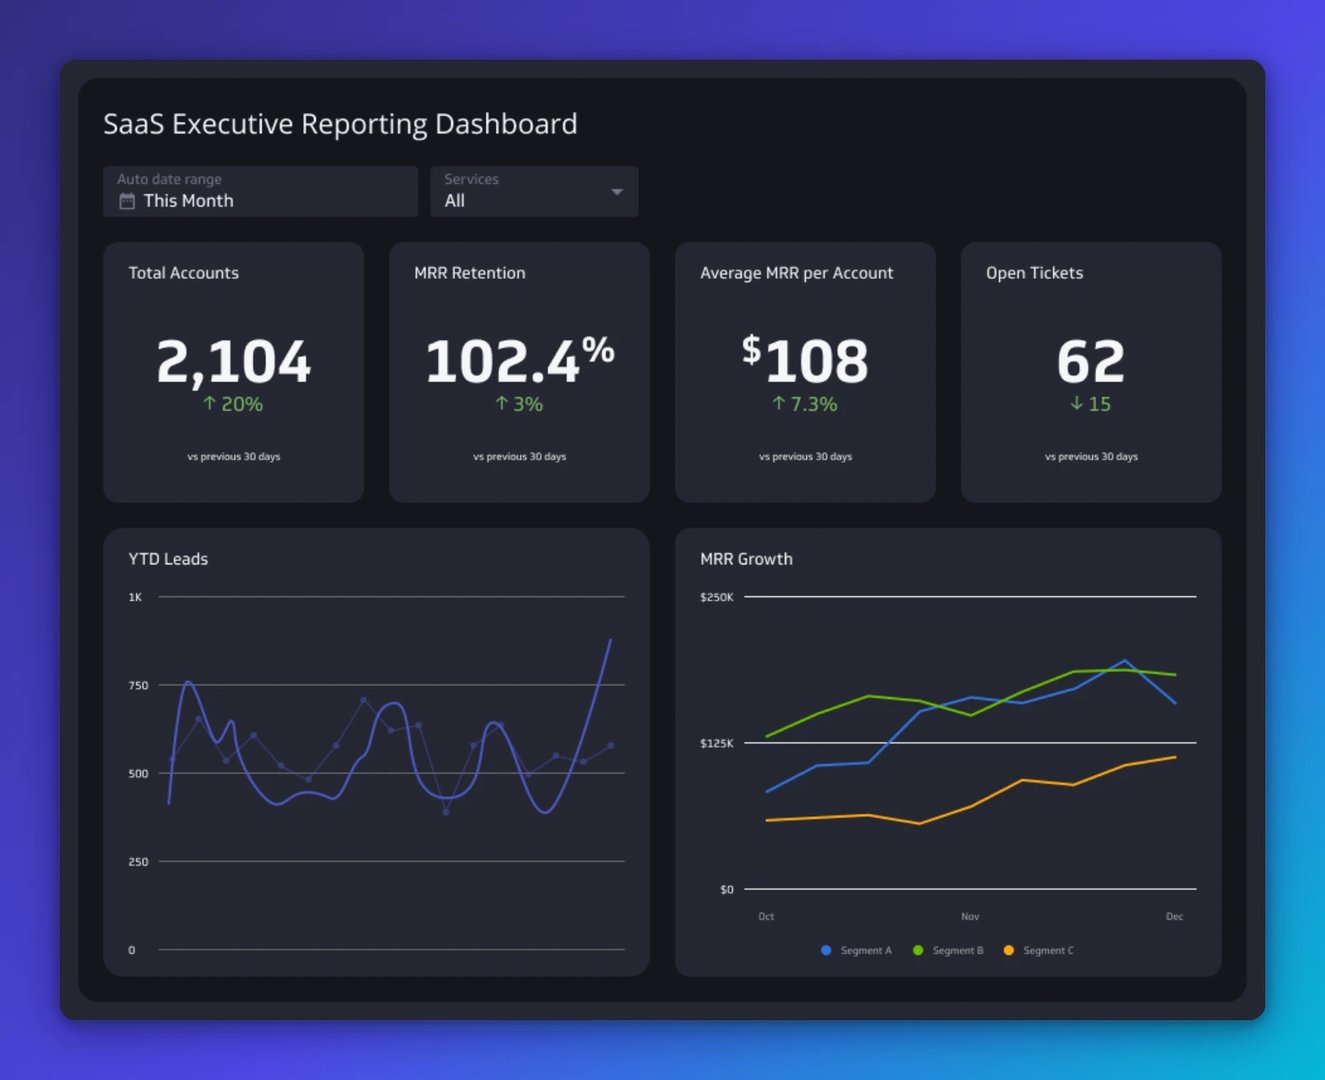
If you run a software company, a SaaS dashboard tracks vital metrics such as Monthly Recurring Revenue (MRR), Customer Acquisition Cost (CAC), Churn Rate, and Customer Lifetime Value (CLTV). Each team can monitor the metrics most relevant to their role: sales tracks MRR and new customer acquisition, while customer success focuses on Churn Rate and satisfaction scores.
Social media dashboards
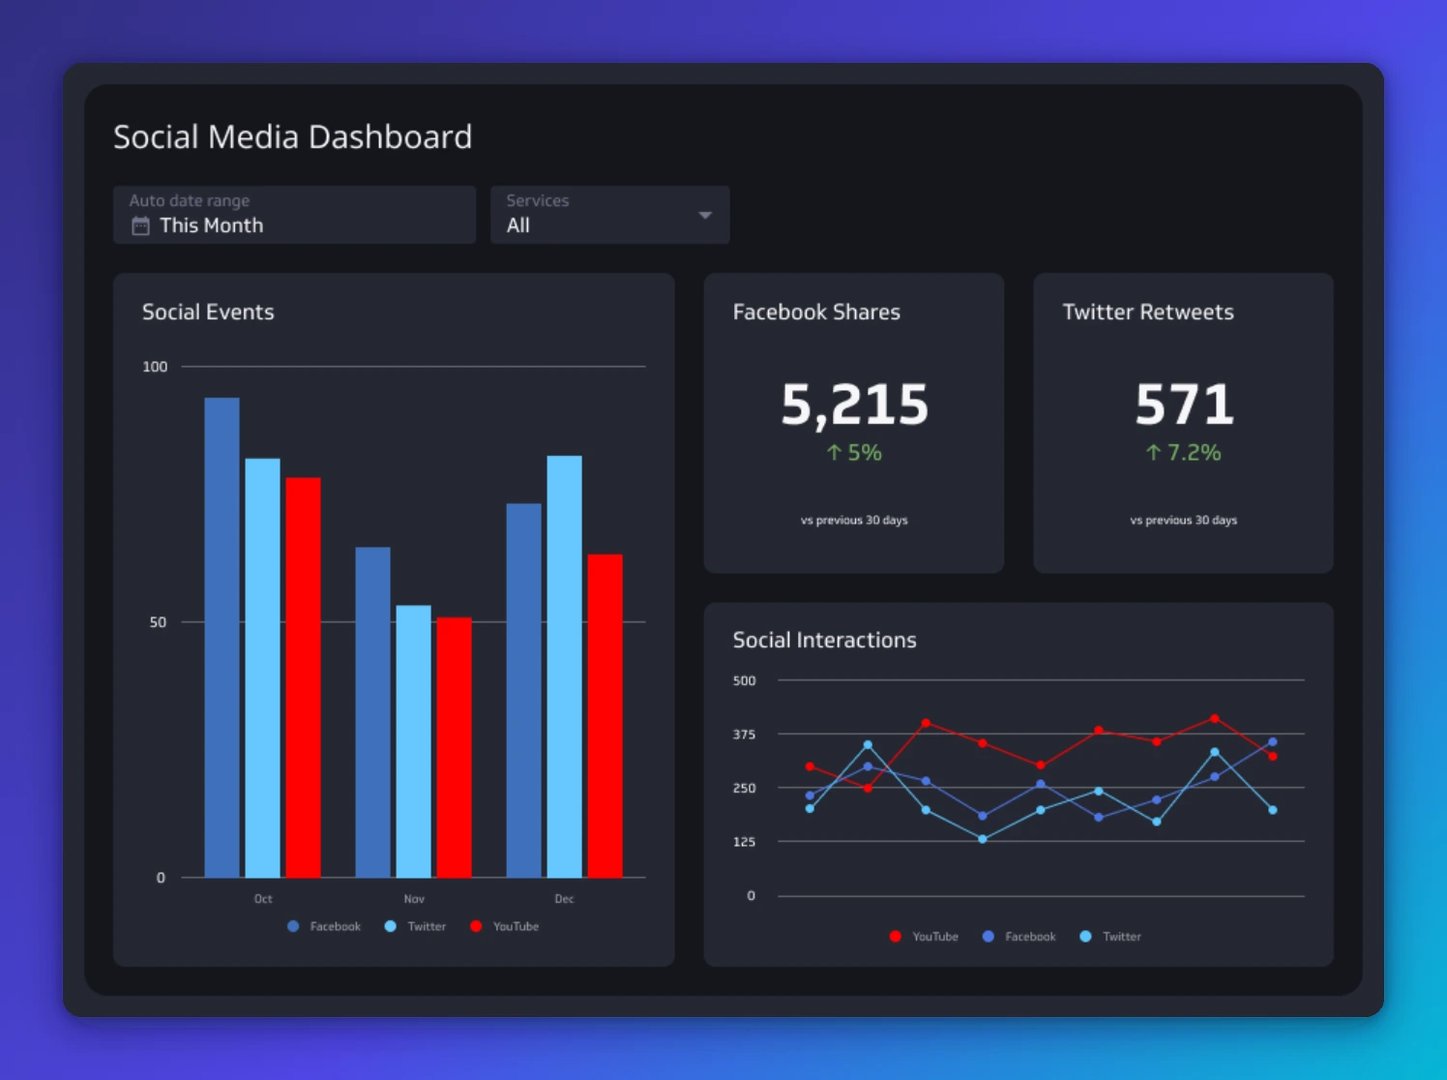
Social media dashboards help you track campaigns across platforms like Facebook, X, Instagram, and YouTube. They display key metrics, including followers, engagement, reach, impressions, likes, comments, shares, and video watch time, in a single view so you can understand your audience and refine your strategy for maximum impact.
Supply chain dashboards
Supply chain dashboards provide real-time visibility into inventory levels, Order Fulfillment Rate, shipment tracking, and supplier performance. By consolidating this data in one place, supply chain managers can improve efficiency, reduce costs, and ensure timely delivery of products.
Customer support dashboards
Customer support dashboards track ticket volume, response times, resolution rates, Customer Satisfaction Score, and agent performance. Monitoring these metrics in real time helps you identify periods of high demand, allocate resources effectively, and pinpoint areas where additional training may be needed.
How to build an effective digital dashboard
Identify key metrics and KPIs
Start by identifying the metrics and KPIs that matter most for your goals. If you're focused on sales, consider Revenue, Lead Conversion Rate, and Average Deal Size. You can select and track these essential KPIs with Klipfolio Klips, which includes a comprehensive metric catalog to help you manage and govern your data.
Connect to your data sources
Connect your dashboard to your data sources so it always displays current, relevant information. Klipfolio Klips supports integration with many data sources, including Google Analytics, Salesforce, and SQL databases. Robust API connectivity makes it straightforward to automate data updates and keep your dashboard current.
Clean your data for accuracy and relevance
Accurate data is the foundation of reliable insights. Before your data feeds into your dashboard, remove duplicates, correct errors, and standardize formats. Klipfolio Klips offers data transformation features, including formula application, type conversion, and validation rules, to help you clean and prepare your data.
Customize your dashboard for specific business needs
Choose visualizations that best represent your data. Use bar charts for comparing performance over time, or pie charts to show distribution. Klipfolio Klips lets you create custom themes and styles so your dashboards are both functional and aligned with your brand identity.
Incorporate interactive elements
Add interactive elements like drop-down menus, filter widgets, and date range selectors so users can explore data and gain deeper insights. Klipfolio Klips supports clickable charts and other interactive features that make dashboards more engaging and useful.
Maintain a simple and intuitive design
Display only the most essential information. Use clear labels, consistent colours, and a logical layout to make the dashboard easy to navigate. Klipfolio Klips offers customizable templates that help you design a clean, user-friendly experience without sacrificing functionality.
Confirm real-time data updates are working
Once your dashboard is set up, verify that it delivers real-time updates automatically. Klipfolio Klips supports automatic data refreshes and live data feeds from cloud services and on-premise databases. Confirm your dashboard reflects the latest data at the interval you've set before sharing it with your team.
Mistakes to avoid when creating a digital dashboard
Data dumping
Overloading your dashboard with too much information makes it cluttered and hard to read. When a dashboard is packed with complex visuals and excessive data points, users miss critical insights. Focus on the metrics that drive decisions, and leave the rest out.
Neglecting your users' specific needs
Different users have unique requirements. A one-size-fits-all dashboard may not meet everyone's needs, leading to underutilization. Identify the main users of each dashboard, gather their input, and customize accordingly. Klipfolio Klips lets you create multiple views and filters so each user accesses the data most relevant to their role.
Lacking clear goals and KPIs
A dashboard without clear goals leads to confusion. Set measurable objectives that align with your business strategy, then use those to identify the most important KPIs. Review and update your dashboard regularly as your business objectives evolve.
Forgetting to maintain data accuracy
Inaccurate data leads to incorrect conclusions. When you can't trust a number, you end up back in spreadsheets or explaining your business from scratch every time you need an answer. Review and update your data sources regularly, implement automated quality checks, and encourage your team to flag discrepancies. Klipfolio Klips provides reliable data integration features to help you maintain data quality over time.
Create custom dashboards for you and your team.
Get started with KlipsBuild your digital dashboard with Klipfolio
Digital dashboards are essential for any business that wants to stay on top of performance and make confident, data-driven decisions. By consolidating data from multiple sources into a single, real-time view, they save time, reduce errors, and give a lean team the clarity of a much larger one.
Ready to bring all your business data into one place? Klipfolio Klips gives you the connectivity, customization, and distribution tools to build dashboards that work for every team, no credit card required.