Online Dashboard
Go beyond spreadsheets. See all your data in one place.
What is an online dashboard?
An online dashboard is a web-based tool that brings your key metrics and KPIs into one central, automatically updated view.
Is your business data scattered across spreadsheets, marketing platforms, and sales reports? That's a common challenge as you grow. An online dashboard solves it by replacing manual data-hunting with a single, clear picture of what's happening in your business, updated automatically.
Think of it as your company's command centre. Instead of juggling different files and logins, you get one place to see performance across every team and tool you rely on.
How online dashboards work
Modern online dashboards use secure, pre-built connectors (known as APIs) to automatically pull data from the services you already use, like GA4, Stripe, or HubSpot. Instead of copying and pasting data into a spreadsheet, the dashboard does the work for you, keeping your information constantly current.
The result is a real-time view of your business performance, accessible anytime through your web browser. Interactive features like filters and drop-down menus let you and your team explore the data without needing technical expertise. It's a powerful, lightweight way to monitor your business without the hassle of manual reporting.
Why your business needs an online dashboard
Whether you're an early-stage startup or a scaling company, data alignment is essential to growth. Manual reporting in spreadsheets is often riddled with errors, takes hours of effort, and produces outdated, hard-to-read information.
Here's how an online dashboard changes that for different roles:
- For leaders and managers: An executive dashboard provides a high-level overview of company health, making it easier to spot trends and make informed strategic decisions. You stop managing spreadsheets and start managing the business.
- For growing teams: As companies scale, alignment becomes critical. A shared dashboard ensures everyone tracks the same goals and KPIs, which eliminates confusion and keeps the entire team focused on what matters most. It creates a single source of truth that builds confidence and accountability.
Ultimately, an online dashboard replaces manual, error-prone reporting with an automated, beautifully presented, and shareable view of your business. It gets everyone on the same page.
Key features to look for in an online dashboard
Not all online dashboards are built the same. When evaluating options, look for a tool that covers these areas:
- Data connectivity: Can it connect to the tools you already use? Look for 100+ data connectivity integrations covering marketing, sales, finance, and operations platforms.
- Customization: Can you build the layout and visualizations your team actually needs? Flexible formula support and custom chart types matter here.
- Real-time refresh rates: How often does the data update? Refresh rates ranging from one minute to 24 hours give you flexibility based on how time-sensitive your metrics are.
- Distribution options: Can you share dashboards with different audiences? Features like role-based access, public links, TV mode, and scheduled PDF reports let you get the right data to the right people.
- Design and readability: Does it present data clearly? Clean layouts, custom themes, and automatic dark mode make dashboards easier to read and share.
Online dashboard examples by team
Online dashboards aren't one-size-fits-all. The metrics that matter to your marketing team differ from those your finance team tracks daily. Here are a few common examples:
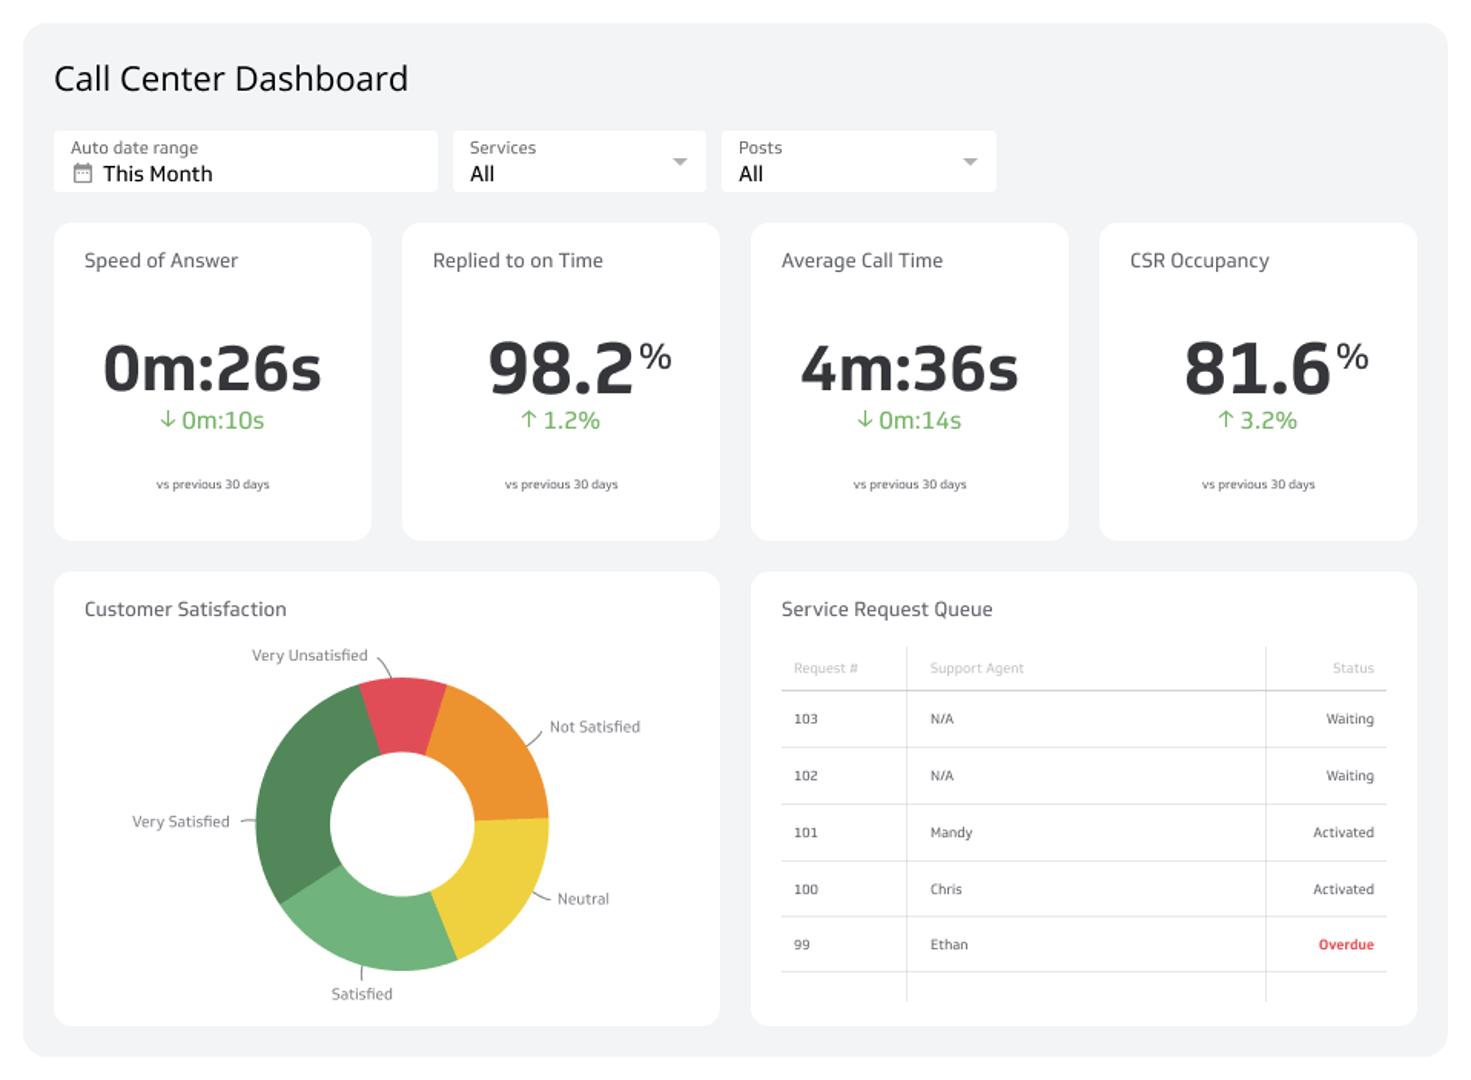
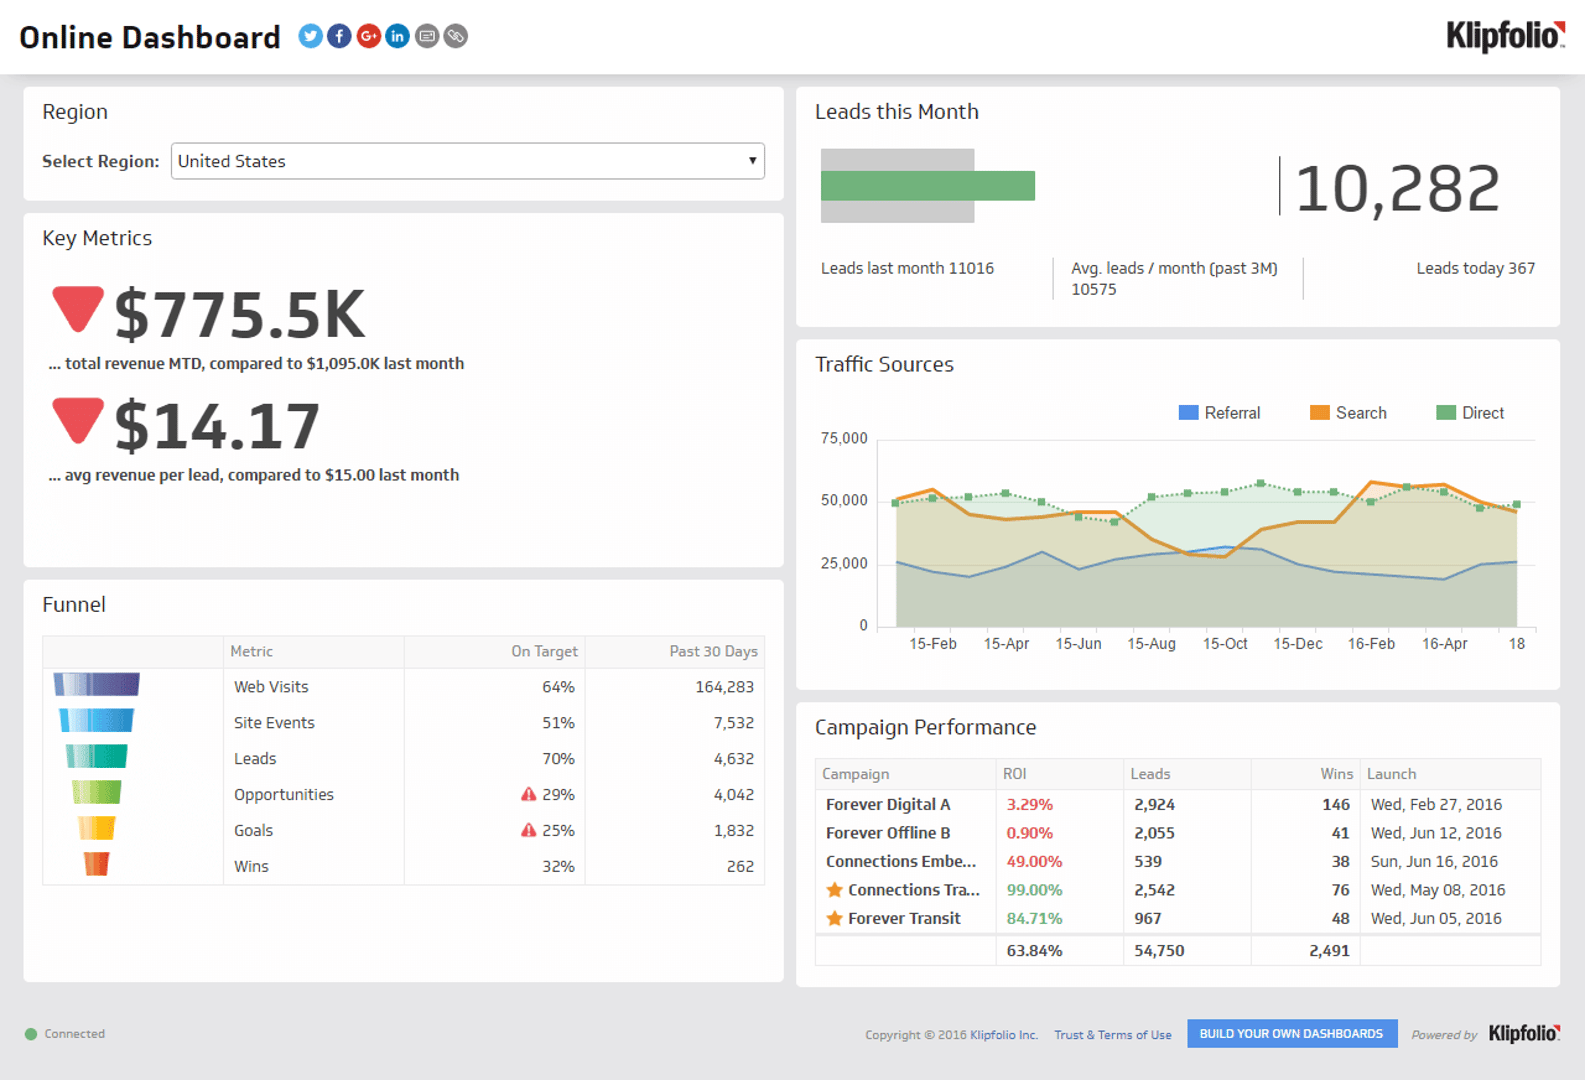
- Sales dashboard: Tracks pipeline value, win rate, deals closed, and revenue against target. Gives sales leaders a live view of team performance.
- Marketing dashboard: Monitors campaign spend, lead volume, conversion rates, and channel performance across paid, organic, and email.
- Finance dashboard: Displays revenue, expenses, gross margin, and cash flow in one view. Useful for weekly or monthly reporting to leadership.
- Executive dashboard: Combines high-level KPIs from across the business so leadership can assess overall health at a glance.
- Operations dashboard: Tracks project status, team utilization, delivery timelines, and resource allocation.
Each of these can be built and customized to reflect your specific goals, data sources, and reporting cadence.
How to build an online dashboard
Building an online dashboard doesn't require a data team or technical background. The process typically follows these steps:
- Identify your key metrics: Start with the three to five KPIs and metrics that most directly reflect your team's goals. Avoid the temptation to track everything at once.
- Connect your data sources: Use pre-built connectors to link your existing tools. Most modern dashboard platforms support one-click connections to popular services.
- Choose your visualizations: Match the chart type to the story you're telling. Use line charts for trends, bar charts for comparisons, and single-number tiles for at-a-glance KPIs.
- Set your refresh rate: Decide how often your data needs to update. Real-time dashboards suit sales floors and operations; daily or weekly refreshes work well for executive reporting.
- Share with your team: Use role-based access to control who sees what. Embed dashboards in internal tools, send scheduled reports, or display them on a TV screen in the office.
Start building with Klipfolio Klips
Klipfolio Klips is a complete dashboard tool built for growing companies. It connects to 130+ data sources, supports Excel-like formulas for custom data modelling, and offers 10 distribution methods so you can share insights the way your team works best.
Whether you need a polished executive dashboard or a live operational view for your team, Klips gives you the flexibility to build it without writing code.
Try Klips free, no credit card required.
At a glance
Focus Area
Dashboard education and product awareness for growing companies managing data across multiple tools.
Metrics List
KPIs, revenue, pipeline value, conversion rate, gross margin, lead volume, team utilization, cash flow.
Reference Rate
Real-time to daily refresh rates depending on reporting cadence and team use case.
Related Dashboards
View all dashboards