Supply Chain Dashboards
Track inventory, logistics, and supply chain KPIs in one live dashboard — no spreadsheet chasing required.
Managing supply chain operations without clear, consistent data means decisions get made on gut feel, outdated spreadsheets, or numbers pulled from three different systems that don't agree with each other. A supply chain dashboard puts the right numbers in front of the right people, so you can act with confidence instead of chasing information.
What is a supply chain dashboard?
A supply chain dashboard is a reporting tool that tracks supply chain KPIs and metrics in a single display, covering inventory levels, logistics management, and warehouse operations.
Why use supply chain dashboards?
Supply chain management means keeping track of thousands of moving parts, from inventory levels and supplier lead times to warehouse throughput and delivery performance. Without a clear view of your underlying KPIs, it's difficult to spot problems early or make confident decisions about where to act.
A supply chain dashboard gives you that view. Instead of waiting for someone to pull a number, pasting figures into a spreadsheet to compare them, or explaining your inventory situation to a generic AI tool from scratch every time, you see live data in one place. The numbers are consistent, they update automatically, and you know you're looking at the right figure before you act.
That matters most when something goes wrong. A supplier falls behind, a warehouse backs up, a shipment misses its window. The teams that catch those signals early are usually the ones with a reliable, always-on view of their operations, not the ones digging through tabs or waiting on a report.
Supply chain dashboard examples
Use these dashboard examples to see how organizations are managing their supply chain, logistics, and warehouse operations using KPIs, metrics, and data.
Supply Chain Dashboard Examples
- Supply Chain
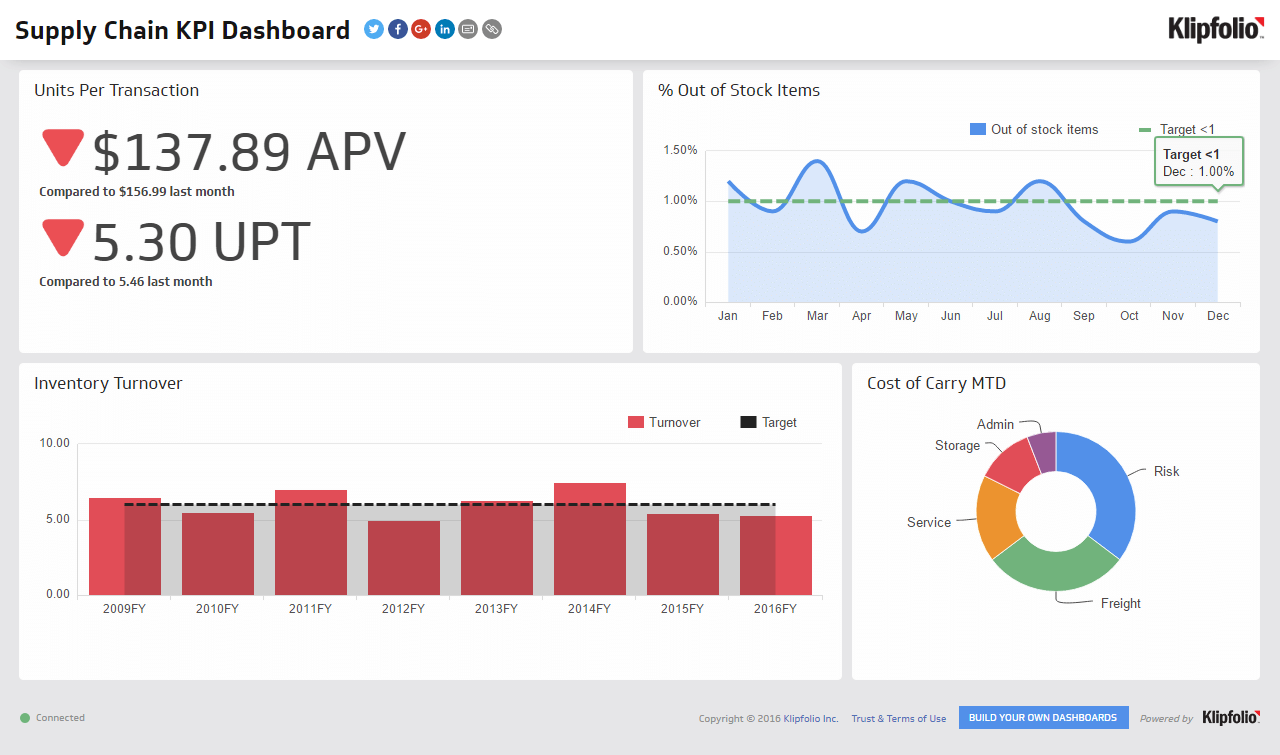
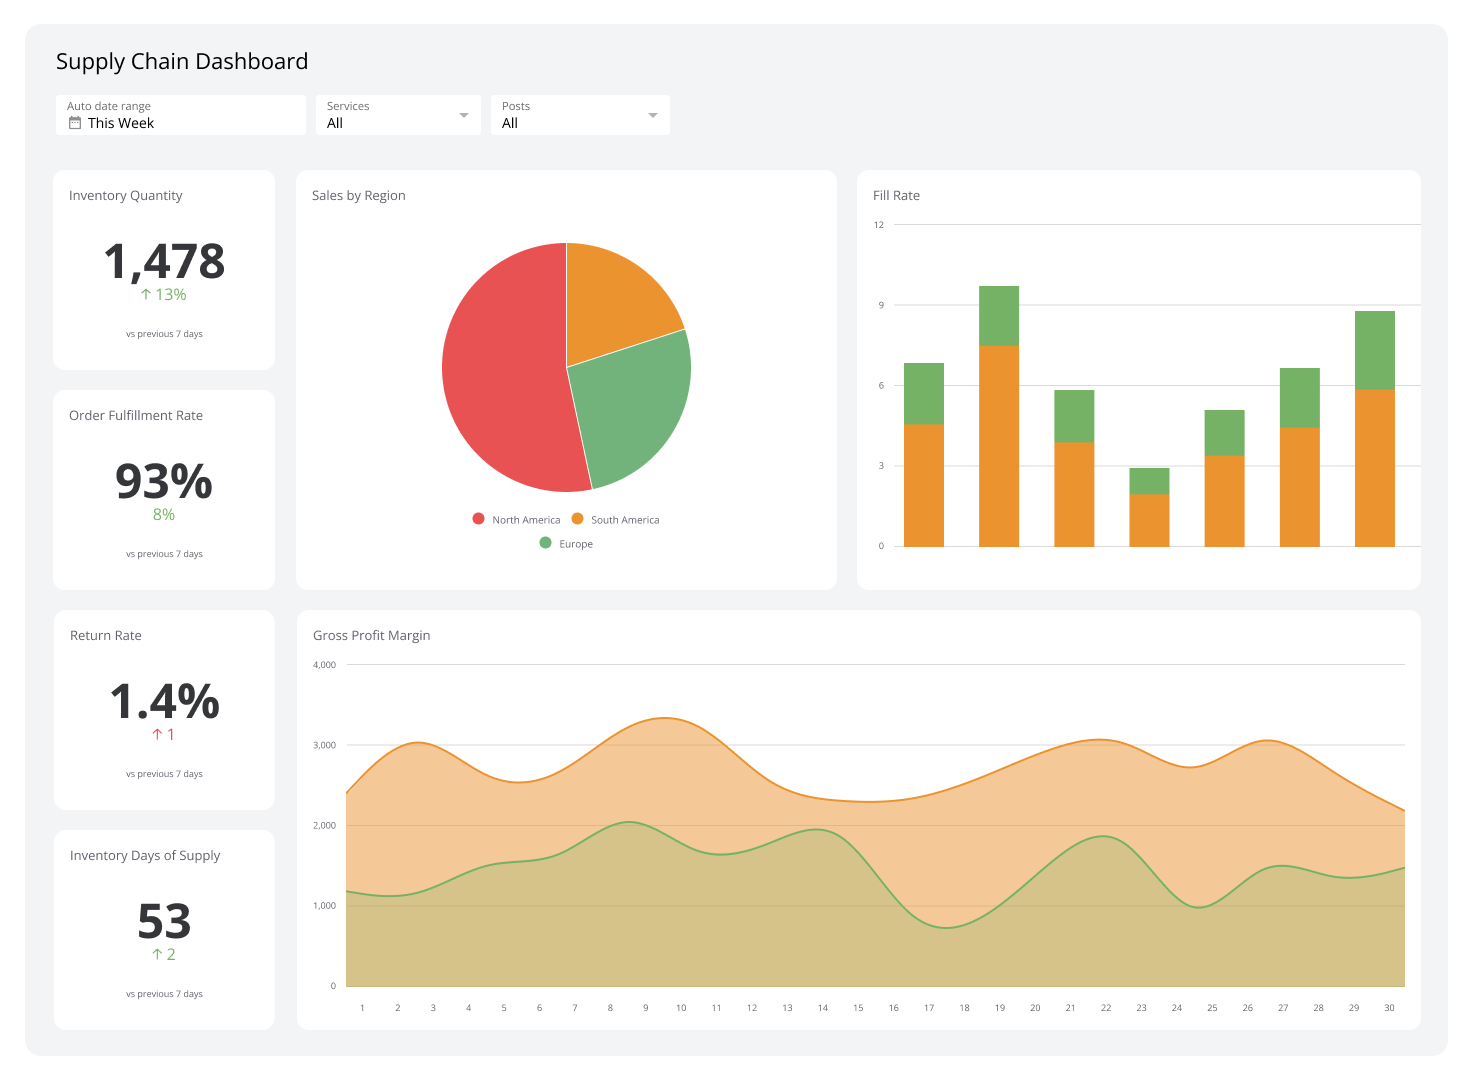
Supply Chain Dashboard
Track your operational health with essential supply chain KPIs.
- Supply Chain
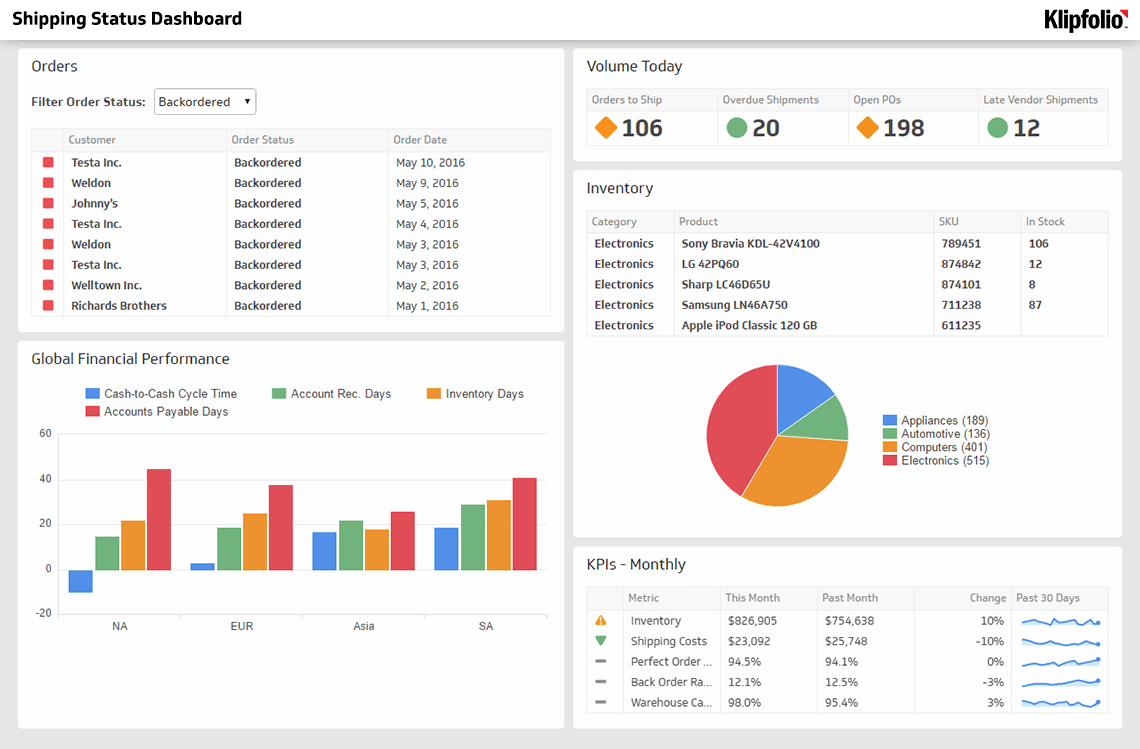
Shipping Status Dashboard
Gain end-to-end visibility of your supply chain operations.
- Supply Chain
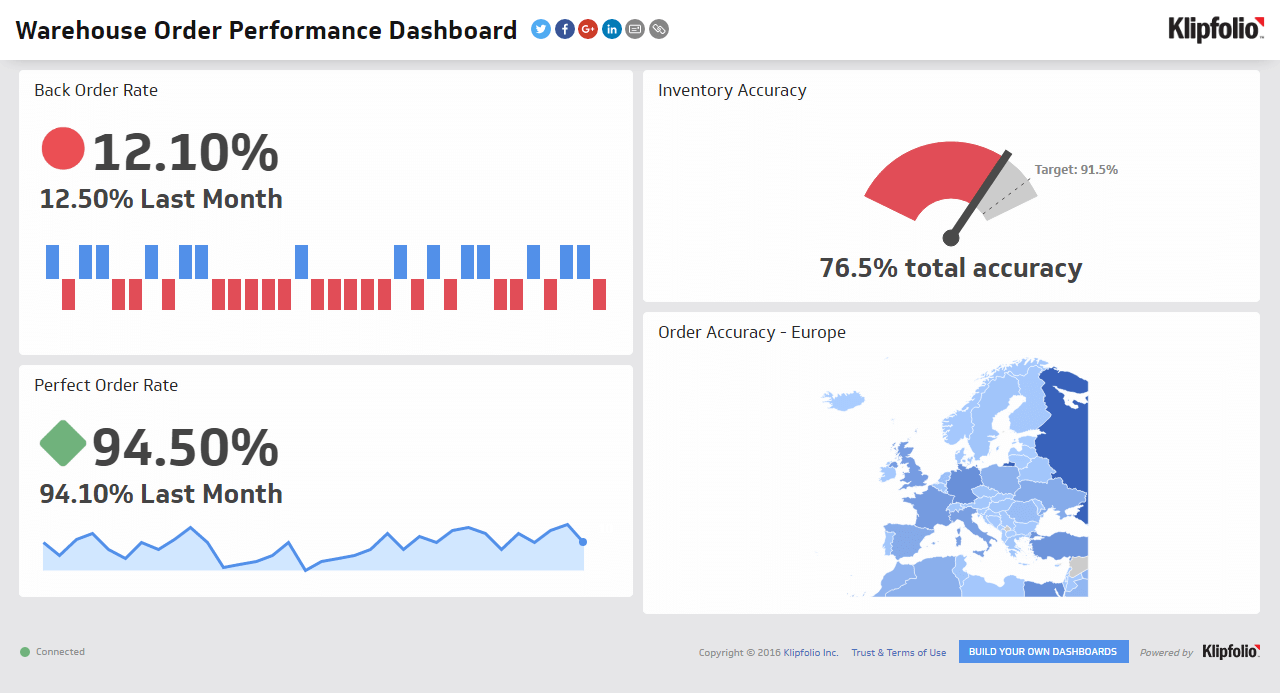
Warehouse Order Performance Dashboard
Streamline your shipping operations from inventory to delivery.
- Supply Chain
Inventory Dashboard
Track stock, turnover, and supplier KPIs to prevent stockouts and excess inventory.
- Supply Chain
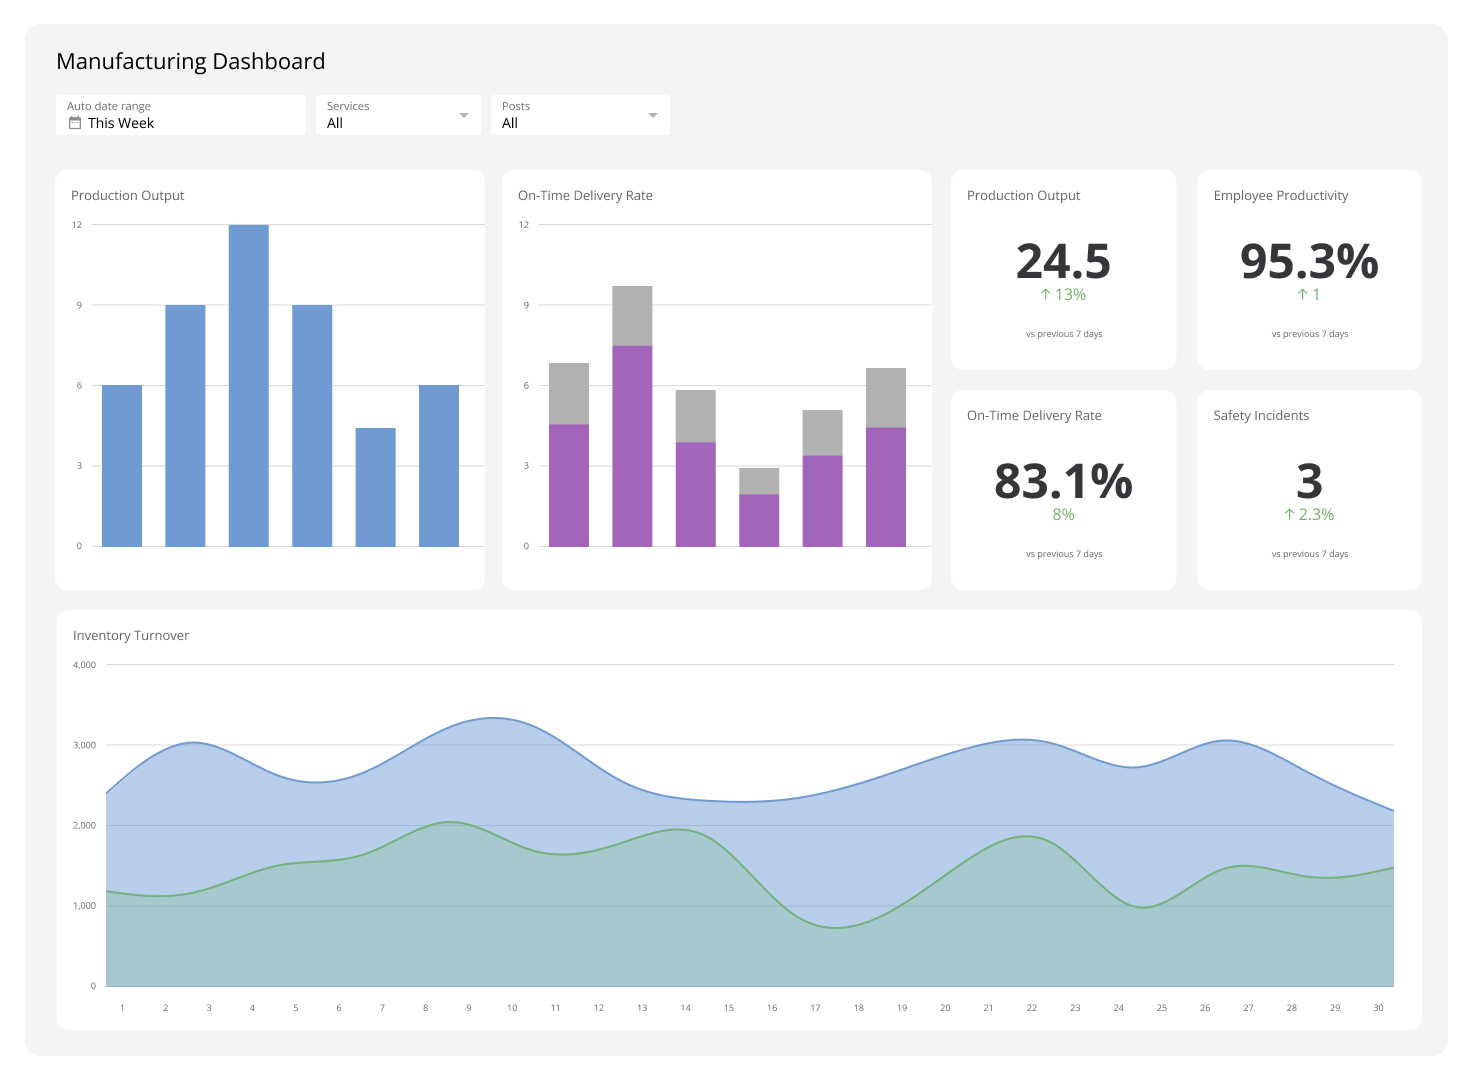
Manufacturing Dashboard
Track production, quality, and inventory with live manufacturing KPIs.