Warehouse Order Performance Dashboard
Streamline your shipping operations from inventory to delivery.
What is a warehouse order performance dashboard?
A warehouse order performance dashboard is a centralized view of your fulfillment operations, combining inventory, order, and shipping data in one place.
Managing a warehouse means juggling data from a dozen different places. Inventory counts live in one spreadsheet, order statuses sit in your e-commerce platform, and shipping updates are scattered across carrier websites. A warehouse order performance dashboard cuts through the noise by unifying all of this into a single, clear view.
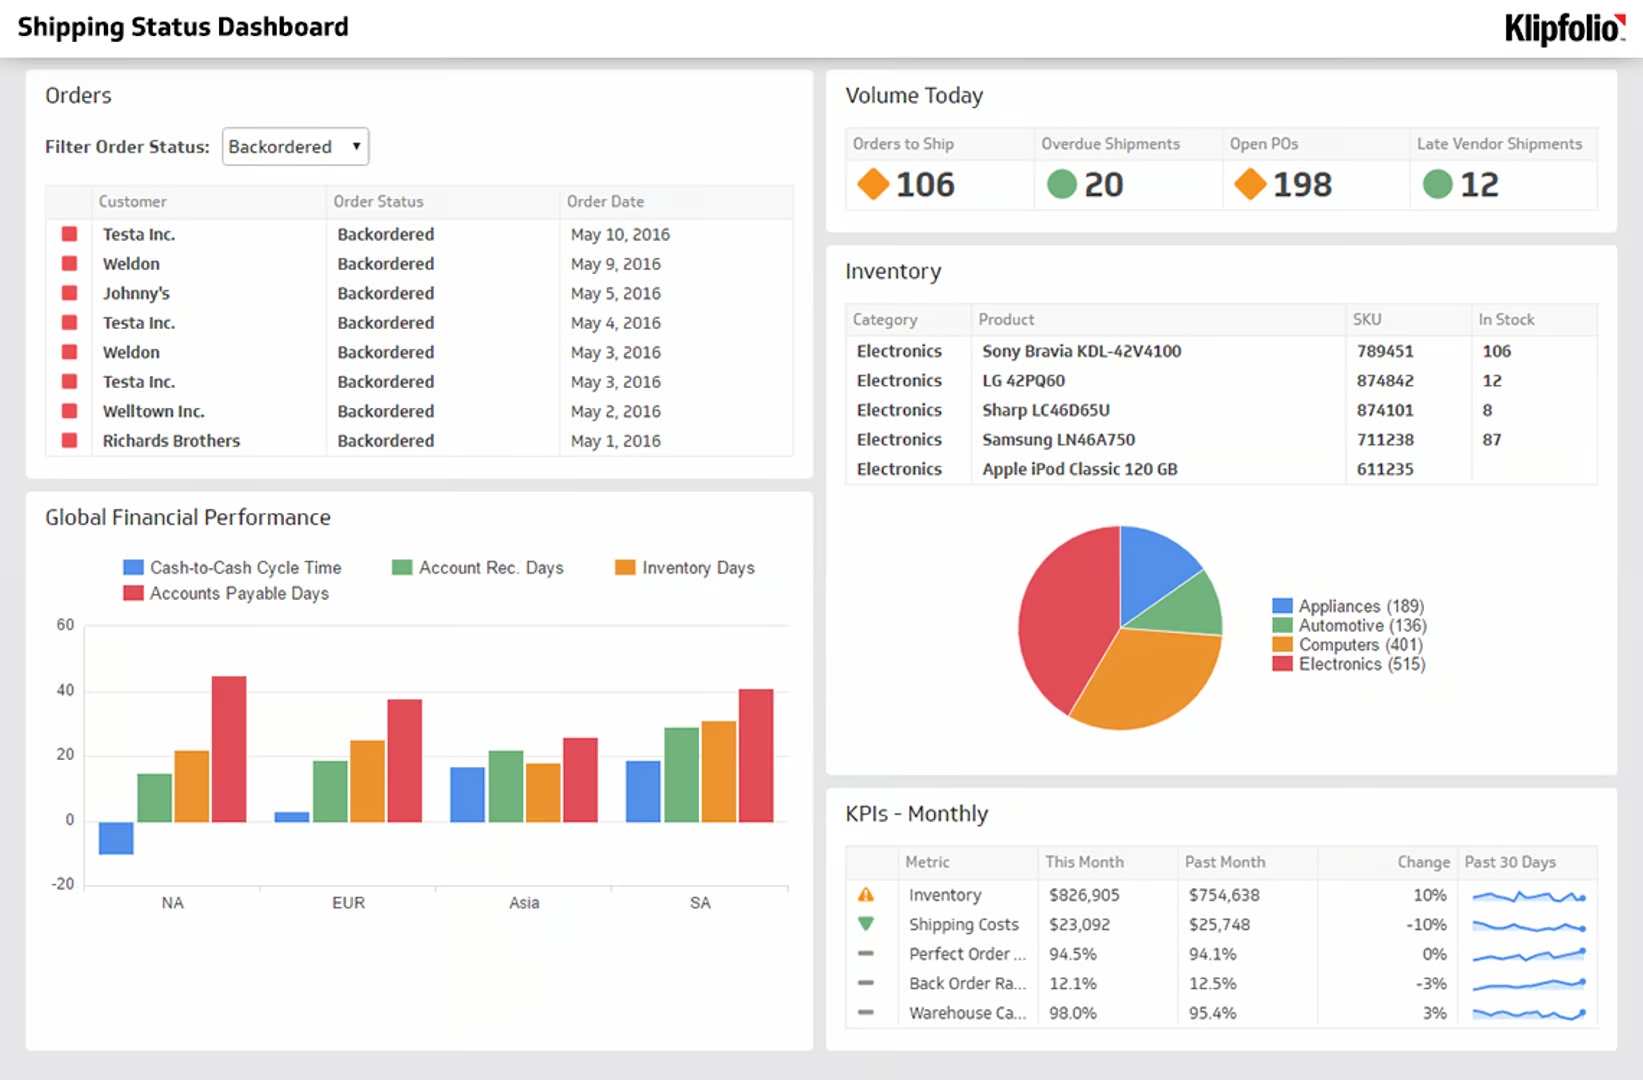
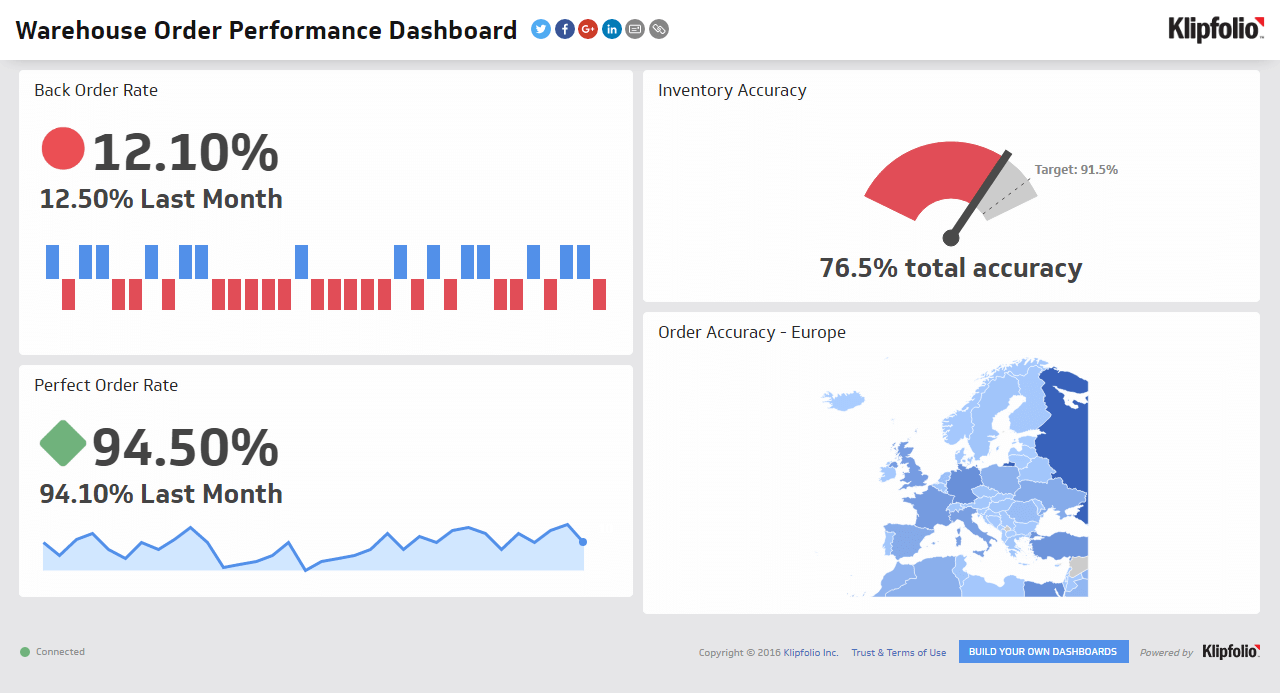
This dashboard gives you a real-time command centre for your entire fulfillment process. You can monitor everything from stock levels to final delivery, spot inefficiencies before they escalate, and confirm that orders reach customers accurately and on time. By visualizing performance by region on a map, you can also pinpoint whether shipping issues are concentrated in specific areas, which is useful for evaluating carrier performance and making smarter logistics decisions.
Key metrics for your Warehouse Order Performance Dashboard
To improve your warehouse, you need to track the KPIs that directly affect costs, efficiency, and customer satisfaction. A focused dashboard helps your team move beyond simply processing orders to making confident calls about the entire fulfillment cycle.
Here are the essential metrics to monitor:
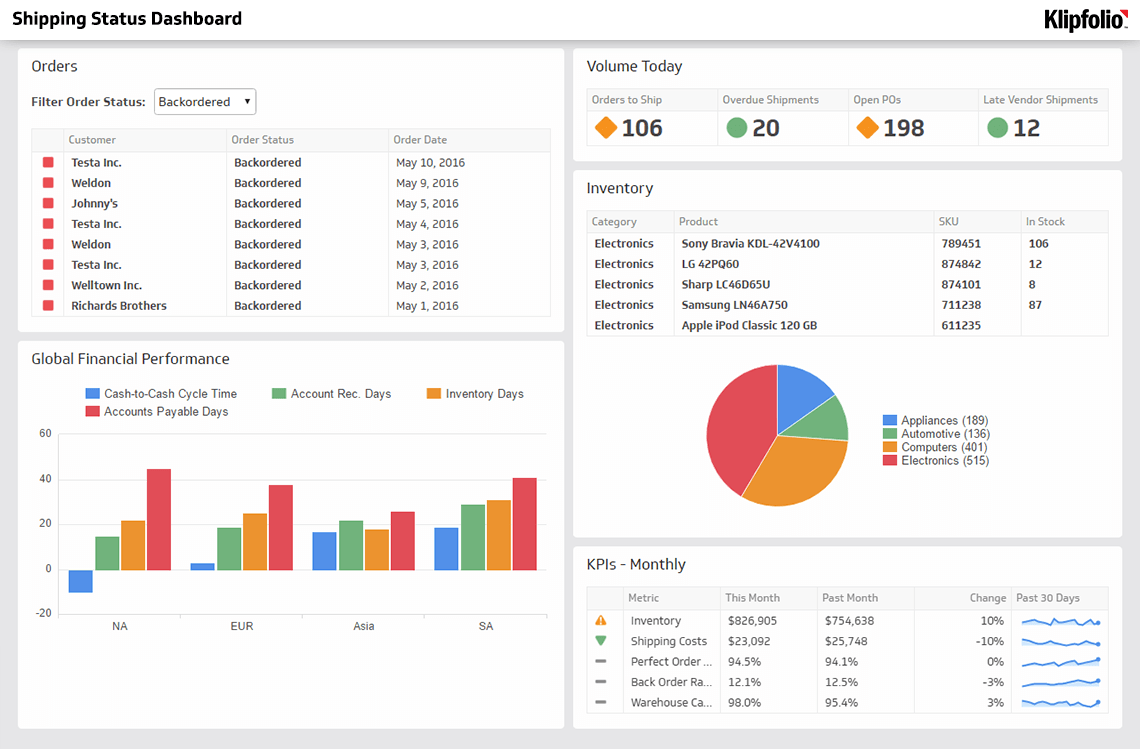
Inventory Accuracy: The foundation of warehouse efficiency. It measures the difference between your recorded inventory and your actual physical stock. High accuracy prevents costly stockouts and overstocking, so you always know what you actually have.
Perfect Order Rate: Your clearest signal on customer experience. It calculates the percentage of orders shipped without any issues, delivered on time, complete, and damage-free. When this number drops, you know exactly where to look.
Back Order Rate: A direct indicator of inventory health. It tracks how many orders can't be filled at the time of purchase. A high rate signals forecasting or stock management problems before they turn into lost sales.
Order Tracking: Visibility your team and your customers both need. Monitoring the order journey from warehouse to doorstep helps you manage expectations and address shipping delays before they become complaints.
Centralizing these metrics gives your team a single source of truth. Instead of waiting for someone to pull a number or pasting figures into a chat to make sense of them, everyone sees the same live picture, from the warehouse floor to the management team, and decisions happen faster as a result.
Create custom dashboards for you and your team.
Get started with KlipsWhy build this dashboard with Klips?
Klipfolio Klips connects to your e-commerce platforms, inventory systems, and carrier data through 130+ connectors and direct API integrations. You pull live data from multiple sources, model it with Excel-like formulas, and display it in a layout that fits how your team actually works.
Need to share performance with a regional manager? Use scheduled PDF reports or public links. Monitoring operations on the warehouse floor? Enable TV mode for a live display. Klips gives you the distribution flexibility to get the right data to the right people, without manual exports or static reports.
The result is a team that doesn't have to go looking for answers. The numbers are there, they're reliable, and they tell you what to do next.