Back Order Rate
Back Order Rate measures the percentage of customer orders that cannot be fulfilled at the time they are placed, due to insufficient inventory or supply chain disruptions.
Back Order Rate
What is Back Order Rate?
Back Order Rate is the percentage of customer orders that cannot be fulfilled at the time they are placed, due to insufficient inventory or supply chain disruptions.
When this number climbs, customers wait. And when customers wait too long, they leave.
Why Back Order Rate matters
A rising Back Order Rate is rarely just a stock problem. It signals a gap between what your customers expect and what your supply chain can deliver, and that gap has a direct cost: lost revenue, eroded trust, and customers who quietly move on.
Tracking Back Order Rate tells you:
- Where demand is outpacing supply, so you can adjust purchasing or production before the next stockout
- Which products carry the most risk, helping you prioritize safety stock decisions
- Whether seasonal patterns are predictable, so you can build lead time into your planning rather than react after the fact
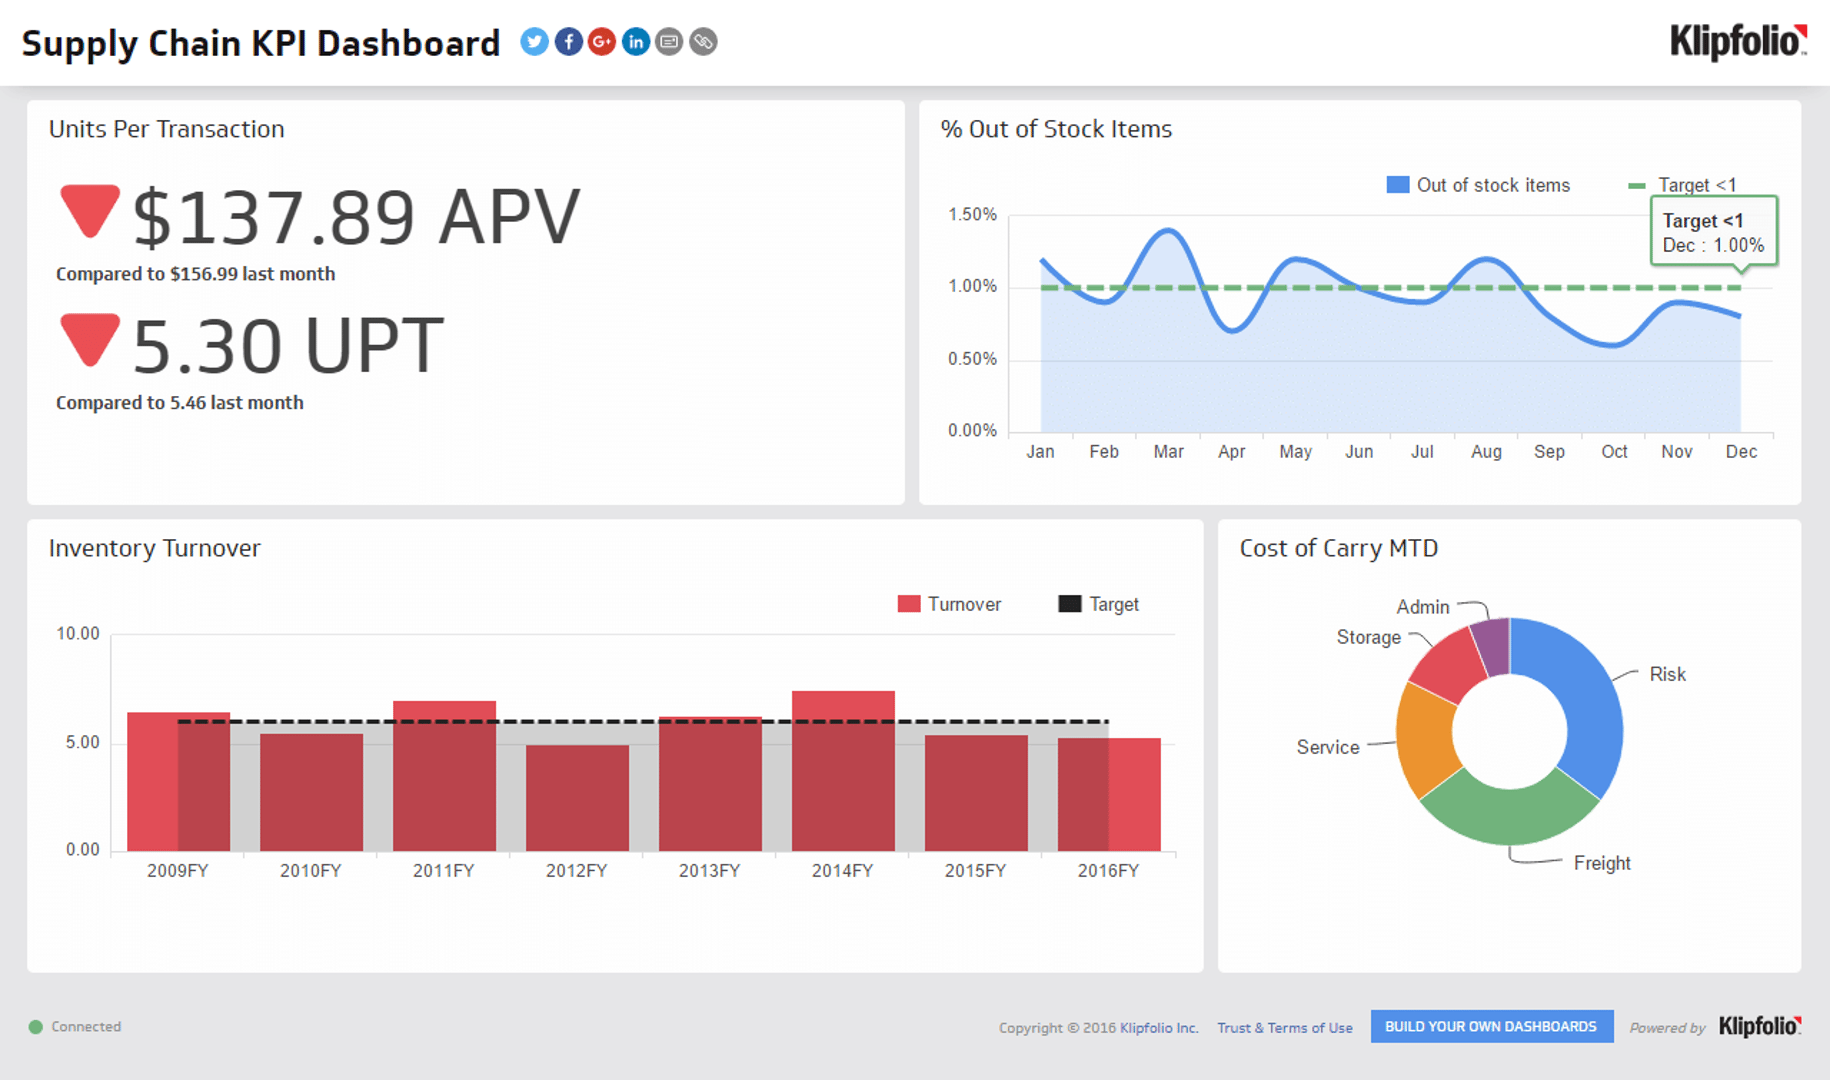
This KPI sits alongside the inventory accuracy KPI and the percentage of out of stock items KPI as a core measure of supply chain health. Together, they give you a clear picture of where fulfilment is breaking down.
How to calculate Back Order Rate
The formula is straightforward:
Back Order Rate = (Number of undeliverable orders / Total number of orders) × 100
Example: If you received 500 orders in a month and 40 could not be filled at the time of purchase, your Back Order Rate is 8%.
A lower percentage is always better. Most operations aim to keep Back Order Rate as close to zero as possible, though acceptable thresholds vary by industry and product type.
What causes a high Back Order Rate?
Several upstream factors drive back orders. The most common include:
- Inaccurate demand forecasting, where purchasing decisions don't account for actual sales velocity
- Supplier delays, especially when lead times extend without warning
- Seasonal demand spikes that aren't built into inventory planning
- Poor inventory visibility, where stock levels in your system don't reflect physical reality
- Single-source supply chains, which leave no buffer when a supplier can't deliver
Identifying the root cause matters more than tracking the number itself. A back order rate that spikes every November points to a forecasting gap. One that stays persistently high points to a structural inventory or supplier problem.
What is a good Back Order Rate?
There is no universal benchmark. The right target depends on your industry, product category, and customer expectations. That said:
- Below 2% is generally strong performance for most product-based businesses
- 2% to 5% is acceptable but worth monitoring for upward trends
- Above 5% warrants a review of forecasting, supplier reliability, and safety stock levels
Compare your rate against previous periods first. A sudden increase is often more telling than the absolute number.
How to reduce Back Order Rate
Bringing this metric down requires action at the planning and supplier level, not just the warehouse:
- Improve demand forecasting by incorporating historical sales data, seasonal trends, and external signals
- Set safety stock levels for high-velocity or high-risk SKUs
- Diversify suppliers so a single delay doesn't cascade into widespread back orders
- Tighten inventory accuracy so your system reflects real stock levels at all times
- Shorten replenishment cycles where possible to reduce the window of exposure
Create custom dashboards for you and your team.
Get started with KlipsTracking Back Order Rate on a dashboard
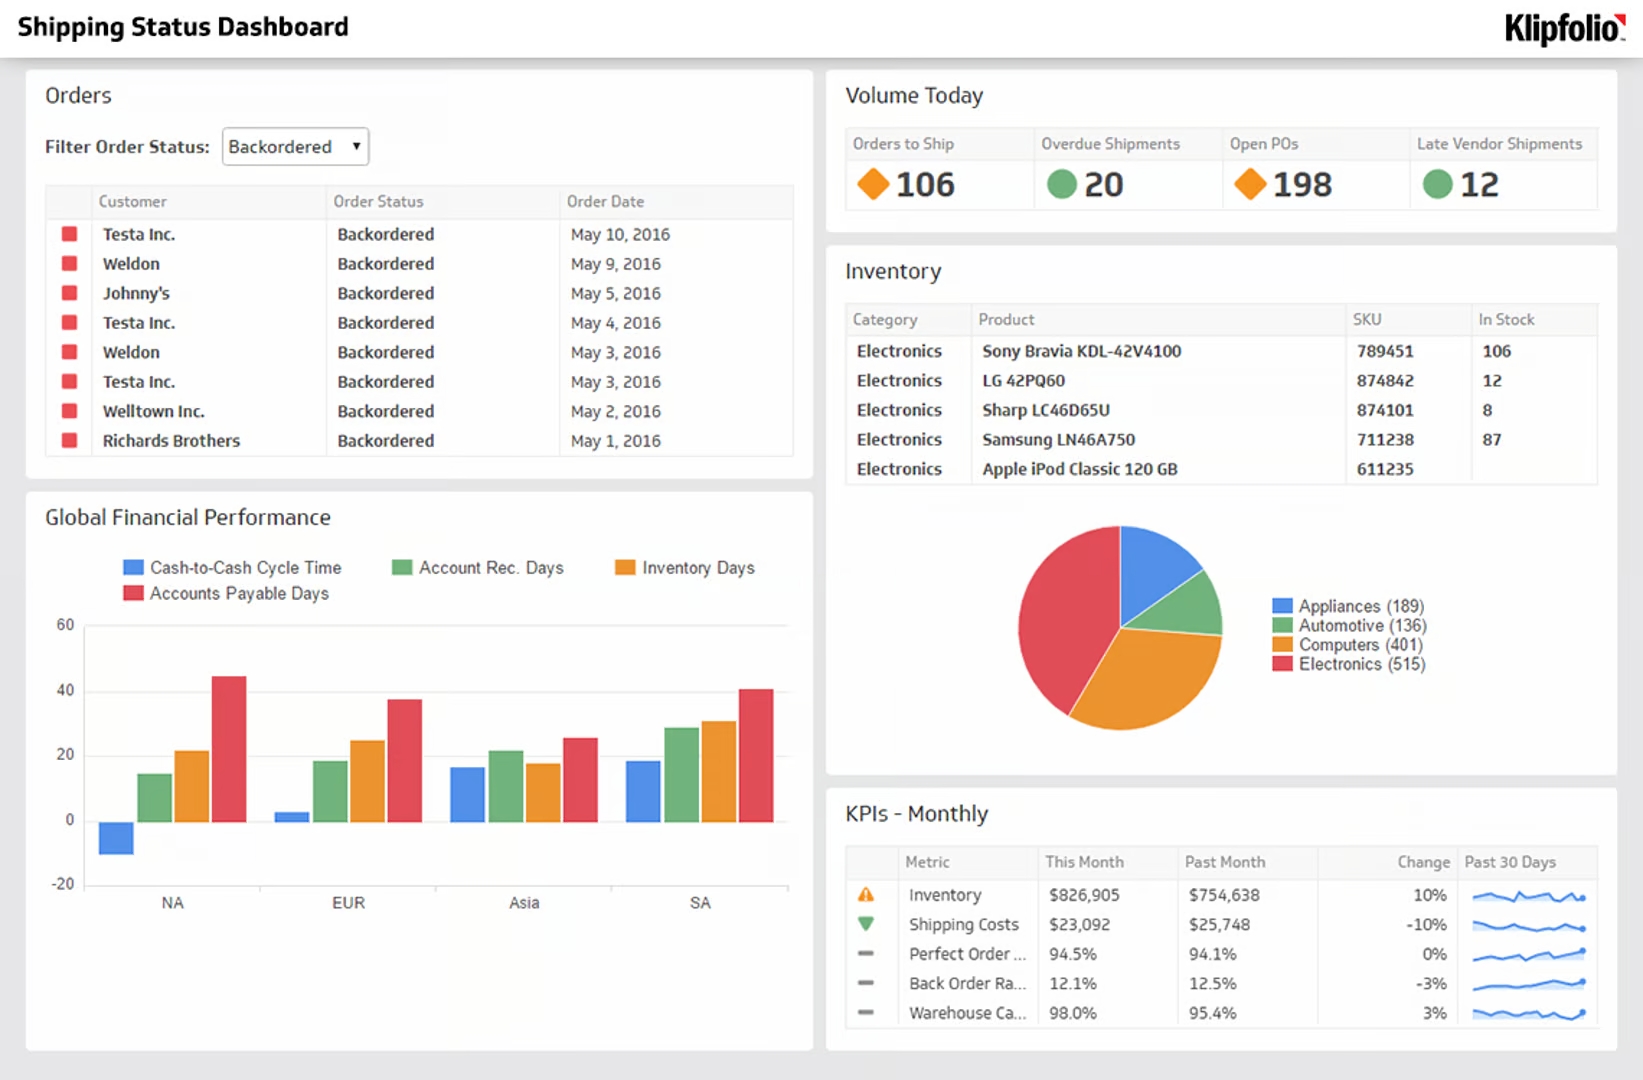
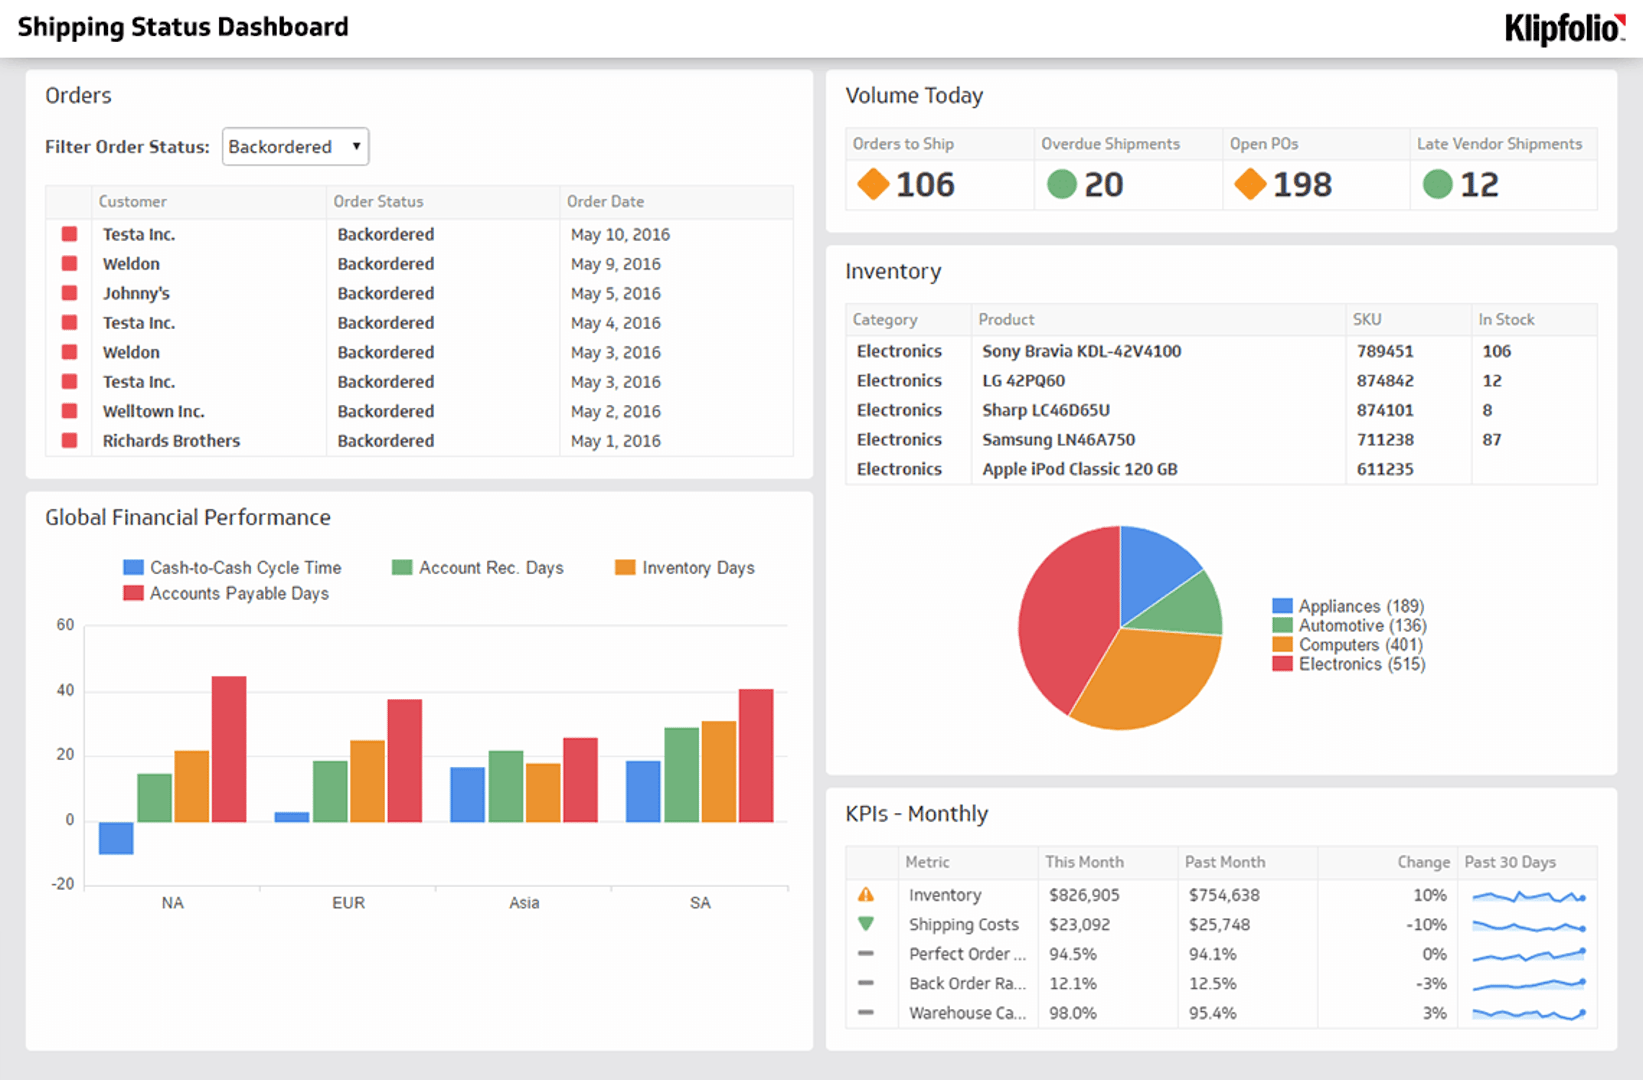
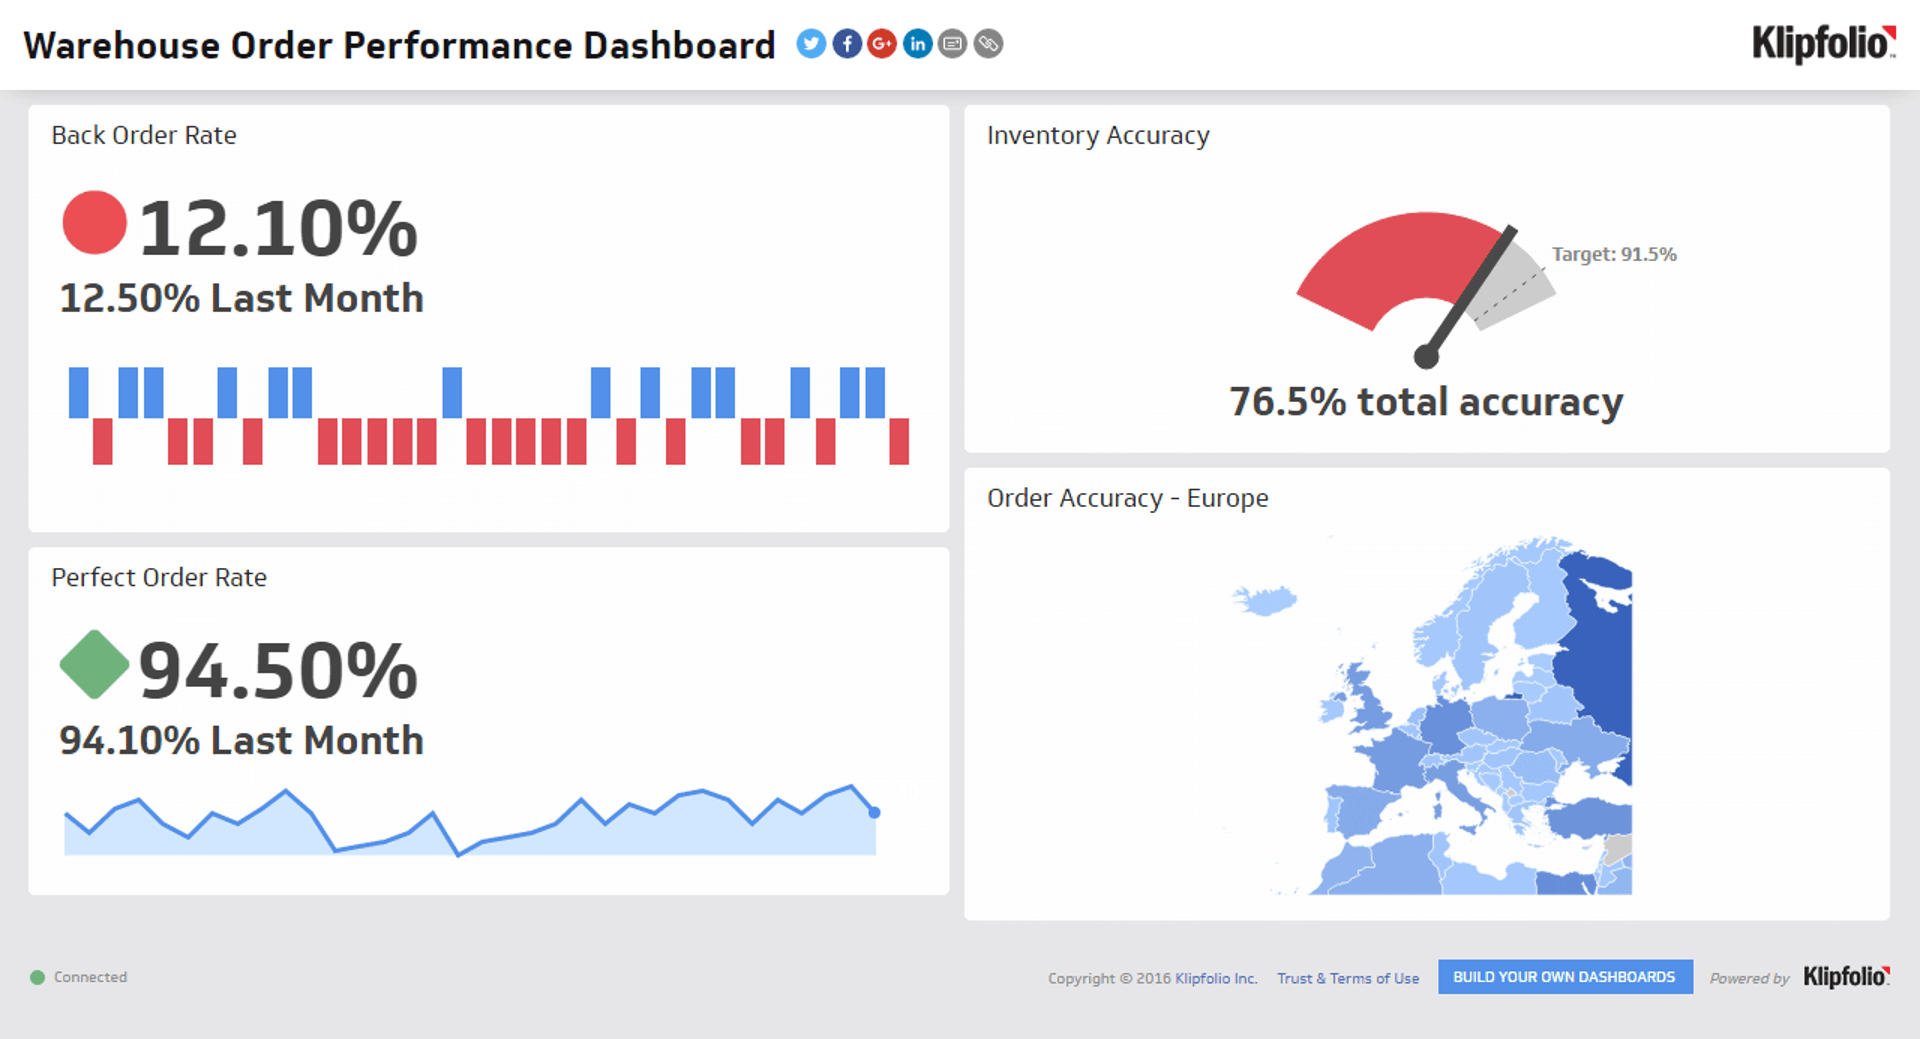
Checking Back Order Rate once a month isn't enough if orders are filling daily. The value of this metric comes from seeing it in context, alongside fill rate, inventory accuracy, and supplier lead times, updated frequently enough to act on.
A supply chain dashboard keeps Back Order Rate visible to the people who can do something about it: operations leads, purchasing managers, and the executives accountable for fulfilment performance. When the number moves, everyone sees it at the same time, without waiting for a report or pasting numbers into a spreadsheet to figure out what changed.