
22 supply chain metrics and KPIs worth tracking
Metrics and KPIs for modern supply chain operations
Inventory to Sales Ratio
Back Order Rate
Data tells you what's working in your supply chain and what isn't. According to a Deloitte survey, 79% of companies with reliable, data-driven supply chain metrics perform better and scale faster than those without. The challenge isn't finding metrics to track; it's knowing which ones actually tell you something useful.
This guide covers the 22 most valuable supply chain metrics and KPIs, what each one tells you, and how to calculate it.
What are supply chain metrics?
Supply chain metrics and KPIs are the numbers that tell you how quickly, efficiently, and accurately you're fulfilling orders and getting goods to customers. They reveal where your operations are working and where they're costing you time, money, or customer trust. Most metrics work best in combination: a single number rarely tells the full story, but together they show you exactly where to act.
Why supply chain metrics and KPIs matter
Data-driven businesses ultimately perform better over time because leaders make decisions on facts, not instinct. Key Performance Indicators (KPIs) give you that clarity across your supply chain. They let you identify strengths and weaknesses in logistics and fulfillment, catch problems before they become costly, increase inventory accuracy, improve customer satisfaction, and find bottlenecks before they damage your margins.
22 most valuable supply chain metrics and KPIs
Inventory Turnover Ratio
The Inventory Turnover Ratio measures how often your products are sold within a given period. A slow ratio may signal a pricing issue or a shift in demand. A high ratio confirms which products to prioritize and when to scale. Always factor in your industry's external conditions: in fashion and apparel, seasonal factors can suppress turnover for specific product lines. This figure is most useful as an average across multiple periods, not a one-time snapshot.
Inventory Turnover Ratio = Cost of goods sold / Average Inventory
Average Inventory = (Start inventory + Final inventory) / Months in the accounting period
Service Rate
The Service Rate measures the percentage of customer orders fulfilled within a specific time frame. A low rate points to supply chain problems: stockouts, delayed deliveries, or fulfillment gaps. Left unaddressed, it erodes customer loyalty.
Service Rate = (Product orders delivered on time / Product orders received) x 100
Fill Rate
The Fill Rate tells you what percentage of orders you fulfilled without resorting to backorders or stockouts. A strong Fill Rate means customers get what they ordered, when they expected it. A weak one signals a mismatch between forecasting and actual demand. Aim as close to 100% as possible.
Fill Rate = (Successful orders / Received orders) x 100
On-Time and In Full Deliveries (OTIF)
OTIF measures the percentage of deliveries that arrived on time and in full. It combines two signals: whether you delivered when promised and whether you delivered everything ordered. Research shows that 17% of customers.) are likely to stop buying from a business after a single late delivery. OTIF keeps that risk visible.
OTIF = (On-time delivery percentage + In-full delivery percentage) / 2
Damage-Free Delivery
Damage-Free Delivery measures the percentage of orders that arrived in acceptable condition. Damaged goods hurt customer satisfaction and eat directly into your margins through returns, replacements, and reputational cost. Aim for 100%; anything less warrants investigation through better packaging, improved handling protocols, or a carrier switch.
Damage-Free Delivery = [(Total orders – Damaged orders) / Total orders] x 100
Supply Chain Metrics & KPIs
Back Order Rate
Back Order Rate measures the percentage of customer orders that cannot be fulfilled at the time they are placed, due to insufficient inventory or supply chain disruptions.
Carrying Cost of Inventory
Measure how much it costs to carry inventory.
Inventory Accuracy
Measures how closely your physical stock count matches what's recorded in your inventory management system.
Inventory to Sales Ratio
Measure the amount of inventory you carry compared to the number of sales orders being fulfilled.
Inventory Turnover
Measure how many times a year your organization sells and replaces its entire inventory.
Order Status
Tracks the real-time status of all orders and categorises each one based on its current state, such as "Backordered," "On Hold," or "Shipped."
Order Tracking
Monitor the current status and accuracy of orders that are being shipped to your customers.
Percentage of Out of Stock Items
Track the percentage of products unavailable when customers order to identify demand planning gaps and prevent lost sales.
Perfect Order Rate
Measures the percentage of orders delivered on time, complete, undamaged, and with accurate documentation.
Rate of Return
Track and reduce product returns to improve customer satisfaction and profitability.
Units Per Transaction
Measure the average number of units purchased per transaction to set baselines and improve basket size.
Backorder
A backorder occurs when a customer places an order for a product that isn't currently in stock but will be fulfilled once inventory is replenished.
Cash Conversion Ratio
Cash Conversion Ratio (CCR) measures what percentage of a company's EBITDA converts into operating cash flow. A CCR of 1 means every dollar of profit becomes a dollar of usable cash.
Supply Chain Dashboard Examples
- Supply Chain
Inventory Dashboard
Track stock, turnover, and supplier KPIs to prevent stockouts and excess inventory.
- Supply Chain
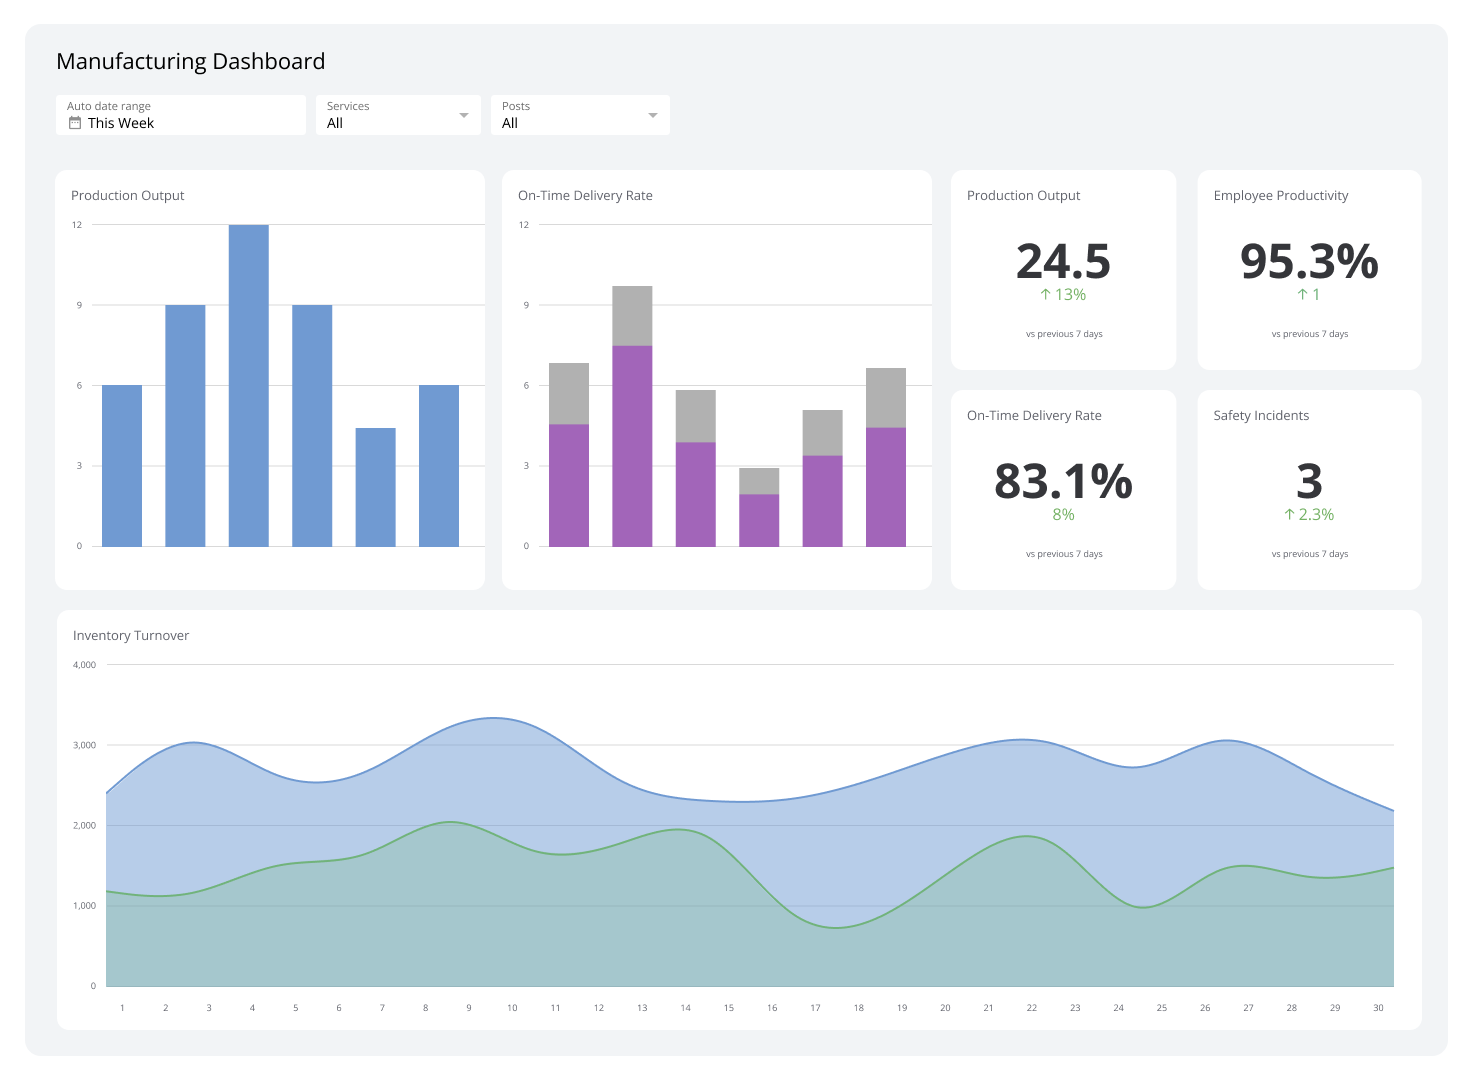
Manufacturing Dashboard
Track production, quality, and inventory with live manufacturing KPIs.
- Supply Chain
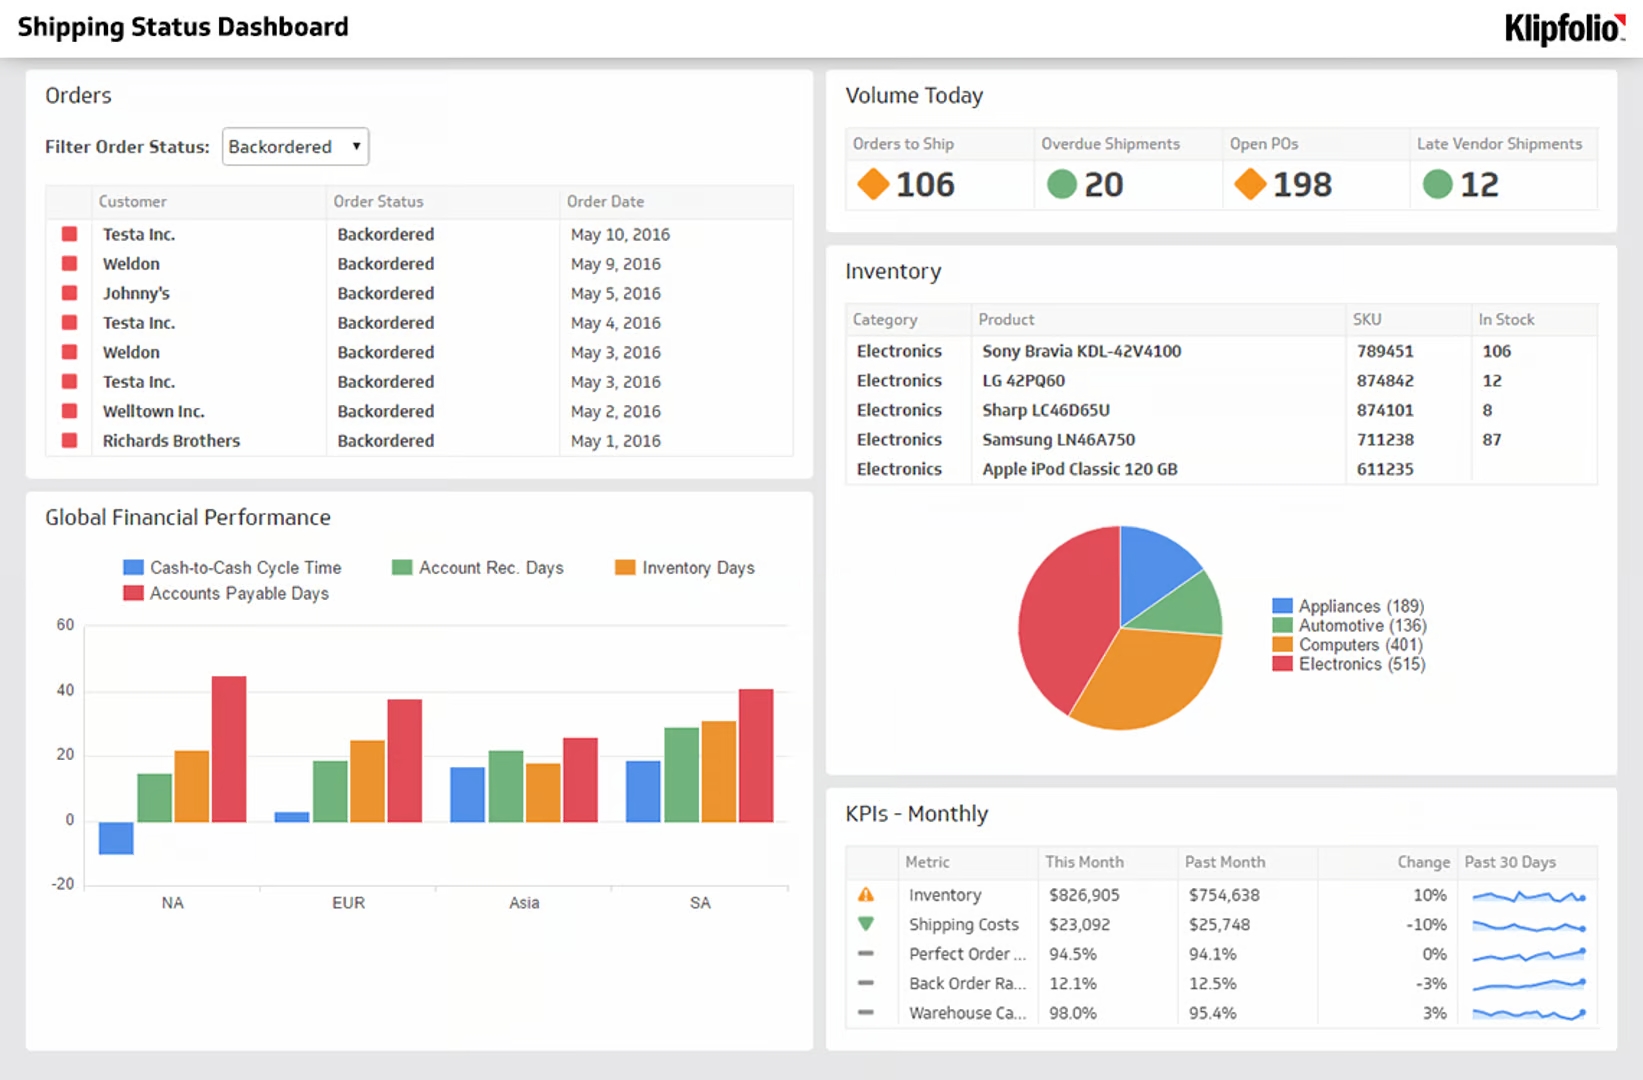
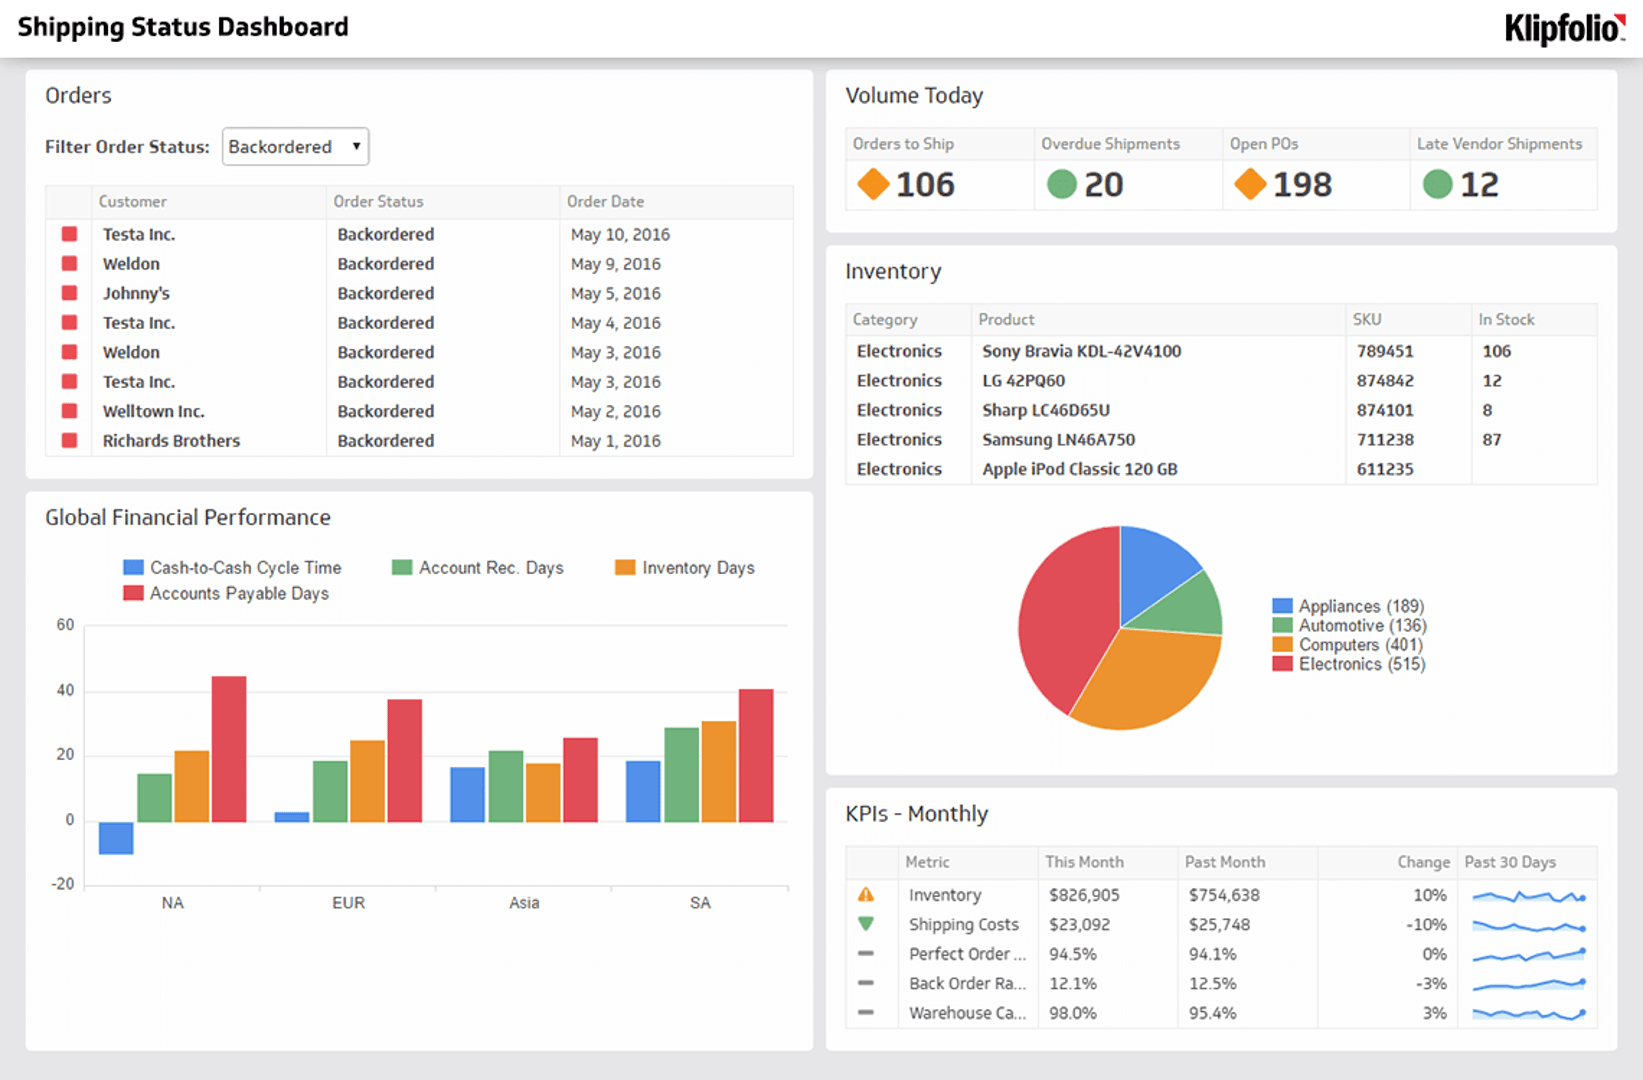
Shipping Status Dashboard
Gain end-to-end visibility of your supply chain operations.
- Supply Chain
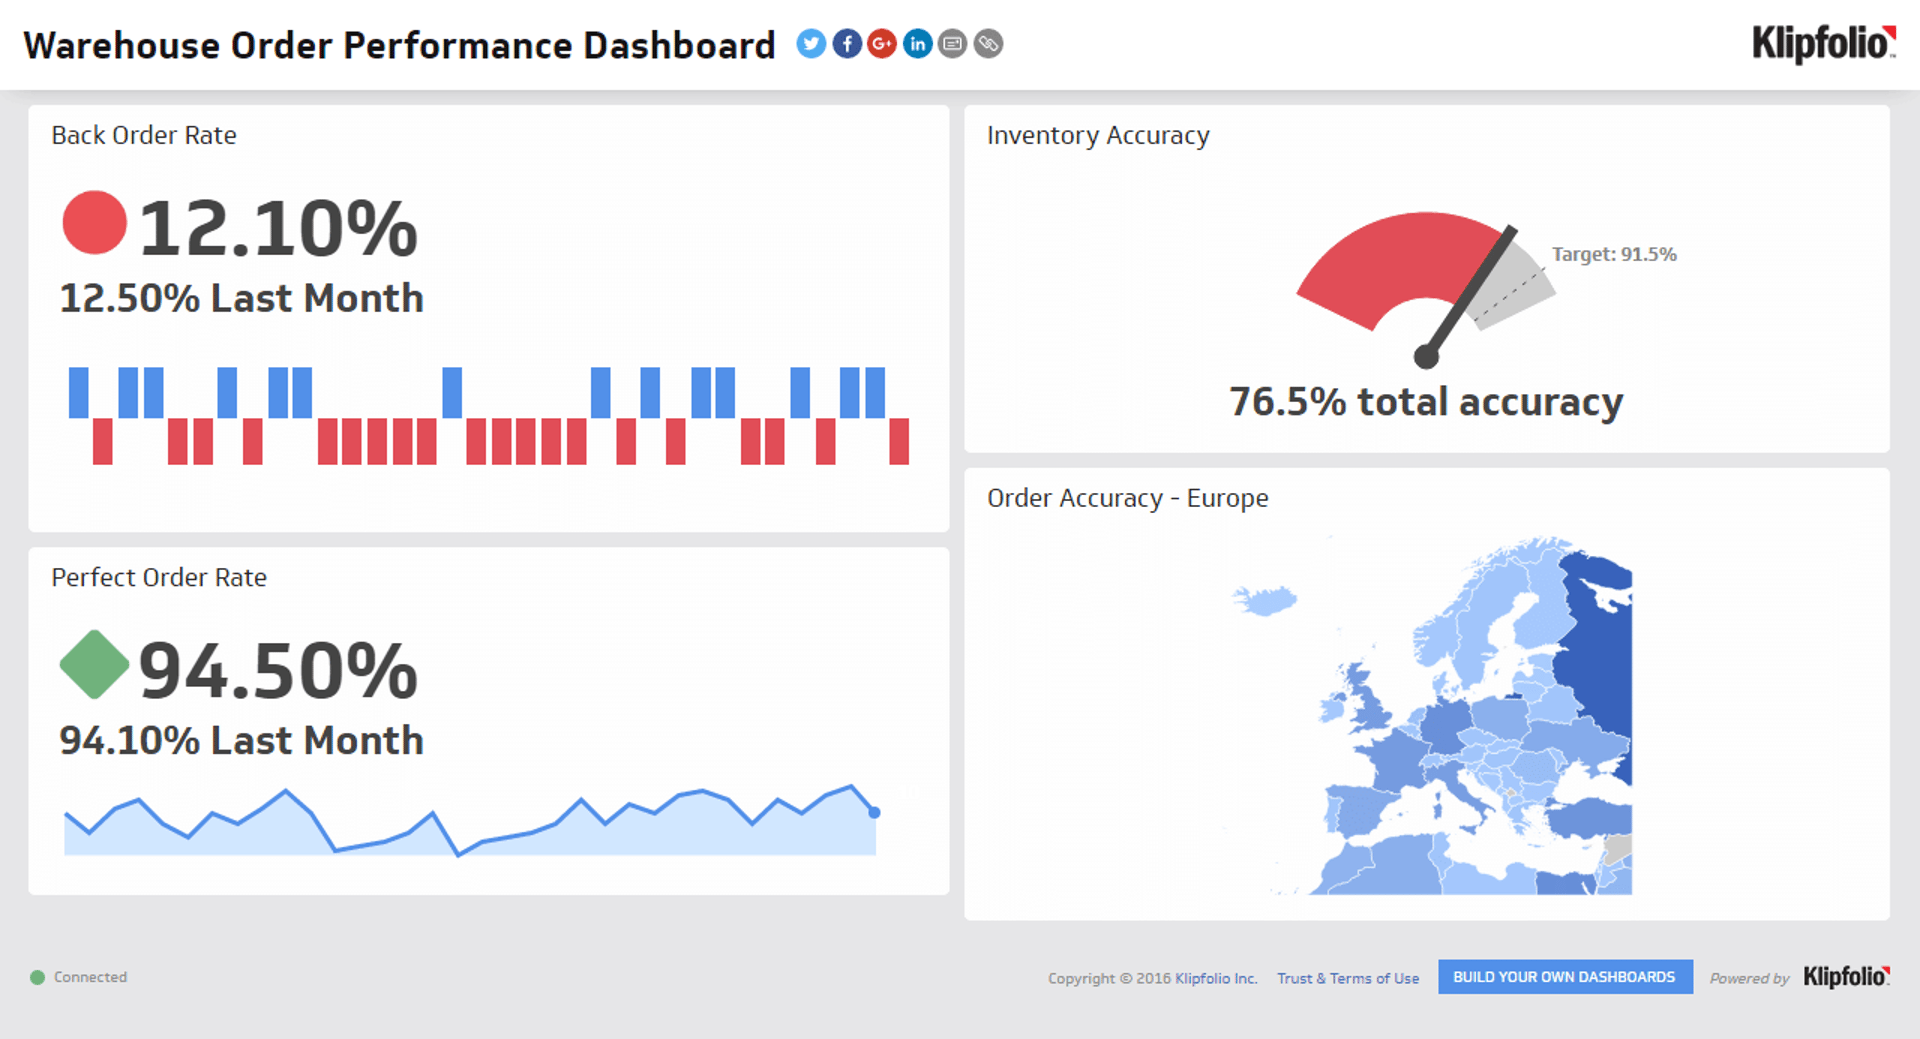
Warehouse Order Performance Dashboard
Streamline your shipping operations from inventory to delivery.
- Supply Chain
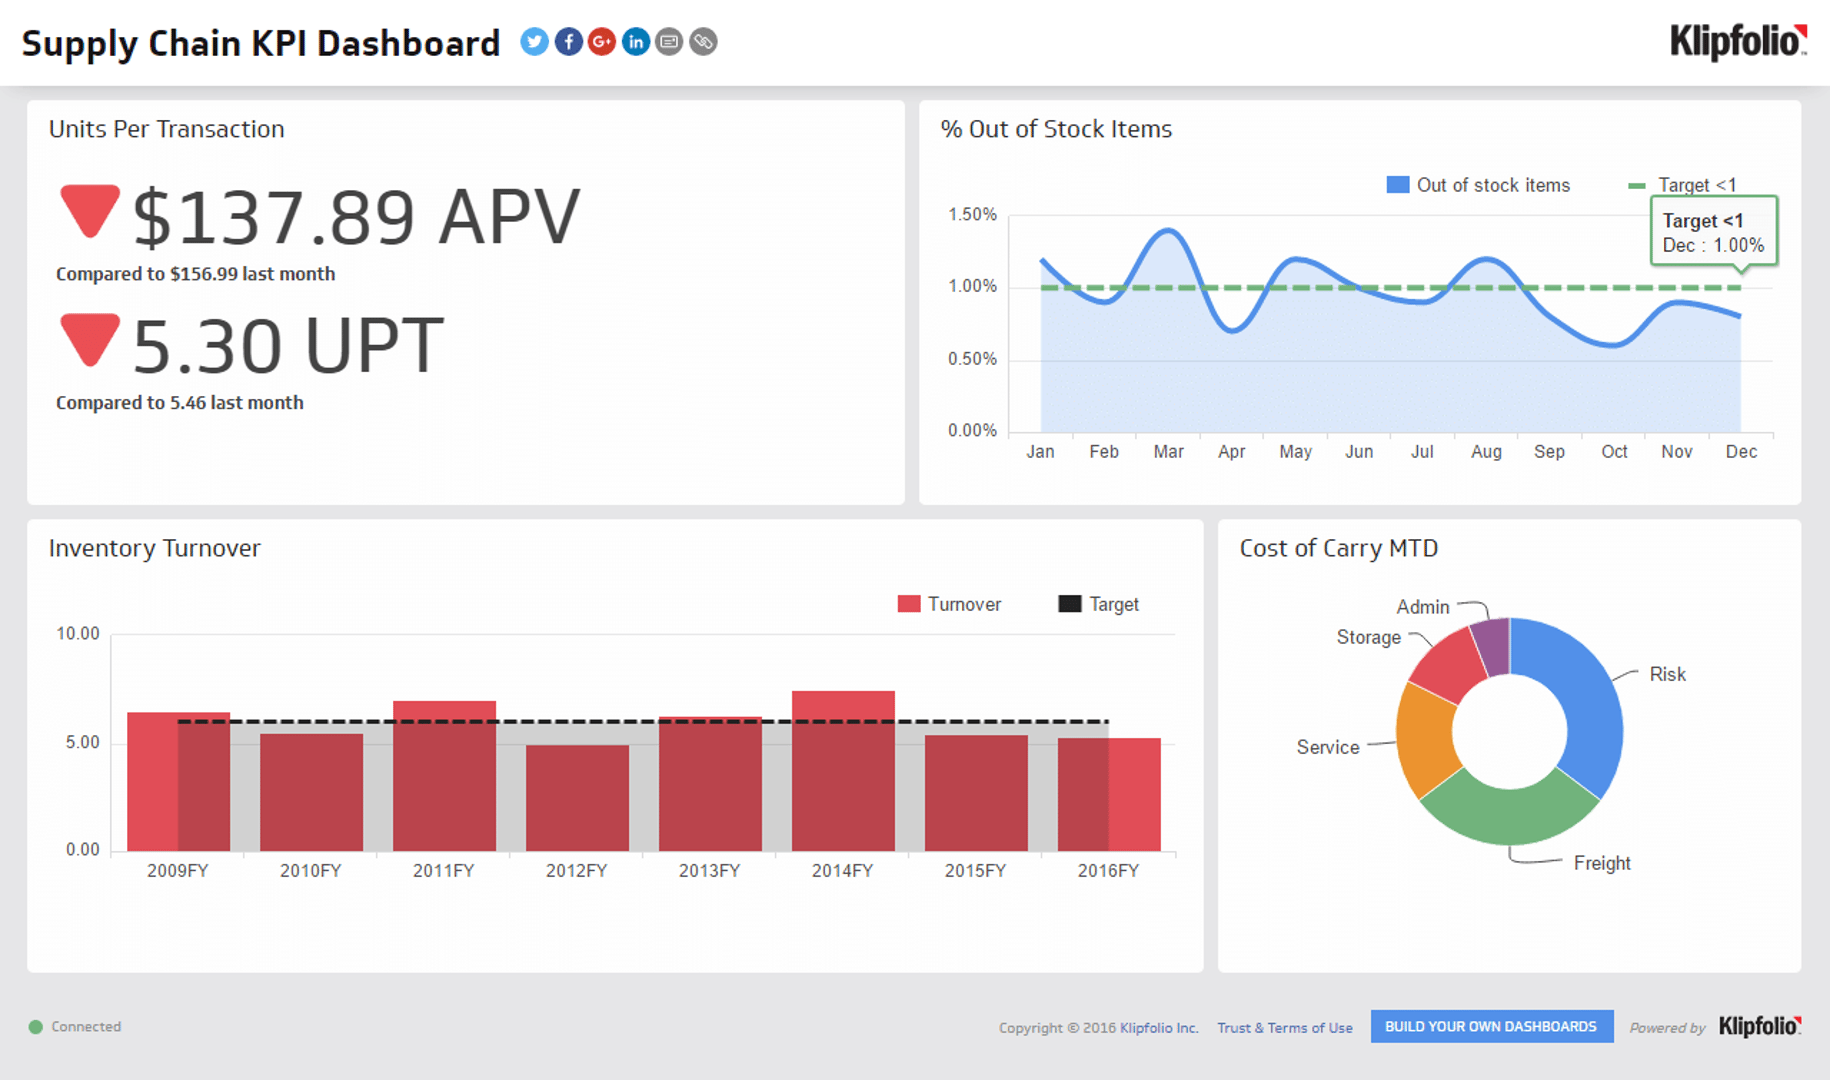
Supply Chain Dashboard
Track your operational health with essential supply chain KPIs.
Backorder Rate
The Backorder Rate measures orders that can't be fulfilled when placed, due to low inventory, shipping issues, or other supply chain failures. A high rate signals a forecasting problem. Reducing it usually means improving demand forecasting or implementing a more responsive planning system.
Backorder Rate = (Number of undeliverable orders / Total number of orders) x 100
Rate of Return
The Rate of Return measures how often customers send products back. A high return rate tells you something is wrong: product quality, inaccurate descriptions, or unmet expectations. When this number climbs, investigate whether the issue is the product itself or how it's being described and sold.
Rate of Return = Total items returned / Total items shipped
Accurately Documented Orders Rate
Accurate documentation underpins everything else. Without it, you can't trust your fulfillment data, customer service records, or perfect order rate. You can build a Perfect Order Index by multiplying accuracy rates across categories: on-time delivery, in-full delivery, damage-free delivery, and documentation accuracy, giving you a single number that reflects end-to-end order quality.
Accurately Documented Orders = [(Total orders – Orders without accurate documentation) / Total orders] x 100
Cash-to-Cash Cycle Time
Cash-to-Cash Cycle Time measures the gap between paying your suppliers and collecting payment from your customers. A negative cycle time means customers pay you before you pay suppliers: positive cash flow. A positive and growing cycle time is a warning sign worth addressing through renegotiated payment terms.
Cash-to-Cash Cycle Time = Receivable days + Inventory days – Payable days
Create custom dashboards for you and your team.
Get started with KlipsCustomer Order Cycle Time
Customer Order Cycle Time tracks the days between receiving a purchase order and completing delivery. Shorter cycle times mean a more responsive supply chain and a more satisfied customer. Because cycle time can vary significantly by industry, benchmark against competitors rather than abstract targets.
Customer Order Cycle Time = Actual delivery date – Purchase order creation date
Supply Chain Cycle Time
Supply Chain Cycle Time measures the total time from placing an order for raw materials to delivering the finished product to the customer. A longer cycle time often points to communication breakdowns between teams or supply chain partners. Reducing it typically requires process changes, not just speed.
Supply Chain Cycle Time = Shipment date – Order receipt date
Freight Bill Accuracy Rate
This metric tracks the percentage of freight bills that are error-free. Even small billing discrepancies compound over time and create administrative overhead that drains resources. The target is 100%: even a 99% rate warrants investigation, because that 1% represents real money and operational friction.
Freight Bill Accuracy Rate = (Number of correct freight bills / Total freight bills) x 100
Freight Cost Per Unit
Freight Cost Per Unit shows what it actually costs to ship each unit. Tracked over time, it surfaces patterns in your spending and flags when a shipping method stops being cost-effective. Break this down by shipping method to compare cost efficiency across carriers and routes: that comparison is usually where the savings are.
Freight Cost Per Unit = Overall freight cost / Number of units shipped
Gross Margin Return on Investment
Gross Margin Return on Investment (GMROI) measures how effectively your inventory converts into profit. A ratio above one means you're earning more than your inventory costs. Below one means you're not covering your investment.
Gross Margin Return on Investment = Gross Profit / Average inventory cost
Days Sales Outstanding
Days Sales Outstanding (DSO) measures the average number of days it takes to collect payment after a sale. A high DSO signals collection problems. A very low DSO may indicate overly rigid credit terms that limit revenue. A stable DSO around 45 days is generally considered healthy, though this varies by industry.
Days Sales Outstanding = (Accounts receivable / Credit Sales) x Days
Warehousing Costs
High warehousing costs compress your margins. This metric tells you whether your storage footprint is proportionate to your output. Total annual overheads include rental, utilities, insurance, and equipment. Compare your result against industry benchmarks to determine whether your costs are in range.
Warehousing Costs = Total annual overheads / Total number of products stored
Units per Transaction
Units per Transaction measures the average number of units sold in each customer transaction. A rising number suggests customers are buying more per visit. Benchmark against industry standards and track over time to see whether changes to pricing, bundling, or promotions are moving the needle.
Units per Transaction = Total units sold / Total number of transactions
Supply Chain Costs
Total Supply Chain Costs give you the denominator for your ROI calculation. Without knowing your full cost base, you can't accurately assess profitability or identify where to cut. If your per-product cost is high relative to competitors, that's where to start looking for inefficiencies.
Supply Chain Costs = ([your inventory carrying costs](https://www.klipfolio.com/kpis/supply-chain/cost-of-carry) + Total logistics costs + Total procurement costs) / Total number of products sold
Supply Chain Costs vs. Sales
This ratio compares what you spend running your supply chain to the revenue it generates. A ratio closer to zero means your supply chain is cost-efficient. A rising ratio means costs are growing faster than sales, and that gap needs attention.
Supply Chain Costs vs. Sales = Total Supply Chain Costs / Total Sales Amount
Cost of Quality
The Cost of Quality captures everything you spend to ensure your products meet quality standards: inspection, testing, equipment, rework, and related expenses. Tracking this over time helps you find where quality spending is concentrated and whether process improvements could reduce it without compromising standards.
Cost of Quality = Total expenses incurred for quality control / Total number of products produced
Turn-Earn Index
The Turn-Earn Index combines your Inventory Turnover Ratio and gross margin percentage into a single number. It balances inventory availability against the profit each product actually earns, which is useful when your product mix spans different price points and margins.
Turn-Earn Index = (Inventory Turnover Ratio x Gross profit percentage) x 100
Pick and Pack Cycle Time
Pick and Pack Cycle Time measures how long it takes to source and package an order for shipment. A long cycle time often points to warehouse layout issues, inefficient picking processes, or staffing gaps. Reducing it speeds up delivery and lowers labour costs.
Pick and Pack Cycle Time = Time of order completion – Start time for order fulfillment
Create custom dashboards for you and your team.
Get started with KlipsStart tracking what matters
Supply chain metrics show you where your operations are strong and where they're quietly costing you. Tracked consistently, they give you the confidence to make faster decisions with fewer errors and a clearer view of profitability across your entire operation. Explore KPI examples to see how other supply chain teams are tracking performance.