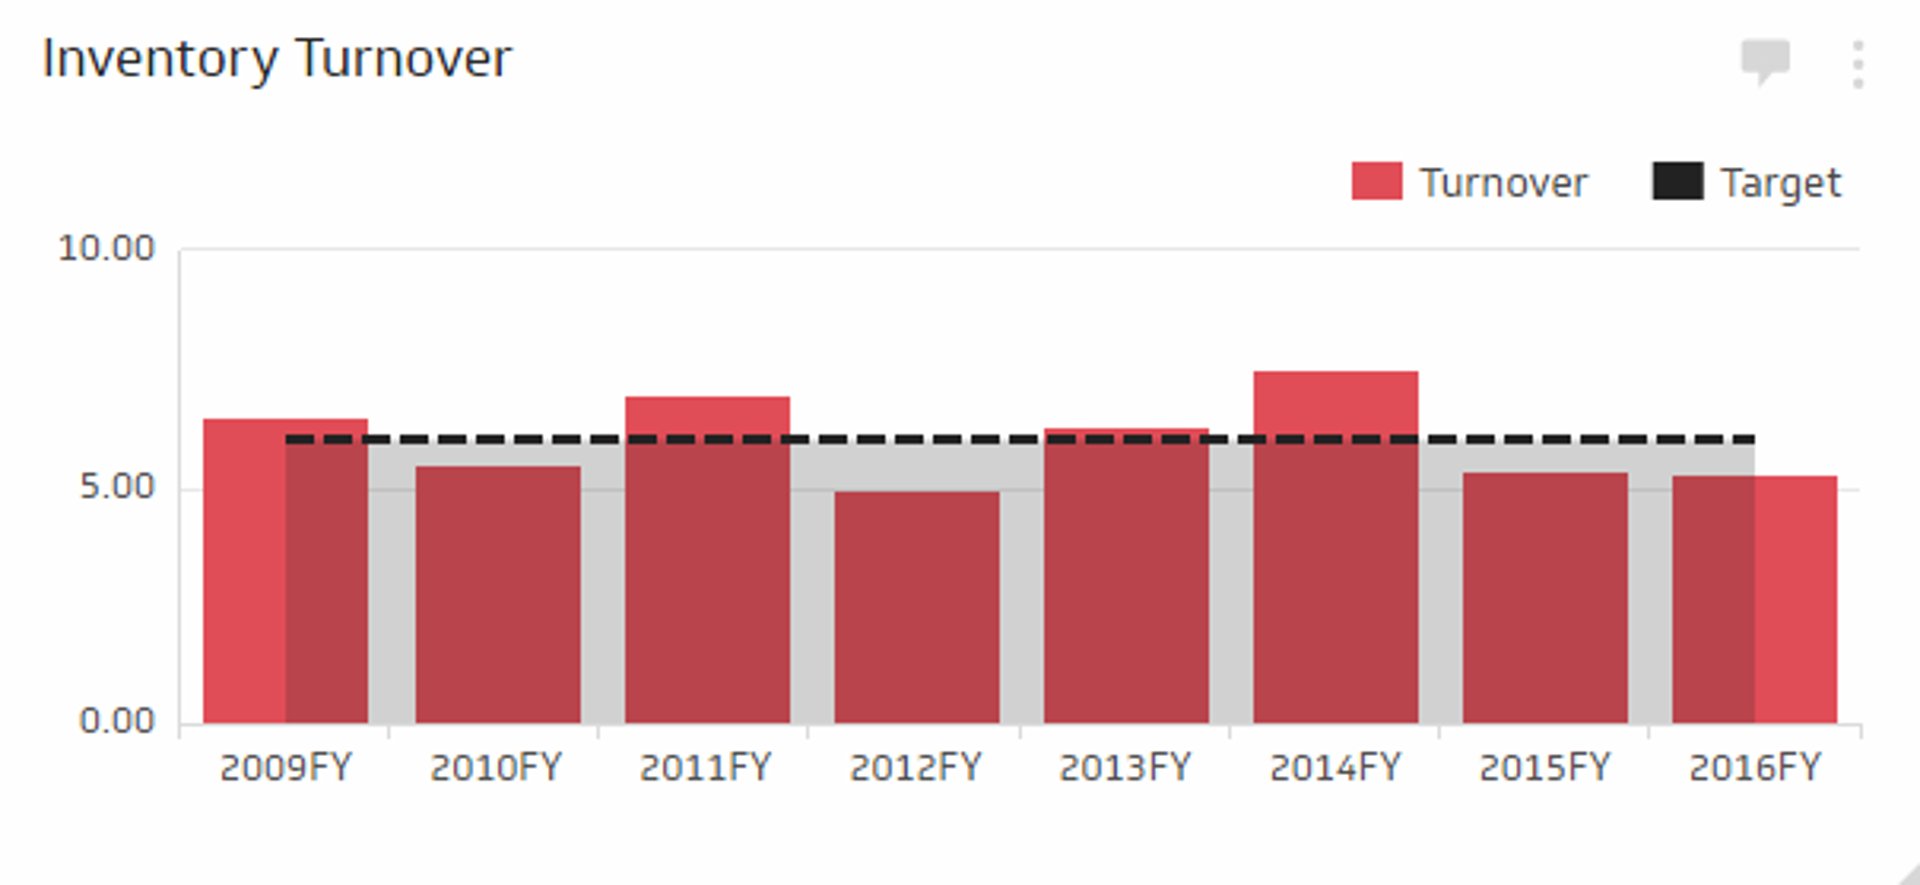
Inventory Turnover
Measure how many times a year your organization is able to sell your entire inventory.
Track all your Supply Chain KPIs in one place
Sign up for free and start making decisions for your business with confidence.
What is Inventory Turnover?
Inventory Turnover is a financial metric that measures the efficiency of your supply chain, the quality and demand of the inventory you carry, and if you have good buying practices. Generally speaking, a higher turnover rate is better, while a lower turnover rate suggests inefficiency and difficulty turning stock into revenue.
Each type of industry will have different benchmarks and norms. For instance, a fresh produce supplier will have many more turns than a textile/clothing supplier.
Inventory Turnover Formula
The formula for calculating inventory turnover is:
Inventory Turnover = Cost of Goods Sold (COGS) / Average Inventory
Where:
- Cost of Goods Sold (COGS) is the total cost of producing or purchasing the goods sold by a company during a specific period.
- Average Inventory is the average value of the inventory during the same period. You can calculate this by adding the inventory value at the beginning and end of the period, then dividing by 2.
Key Terms
- Turns: The number of times a year all inventory is sold
- Average days to turn inventory: The number of days it takes to sell all on-hand inventory. Use the following equation: 365 ÷ inventory turn
- Cash-to-Cash Cycle Time: The time between when a business pays its suppliers and when the business receives payment from its customers
Success Indicators
- A high inventory turn rate compared to industry norms.
Monitoring Supply Chain KPIs on a Dashboard
Once you have established benchmarks and targets for Inventory Turnover, you’ll want to establish processes for monitoring this and other supply chain KPIs. Dashboards can be critical in this regard. Read more
Related Metrics & KPIs