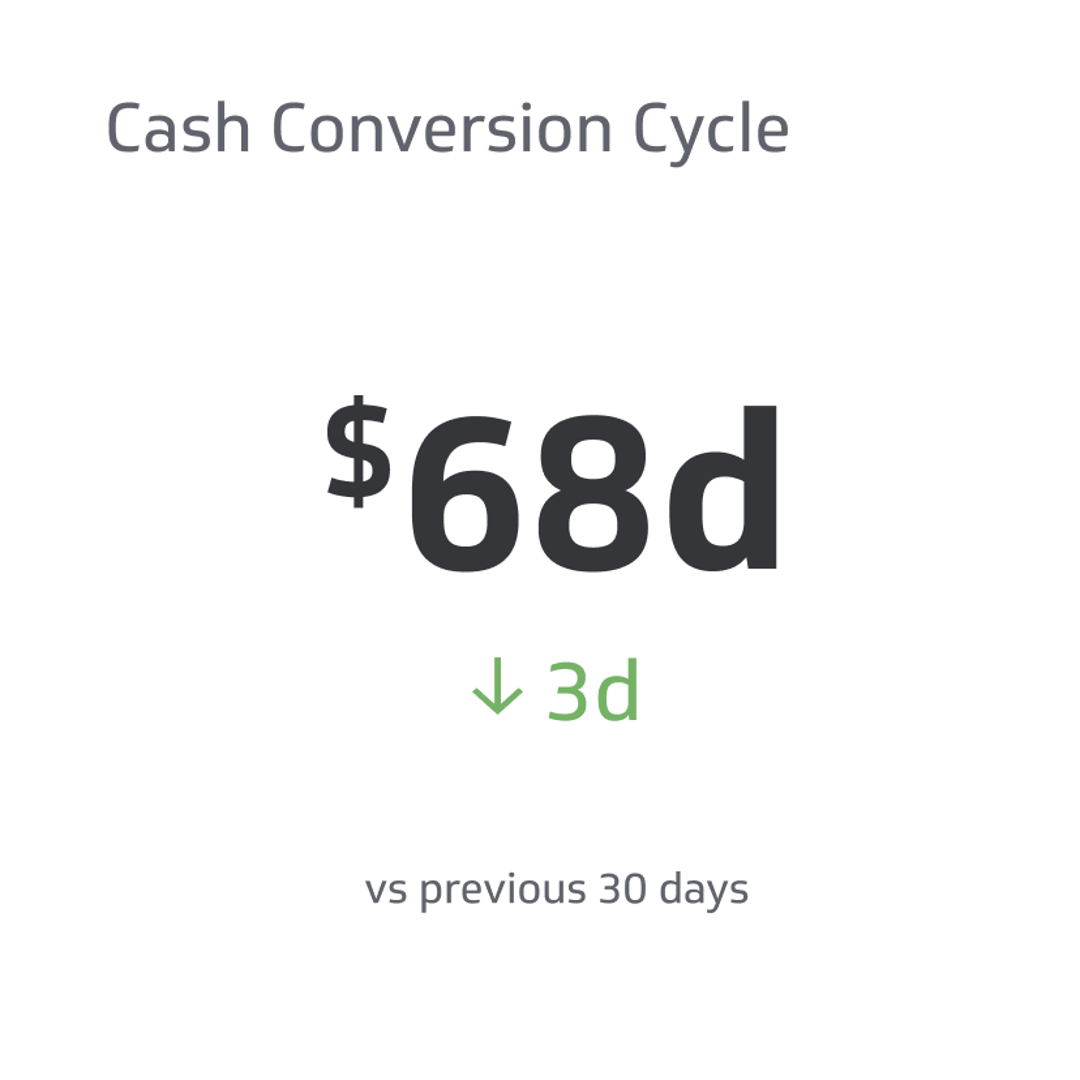
Cash Conversion Cycle (CCC)
The Cash Conversion Cycle (CCC) evaluates the efficiency of a company's working capital management.
Track all your Financial KPIs in one place
Sign up for free and start making decisions for your business with confidence.
In the fast-paced business world, efficient cash management is necessary for any company to succeed.
One key financial metric that can help you unlock your company's financial potential is the Cash Conversion Cycle (CCC). Measuring the time it takes to convert inventory into cash offers insights into liquidity and overall financial health.
In this blog, we will dive deep into what CCC is, how it's calculated, and why it should be on every business professional's radar.
Understanding The Cash Conversion Cycle (CCC)
There are a few factors to consider when discussing CCC’s significance in the business cycle, including the primary components and how to perform accurate calculations.
Definition Of CCC And Its Significance In Business
The Cash Conversion Cycle (CCC) evaluates the efficiency of a company's working capital management. It measures how long it takes for a business to transform its inventory into cash by considering three essential stages: selling current inventory, collecting payments from customers, and paying suppliers.
Understanding CCC provides business owners and professionals with insight into overall performance and how well the company manages its cash flow.
A shorter CCC typically indicates better operational efficiency, meaning the business can quickly convert inventory and accounts receivable investments into usable funds. Increased liquidity can contribute to more manageable debts and potential expansion opportunities.
On the other hand, a longer CCC may be a red flag that there are cash flow issues or inefficient business processes negatively impacting the bottom line.
Components Of CCC: Days Inventory Outstanding, Days Sales Outstanding, And Days Payable Outstanding
The Cash Conversion Cycle (CCC) includes three components that represent a company's efficiency in managing its inventory, receivables, and payables. These components are Days Inventory Outstanding (DIO), Days Sales Outstanding (DSO), and Days Payable Outstanding (DPO).
- Days Inventory Outstanding measures how long it takes for a company to sell its inventory. The fewer the days in this component, the more efficient the inventory management system is, leading to faster turnover rates.
- Days Sales Outstanding represents how many days lapse before a company receives payments from customers after making sales. Lower DSO implies faster payment collections from customers, translating to better cash flow management.
- Days Payable Outstanding denotes how long it generally takes for a firm to settle outstanding bills with suppliers or vendors after receiving invoices. High DPOs mean companies hold onto their cash longer before paying suppliers, which positively impacts cash flow.
Together, these three core elements provide an opportunity to analyze a company’s financial health. They can also provide data on inefficient points that a company can improve on for better cash flow management and working capital efficiency.
Calculation Of CCC
Calculating CCC may seem complex, but with our step-by-step guide, you'll be able to calculate it with ease and gain a better understanding of your business's financial health.
How To Calculate Days Inventory Outstanding
Calculating Days Inventory Outstanding (DIO) is a financial metric that reflects how long it takes for your company to turn its inventory into sales.
To calculate DIO, first determine two key figures: the average inventory level and the cost of goods sold (COGS). You can find these values in your company's balance sheet and income statement.
Once you have both numbers, divide the average inventory by COGS, and multiply by 365 to get an annualized figure. For example, if your average inventory is $10 million and COGS is $40 million for the year, then DIO would be ($10 million / $40 million) * 365 = 91.25 days.
This means it takes approximately 91 days for your company to sell its current stock.
How To Calculate Days Sales Outstanding
Days Sales Outstanding (DSO) measures how long a company takes to collect payment from its customers after making sales. To calculate DSO, divide the accounts receivable by the total credit sales during a given period and then multiply that figure by the number of days.
For example, if your accounts receivable are $100,000 at the end of January, and you had $500,000 in credit sales during that month, your January DSO would be 20 days (i.e., 100,000/500,000 x30).
A high DSO can indicate poor cash flow management or inefficient collection processes, so businesses aim for the lowest possible DSO while balancing reasonable payment terms to encourage more clients.
How To Calculate Days Payable Outstanding
Days Payable Outstanding (DPO) measures how long a company can pay its suppliers.
For example, if your accounts payable balance is $50,000, and your average daily COGS is $2,500, your DPO would be 20 days ($50,000 / $2,500).
A longer DPO can indicate that a company has better bargaining power with its suppliers or slower payment terms. However, it can signal potential cash flow problems if not managed efficiently.
By understanding and improving their DPO as part of their overall CCC strategy- companies can maintain balanced cash flow management while negotiating effectively with their vendors.
Step-by-step Guide To Calculating CCC
Now that you know how to find the DIO, DSO, and DPO, calculating the Cash Conversion Cycle (CCC) is fairly straightforward.
Calculate the Days Inventory Outstanding (DIO), Days Sales Outstanding (DSO), and Days Payable Outstanding (DPO) to get your base numbers.
Using these three metrics, plug them into this formula to determine the CCC:
DIO + DSO – DPO = CCC
Now you have your CCC, but now you probably have more questions. How do you use the numbers, and how do you know if your CCC is good? Learning how to analyze your DIO, DSO, DPO, and CCC is the next step toward optimizing your cash flow cycle.
Utilizing CCC For Business Analysis
CCC helps businesses assess their financial health and identify areas for improvement. These numbers serve as the foundation for strategy development and a benchmark against competitors within their industry.
Benchmarking CCC Among Different Companies
Using your Cash Conversion Cycle to see how you match up with competitors is one way to analyze your company’s financial health.
- Identify your competitors.
- Calculate each competitor’s CCC using the same formula as you did for your company.
- Compare your CCC to your competitors. Remember that a lower CCC translates to more efficient capital management, which translates to faster cash flow and higher profitability.
- Analyze the results to identify areas for improvement to reduce your CCC and bypass your competition.
Benchmarking your CCC against your competitors is an effective way to identify areas where your company can improve its financial performance. However, it is important to note that the CCC is only one financial metric and should be used in conjunction with other financial ratios and performance indicators.
Interpreting CCC Results
Interpreting CCC results depends on the industry standards and averages, but you generally want a lower CCC.
- CCC of less than 30 days is optimal as it indicates that the company quickly converts its investments in inventory and other resources into cash.
- CCC between 30 and 60 days is average and may indicate that there is room for improvement.
- CCC of more than 60 days suggests the company struggles with several areas and needs to improve working capital management to survive.
Remember that the Cash Conversion Cycle is a relative measure, with some industries naturally having higher CCCs than others due to various factors. For the best results, it’s best to monitor the CCC over time to monitor trends for the best insights.
Identifying Areas For Improvement
Companies have many options for making improvements based on their CCC numbers, though it might not always be clear at first glance. Some common areas for improvement include:
- Inventory management: Reducing inventory holding periods can effectively improve the CCC. Optimize production and supply chain processes, reduce lead times, and improve demand forecasting.
- Accounts receivable management is another driver of the CCC. Companies can make improvements by implementing more effective credit and collections policies, incentivizing early payments, and automating the billing and collections process.
- Accounts payable management can improve with optimized procurement processes and automated payments, but you may also try negotiating better payment terms with suppliers.
- Working capital financings options like factoring, invoice discounting, or supply chain finance can improve cash flow and reduce the CCC.
To identify specific areas for improvement, conduct a detailed analysis of all working capital management practices.
Conclusion
The Cash Conversion Cycle (CCC) helps any business monitor its cash flow and financial health, identify areas of improvement, and optimize its processes. By calculating CCC regularly, businesses can gauge their efficiency in converting inventory into cash and use it as a benchmark against industry averages or competitors.
Remember, a lower CCC indicates better cash flow management and potential for future growth opportunities.
Related Metrics & KPIs