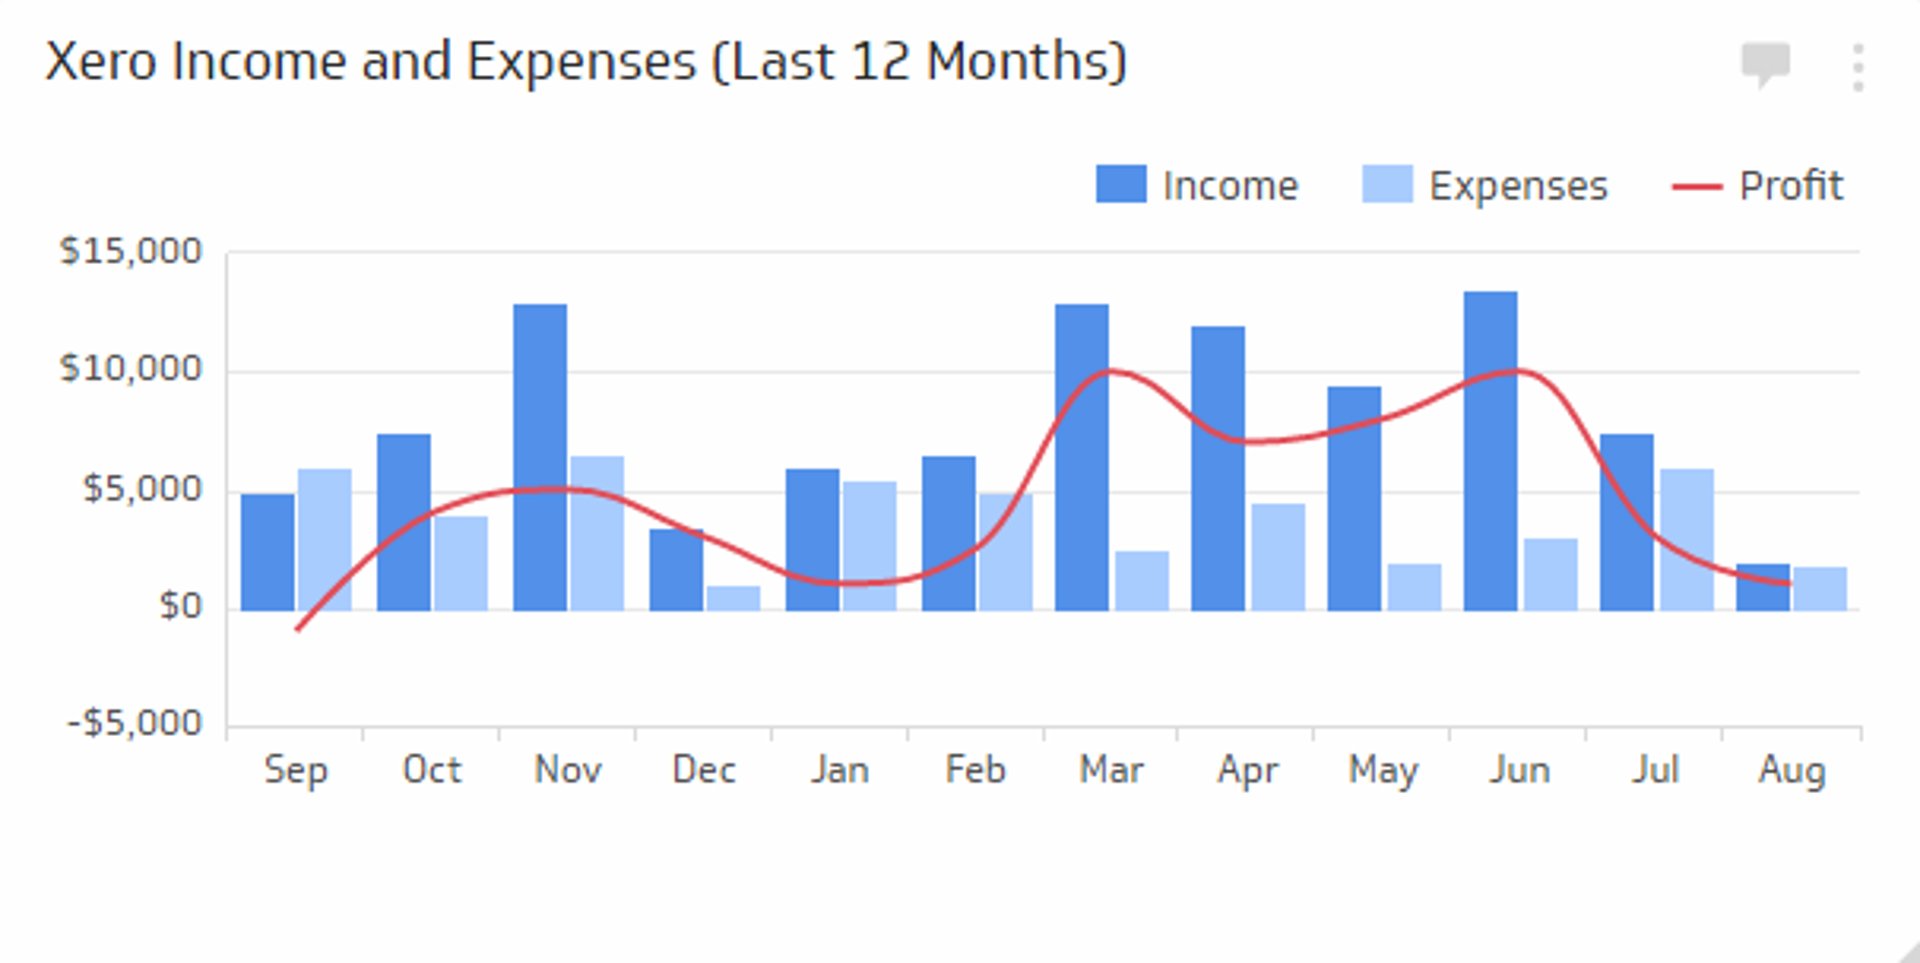
Income and Expenses (Last 12 Months) Metric
Track your income, expenses and profit over the past 12 months
Track all your Financial KPIs in one place
Sign up for free and start making decisions for your business with confidence.
Overview
The Income and Expenses metric displays the amount of money earned and spent by a business over a 12 month period. This key accounting metric can help business owners, bookkeepers, and accountants track the monthly earnings and spend of a business. The income and expense metric will also help determine whether or not a company's profit is consistent month over month.
Key terms
- Income: The amount of money received by the business
- Expense: The cost required for running the business
- Profit: The amount of money the business makes after deducted expenses from income
Success indicators
- Having more income than expenses, meaning a profit for the business
- Keeping expenses lower than overall income
Monitoring Financial KPIs on a Dashboard
Once you have established benchmarks and targets for your Income and Expenses, you’ll want to establish processes for monitoring this and other Financial KPIs. Dashboards can be critical in this regard. Read more
Why this KPI matters
A rolling 12-month view smooths seasonality and shows if costs are rising faster than revenue. It helps you decide where to invest, where to trim, and whether plans remain on track.
How to build the 12-month view
- Connect accounting. Bring in the general ledger or P&L export from your system.
- Map the chart of accounts. Group revenue, cost of goods sold, and operating expense lines.
- Compute trailing 12 months. Sum the last 12 months for each line, rolling forward each period.
- Compare to plan. Add budget or forecast to show gaps.
Data you need
- Monthly revenue and expense totals
- Budget or forecast by month
- Headcount and vendor counts for context
Improve performance
- Protect gross margin. Reduce delivery costs and improve pricing discipline.
- Stage hiring. Tie headcount growth to milestones.
- Trim unused software. Remove seats and renegotiate terms.
Track in Klips
- Create visuals. Add a stacked area chart for income vs expenses, a line for net profit, and a bar for variance to plan.
- Add thresholds. Colour rules highlight months where expenses outpace income.
- Share. Email a month-end snapshot to finance and leadership.
Common pitfalls
- Mixing cash and accrual. Pick one basis and label it.
- Ignoring one-time items. Call out large legal or financing costs.
- Over-aggregating. Keep a drill-through to account detail.
Related metrics
- Runway
- Gross margin
- Operating expense ratio
Track this KPI in Klips. Build a finance dashboard that updates automatically and keeps everyone aligned.
Related Metrics & KPIs