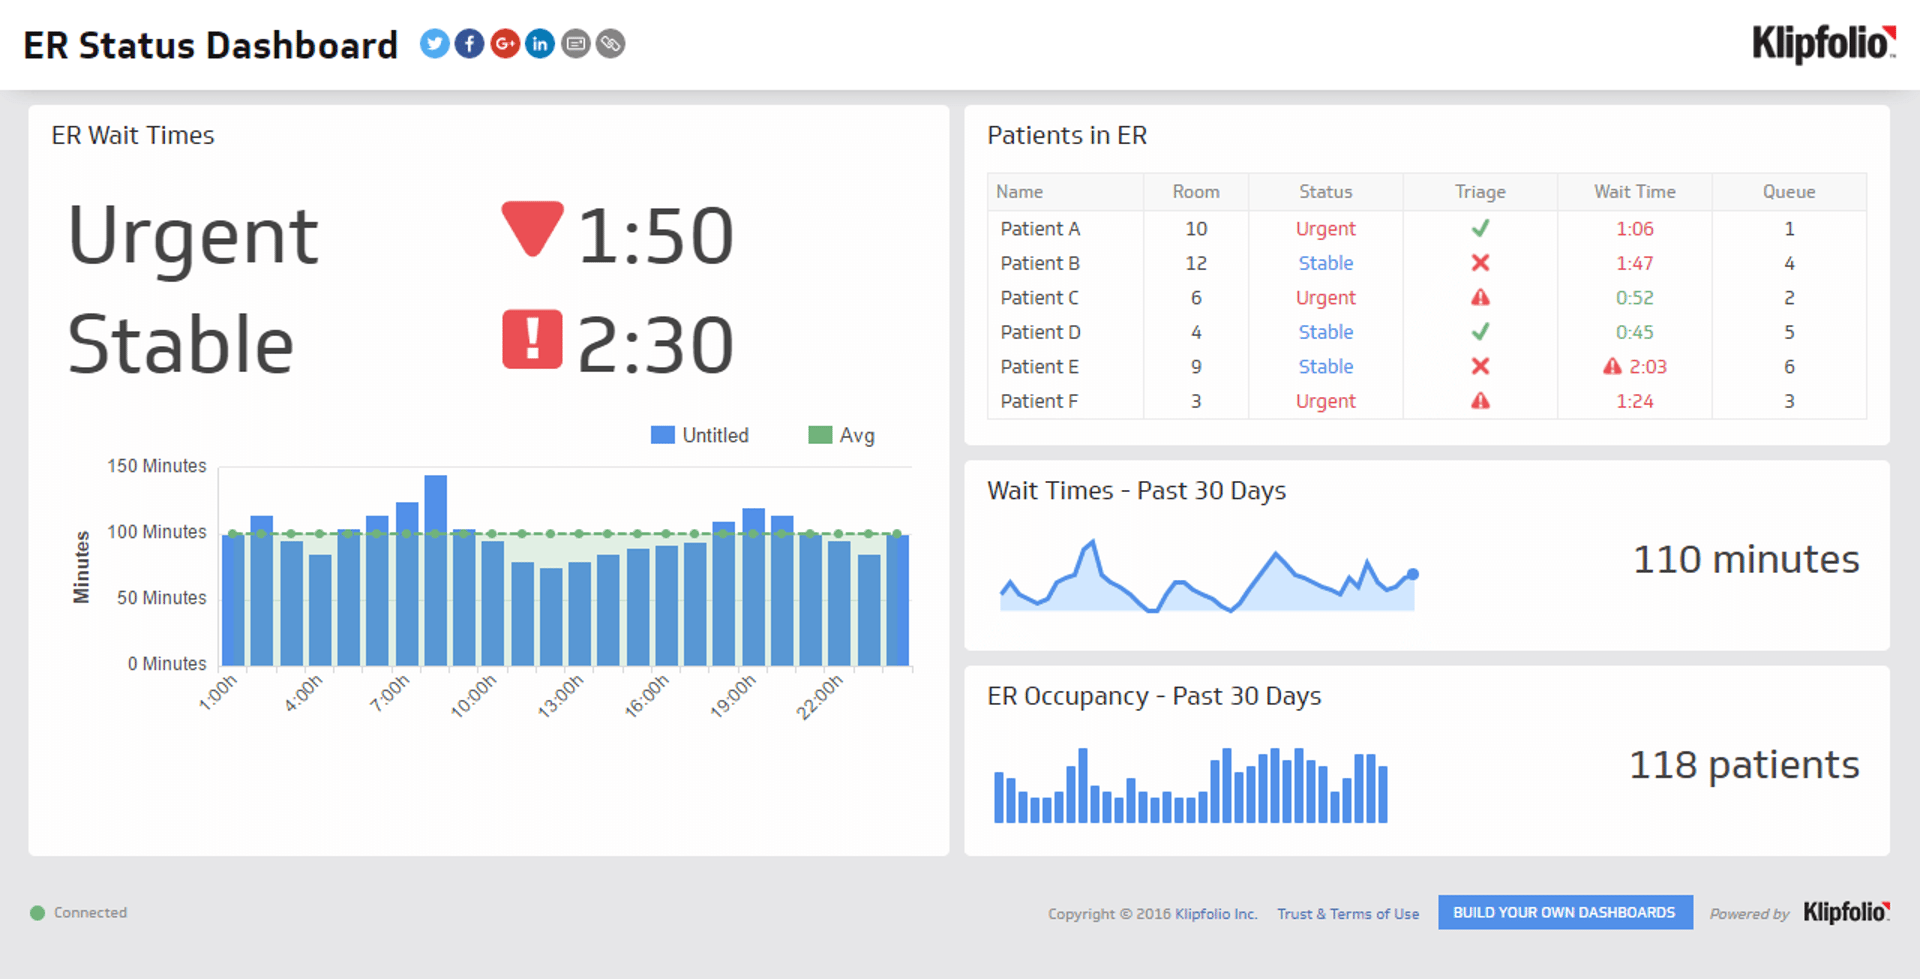
ER Status Dashboard
Track key emergency room metrics to improve patient flow and resource management.
What is an ER status dashboard?
An ER status dashboard is a real-time reporting tool that displays key emergency room metrics, giving hospital teams a single, accurate view of patient flow and capacity.
An emergency room operates under constant pressure. Manual tracking and fragmented reports create blind spots that slow decisions and put patients at risk. A real-time ER status dashboard cuts through the noise, providing a single source of truth for your entire team.
By monitoring key metrics like patient wait times and room occupancy, hospital staff can respond to challenges before they escalate, allocate resources where they're needed most, and deliver the quality of care that defines your organization's reputation.
Key metrics for an ER status dashboard
An effective ER dashboard focuses on a handful of critical metrics that give an at-a-glance view of operational performance. Here are the most important KPIs to track:
- ER Waiting Times: Track the average time a patient waits from check-in to being seen by a healthcare professional. This metric is a direct indicator of efficiency and patient satisfaction.
- Number of Patients in ER: Monitor the total volume of patients currently in the emergency room to understand demand and identify potential bottlenecks.
- Current ER Occupancy: See the percentage of beds or treatment spaces currently in use to manage capacity and patient flow effectively.
Tracking these three metrics together gives your team a complete picture of real-time ER status, so no one is making decisions based on incomplete or stale information.
Who uses an ER status dashboard?
A well-designed dashboard serves multiple roles within the hospital, delivering the right insights to the people who need them most.
- Hospital administrators use the dashboard to get a high-level overview of ER performance, identify long-term trends, and make strategic decisions about staffing and resource allocation.
- ER charge nurses and department heads monitor the dashboard in real-time to manage patient flow and capacity, assign staff to areas of high demand, and address operational issues before they escalate.
- Triage staff can view wait times and occupancy to give patients more accurate information upon arrival, helping to manage expectations and reduce frustration.
When everyone from the front desk to senior leadership is working from the same data, your team can act decisively instead of reacting to problems after the fact.
Why move away from manual tracking?
Spreadsheets and paper-based systems introduce delays, errors, and gaps in visibility that a busy ER cannot afford. An automated, real-time dashboard eliminates those risks by pulling data directly from your systems and presenting it in a clear, consistent format.
The shift from manual reporting to live dashboards also improves accountability. When key metrics are visible to the whole team, performance gaps are easier to spot and address. Over time, that visibility builds a culture of continuous improvement.
Build your ER status dashboard with Klipfolio Klips
With Klipfolio Klips, you can connect to your existing data sources, build a custom view of your ER's performance, and share it securely with every stakeholder who depends on it. Klips supports 100+ data connectors, Excel-like formulas for custom calculations, and flexible distribution options including TV mode for wall-mounted displays, making it a practical fit for busy healthcare environments.
Start with the metrics that matter most, then expand your dashboard as your team's needs grow.
Try Klips free, no credit card required.
At a glance
Focus Area
Emergency room operational performance, patient flow, and capacity management.
Metrics List
ER Waiting Times, Number of Patients in ER, Current ER Occupancy.
Reference Rate
Real-time to hourly refresh recommended for active ER monitoring.
Related Dashboards
View all dashboards