ER Waiting Times Metric
Measures the amount of time patients wait before seeing a physician in your emergency department.
Track all your Healthcare KPIs in one place
Sign up for free and start making decisions for your business with confidence.
Overview
ER Wait Times measures the amount of time patients wait before seeing a physician in your emergency department. This metric matters because it directly reflects your hospital's operational efficiency and ability to deliver quality patient care. Long wait times frustrate patients, strain staff, and can delay critical treatment.
ER Waiting Times typically tracks two views:
- Real-time monitoring — Current wait times at any moment, displayed on department dashboards or public screens.
- Trend analysis — Wait times tracked over days, weeks, months, or years to identify patterns and improvement opportunities.
Why ER Waiting Times Matter
Patients and families scrutinize ER wait times when choosing hospitals. Public reporting of these metrics influences reputation, patient satisfaction scores, and even regulatory compliance. Beyond perception, excessive waits signal underlying capacity, staffing, or workflow problems that demand immediate attention.
Hospital leaders use this KPI to:
- Detect bottlenecks — Identify peak hours, understaffed shifts, or workflow delays.
- Benchmark performance — Compare your ER against regional and national standards.
- Plan resources — Adjust staffing, equipment, and bed allocation based on demand patterns.
- Improve outcomes — Reduce treatment delays and enhance patient safety.
How to Calculate ER Waiting Times
ER Waiting Times is straightforward to measure:
ER Waiting Time = Time Patient Checked In - Time Patient Seen by Physician
Example
A patient arrives at 2:15 PM and sees a physician at 2:47 PM. The wait time is 32 minutes.
Key Considerations
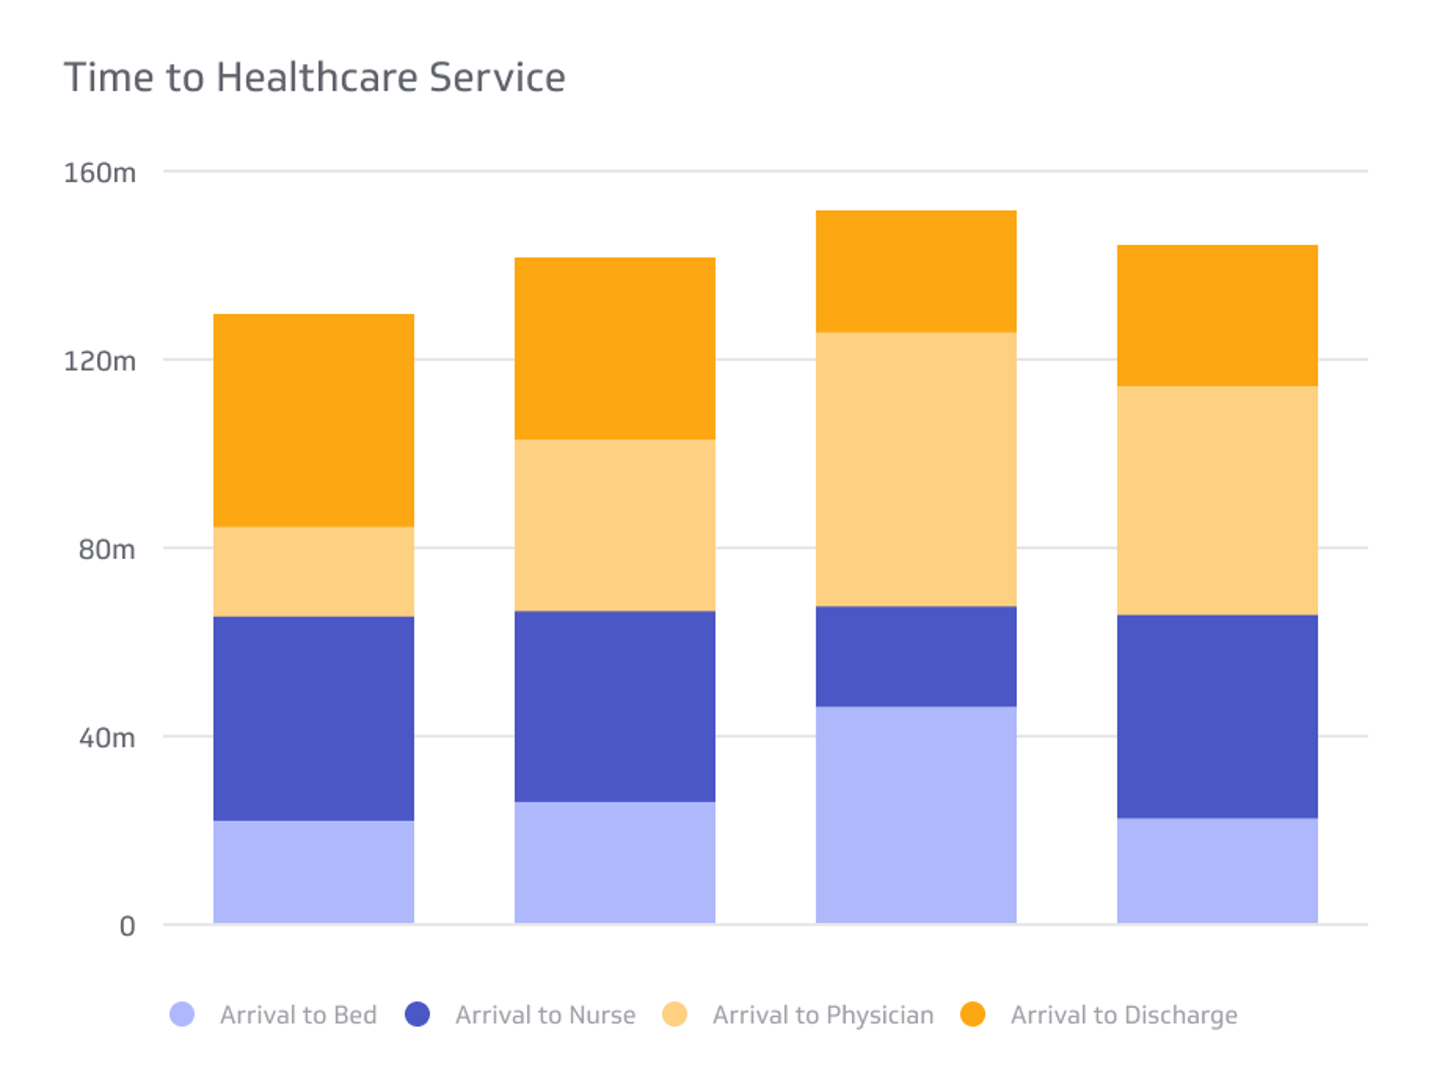
- Start point — Most hospitals measure from patient arrival (check-in) to first physician assessment.
- Granularity — Track wait times by hour, shift, day of week, and season to spot trends.
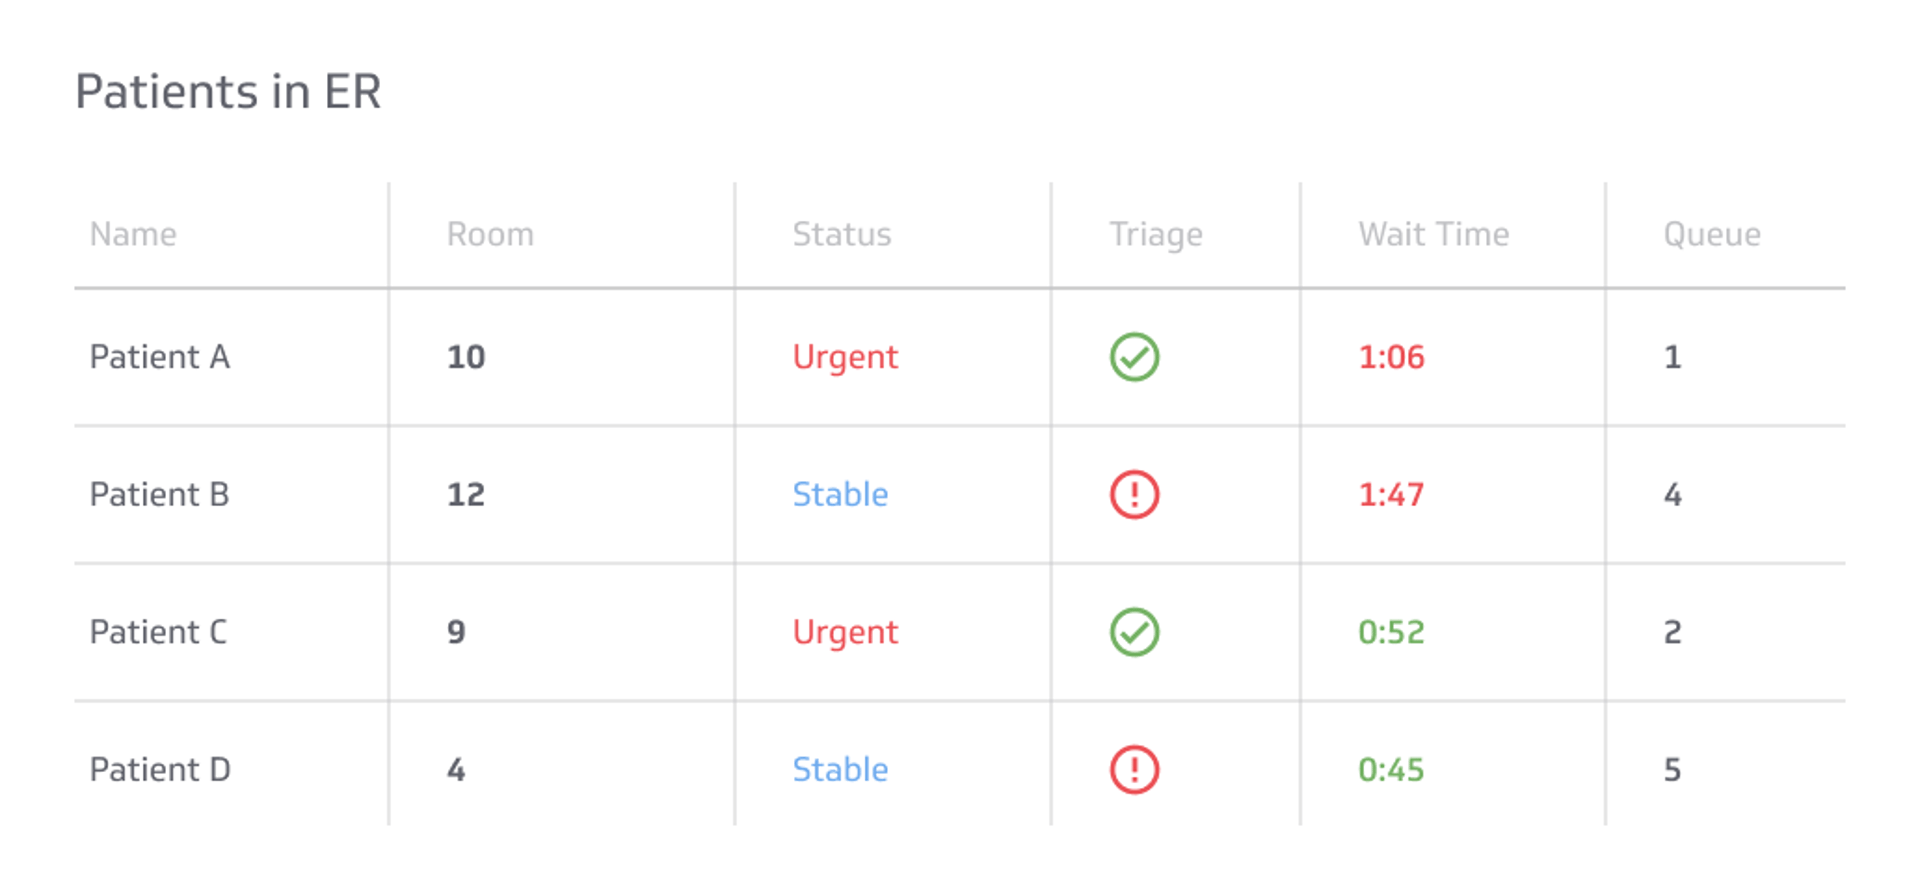
- Triage impact — Some patients require immediate attention (critical cases). Separate urgent cases from routine visits for a clearer picture.
- Data source — Extract wait times from your electronic health record (EHR) or emergency department information system (EDIS).
Benchmarks and Targets
Typical ER wait time benchmarks vary by hospital size and acuity:
- Target — Most hospitals aim for patients to see a physician within 30–60 minutes of arrival.
- National average — The median ER wait time in North America is 40–50 minutes.
- Peak vs. off-peak — Expect longer waits during evenings, weekends, and flu season.
Set realistic targets based on your facility's capacity, patient volume, and case complexity. Regular monitoring helps you adjust targets as your operations evolve.
Common Challenges
High variability — ER demand fluctuates unpredictably. Flu outbreaks, accidents, and weather can spike arrivals.
Staffing constraints — Physician shortages or call-outs directly extend wait times.
Bed availability — Patients waiting for admission to inpatient units can block ER beds and slow throughput.
Triage complexity — Distinguishing urgent from routine cases affects prioritization and wait time perception.
Monitoring ER Waiting Times on a Dashboard
Once you've established benchmarks and targets for ER Waiting Times, create processes to monitor this metric and related KPIs in real time. Dashboards are essential for this work.
A well-designed ER dashboard displays:
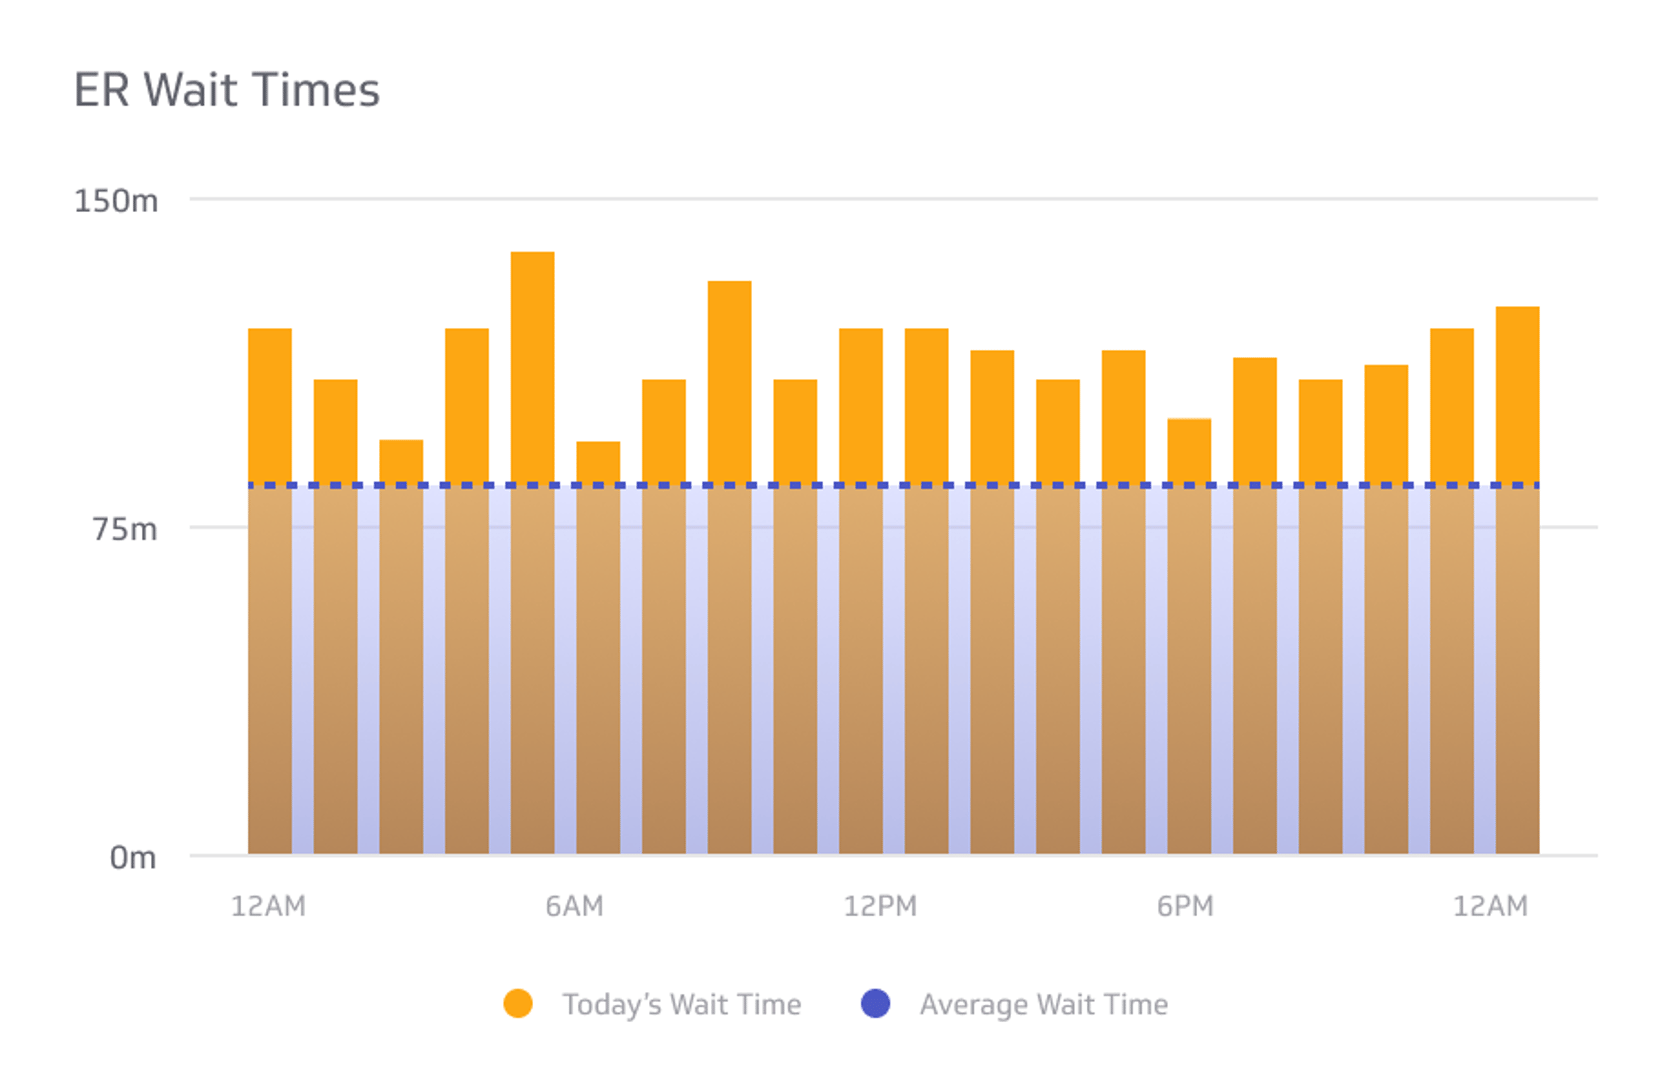
- Current wait time — Updated every few minutes.
- Wait time trends — Line charts showing performance over the past 24 hours, week, or month.
- Peak hours — Heatmaps or bar charts identifying busy periods.
- Comparison metrics — Admission rate, bed occupancy, and physician availability alongside wait times.
- Alerts — Notifications when wait times exceed your target threshold.
Klipfolio's dashboard software lets you pull real-time data from your EHR or EDIS, visualize trends instantly, and share dashboards with staff and leadership. Explore healthcare dashboard examples to see how hospitals track ER performance.
Related KPIs
To gain deeper insight into ER operations, track these related metrics alongside ER Waiting Times:
- Admission rate — Percentage of ER patients admitted to inpatient beds.
- Left without being seen (LWBS) — Patients who leave before receiving care, often due to long waits.
- Patient satisfaction score — How patients rate their ER experience.
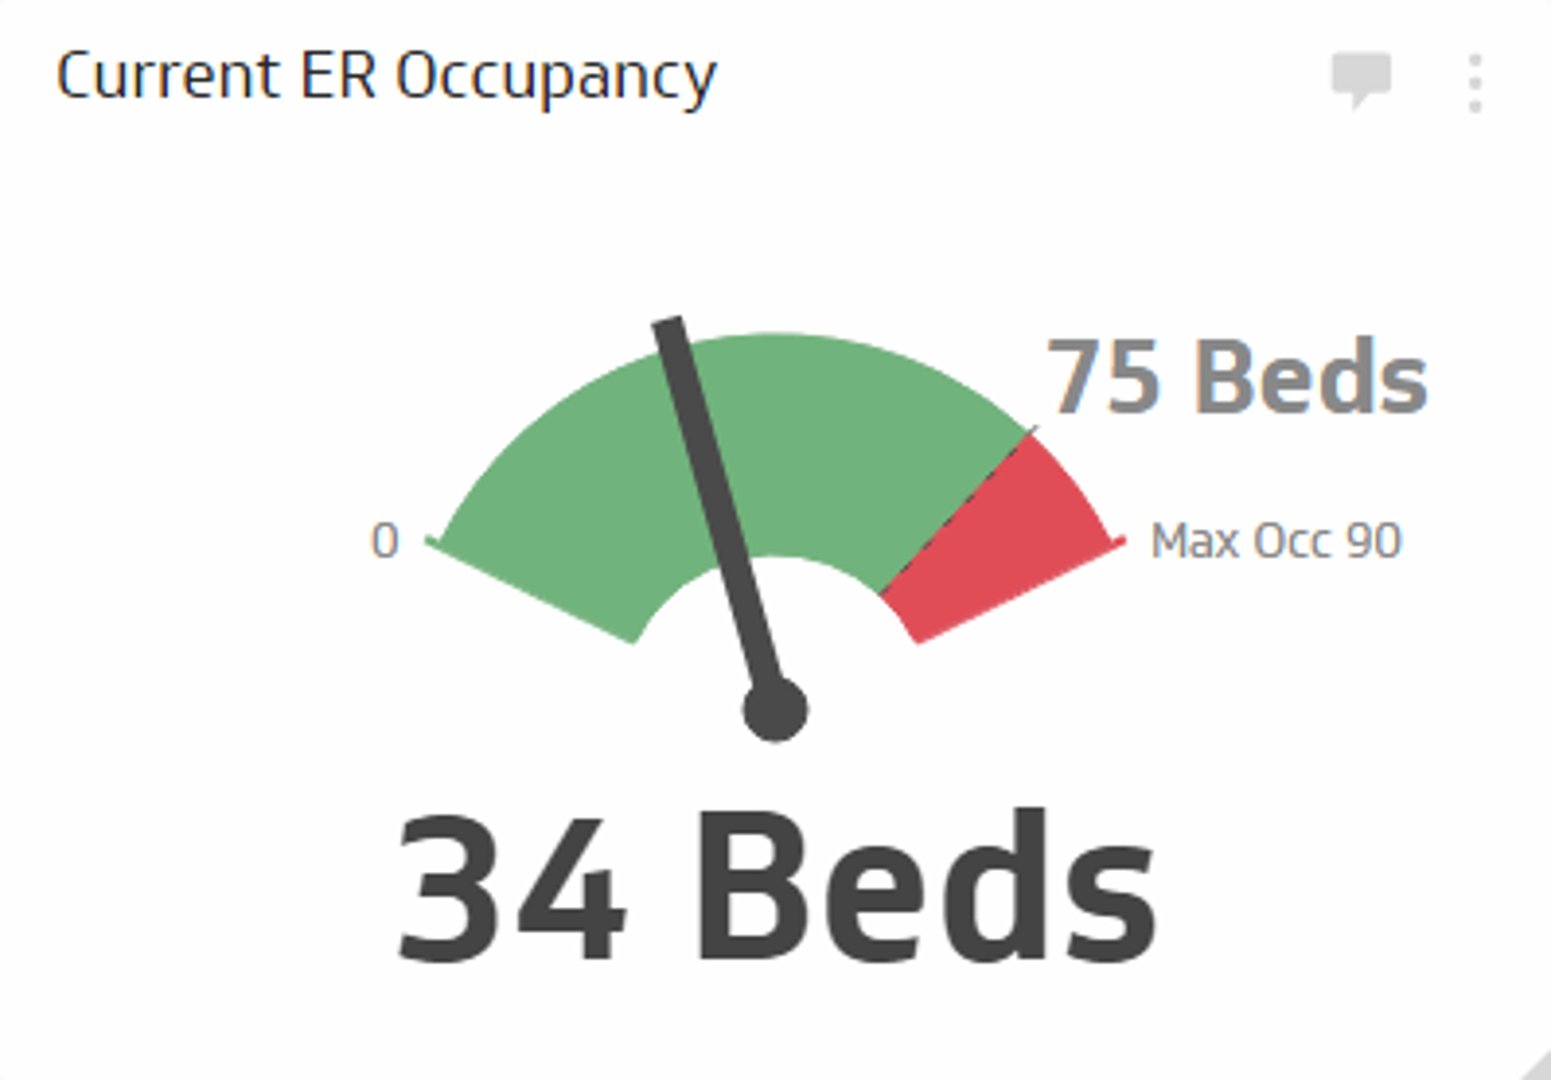
- Bed occupancy rate — Percentage of ER beds in use at any time.
- Physician utilization — Hours worked vs. hours available for patient care.
Together, these metrics reveal whether wait time delays stem from staffing, bed availability, workflow inefficiency, or patient volume.
Related Metrics & KPIs