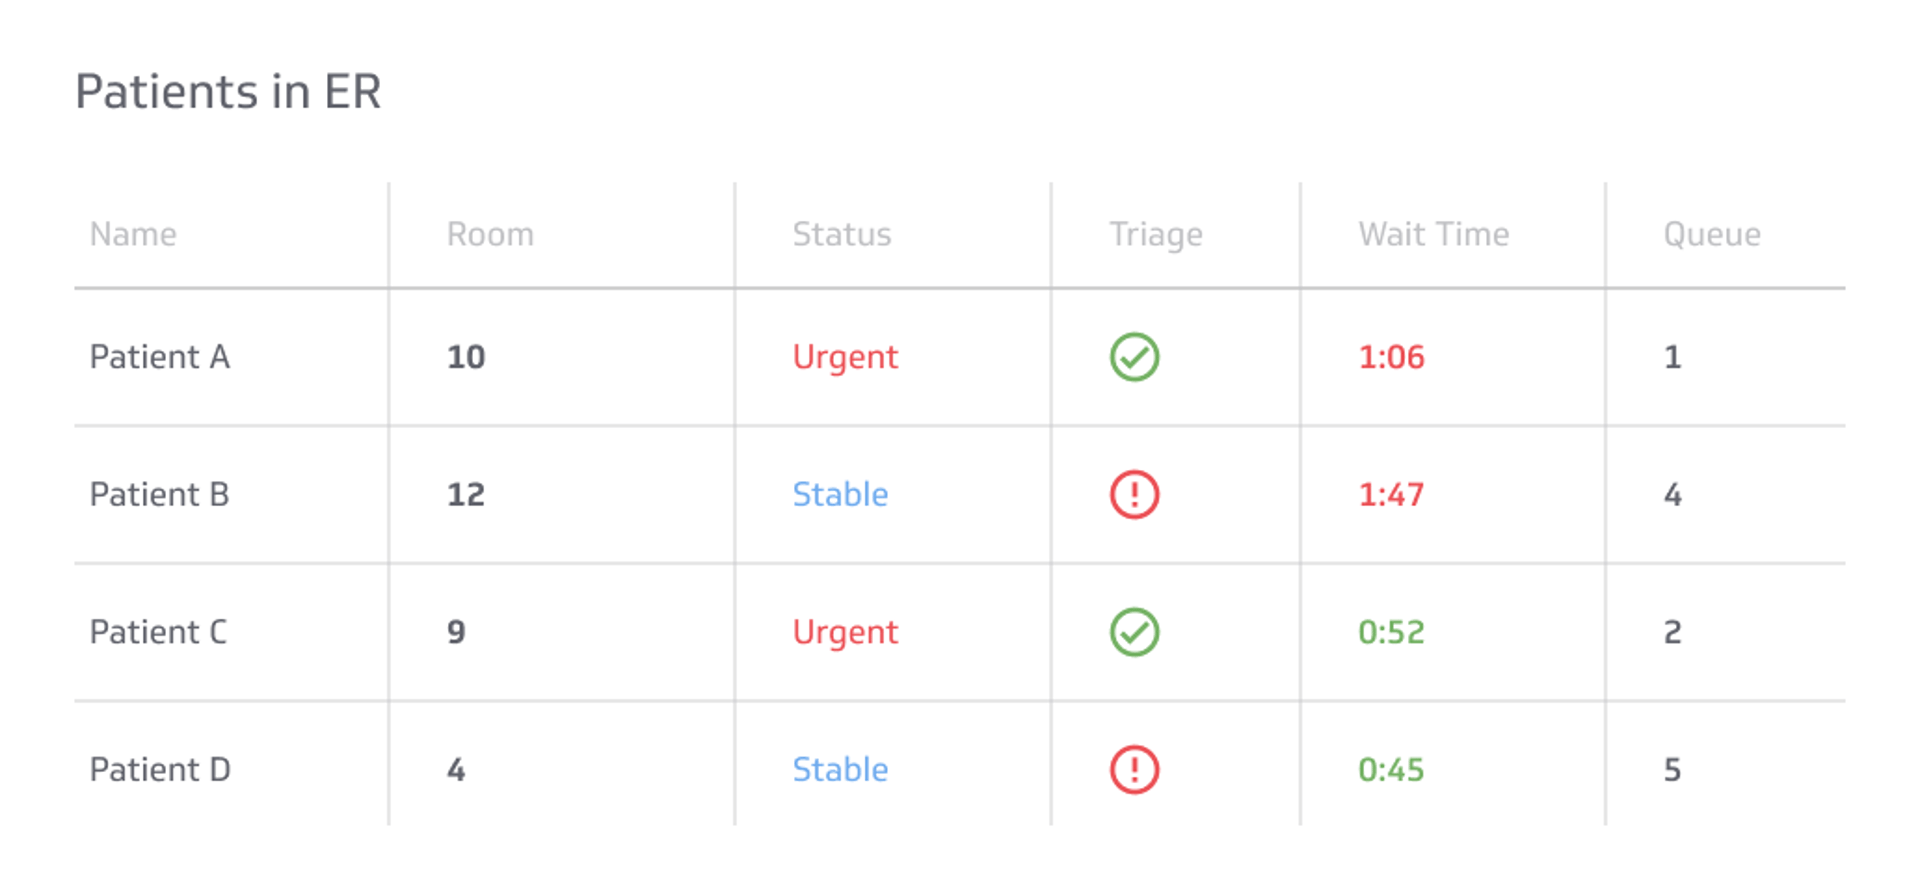
Number of Patients in ER Metric
Provides key data about patients in the ER such as room number, urgency of their case, current wait time, and if they've been attended to by a nurse.
Track all your Healthcare KPIs in one place
Sign up for free and start making decisions for your business with confidence.
Overview
The Number of Patients in the ER metric provides key data about patients in the ER, such as their room number, the urgency of their case, current wait time, and if they've been attended to by nurses. For an in-depth view of your current performance, these metrics, including information on all your patients, should be shared with all of your ER staff. This KPI is closely related to the Current ER Occupancy KPI.
Monitoring Healthcare KPIs on a Dashboard
Once you have established benchmarks and targets for Number of Patients in ER, you’ll want to establish processes for monitoring this and other healthcare KPIs. Dashboards can be critical in this regard. Read more
Why this KPI matters
Patient volume drives staffing needs, wait times, and safety risks. A clear live count helps charge nurses balance rooms, escalate bottlenecks, and communicate with inpatient units.
How to calculate and segment
- Current patients. Count registered patients who have not been discharged.
- By triage level. Segment volume by acuity to set priorities.
- By status. Waiting, in treatment, imaging, lab, ready for discharge, admitted boarding.
Data you need
- Registration and discharge timestamps
- Triage codes and assigned rooms
- Orders and results status for imaging and labs
Track ER volume in Klips
- Connect EHR feeds. Bring in HL7/FHIR feeds with appropriate permissions.
- Model statuses. Derive a single status per patient and compute counts by minute.
- Visualize. A single-value Klip for total patients, a bar by triage, and a queue view by status.
- Set thresholds. Colour rules flag levels above safe capacity.
- Share. Display on a dedicated screen at the charge desk; schedule shift-change emails.
Common pitfalls
- Stale data. Without near-real-time updates, staff cannot act quickly.
- Unclear ownership. Assign who updates room status and discharge events.
- No drill-through. Teams need a quick way to see patient details.
Related metrics
- Left Without Being Seen (LWBS)
- Door-to-doctor time
- Boarding time
Track this KPI in Klips. Build a live ER dashboard with strict access controls.
Related Metrics & KPIs