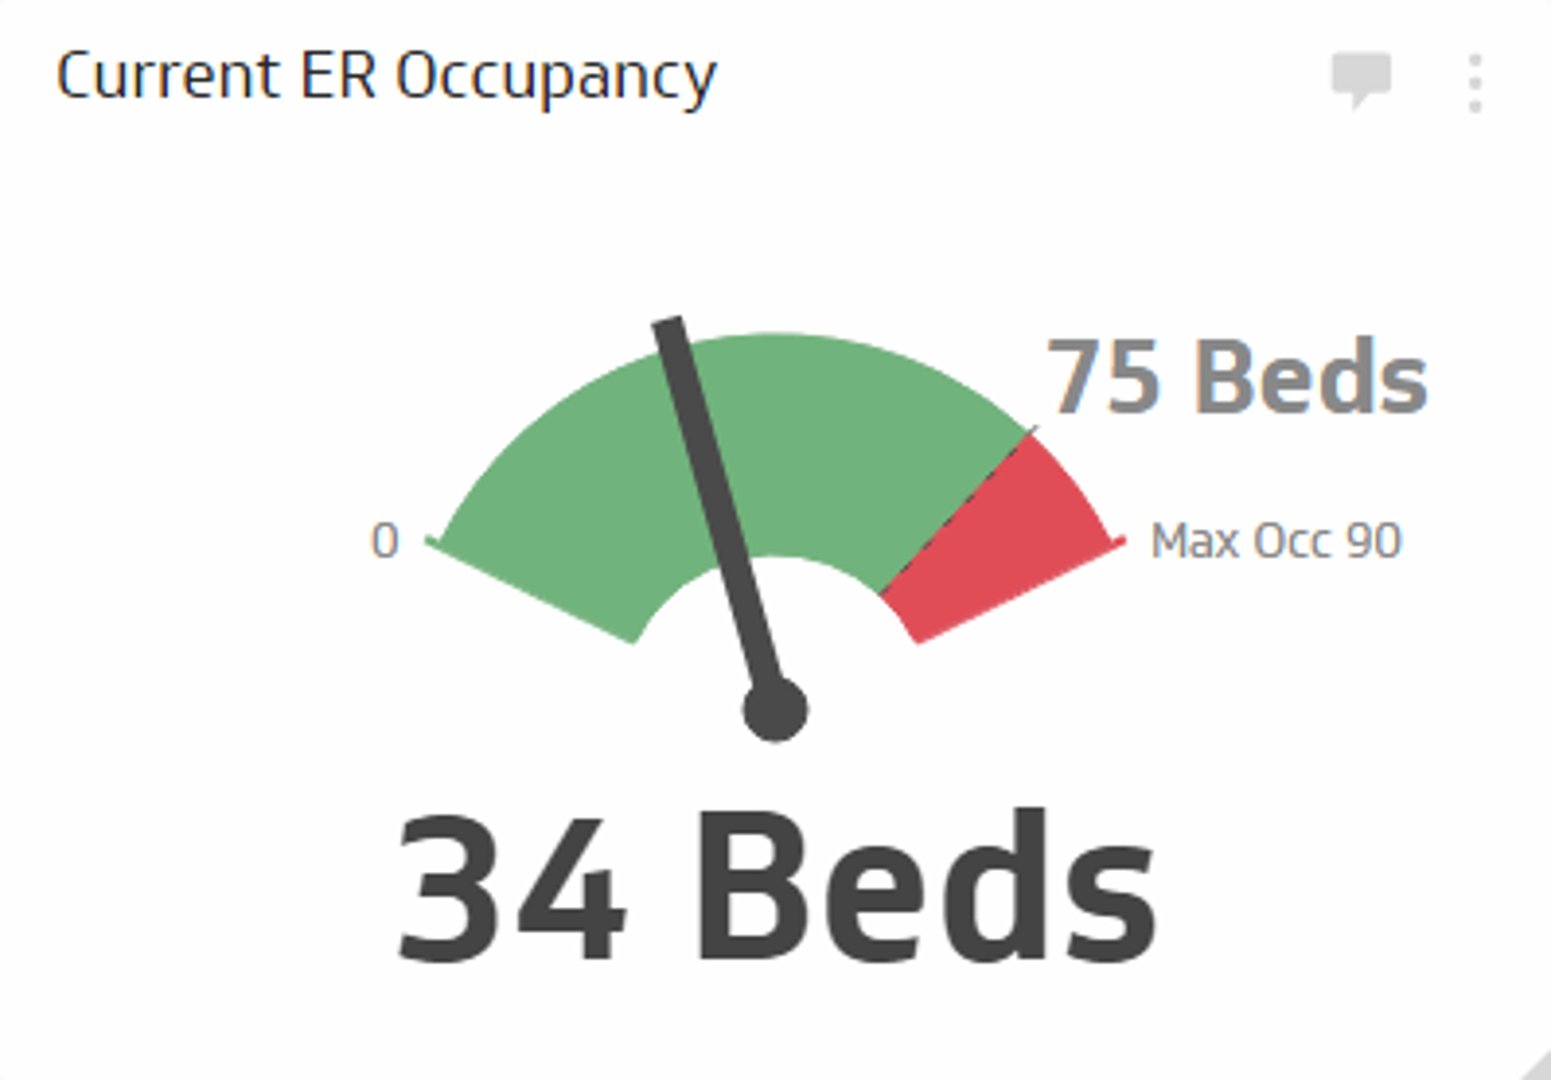
Current ER Occupancy Metric
Measures the percentage of beds currently occupied in your emergency department compared to total available beds.
Track all your Healthcare KPIs in one place
Sign up for free and start making decisions for your business with confidence.
Overview
The Current ER Occupancy KPI measures the percentage of beds currently occupied in your emergency department compared to total available beds. Real-time monitoring of this metric is essential—it keeps your staff informed of actual ER conditions and enables rapid response to capacity challenges. When occupancy approaches maximum capacity, you can proactively reroute patients to partner facilities, manage staff deployment, and maintain service quality during surge periods.
Why Current ER Occupancy Matters
Emergency departments operate under constant pressure. Patient arrivals are unpredictable, and bed availability directly affects your ability to deliver timely care. Tracking occupancy in real-time helps you:
- Anticipate bottlenecks: Identify when your ER is approaching full capacity before a crisis hits.
- Optimize staffing: Adjust nurse and physician schedules based on actual demand patterns.
- Improve patient outcomes: Reduce wait times and handoff delays by managing flow proactively.
- Support clinical decisions: Make informed choices about patient admission, discharge, or transfer.
- Plan for growth: Understand peak occupancy trends to guide facility expansion or resource allocation.
How to Calculate Current ER Occupancy
The formula is straightforward:
Current ER Occupancy (%) = (Currently Occupied Beds ÷ Total Available Beds) × 100
Example
If your ER has 50 total beds and 38 are currently occupied:
(38 ÷ 50) × 100 = 76% occupancy
This tells you that three-quarters of your capacity is in use. Many healthcare organizations set occupancy thresholds—for example, triggering a surge protocol when occupancy exceeds 85%.
Benchmarks and Targets
Current ER Occupancy benchmarks vary by facility type, geographic region, and patient population. However, industry standards suggest:
- 60–75% occupancy: Healthy operational range. Staff can manage patient flow without strain.
- 75–85% occupancy: Elevated activity. Monitor closely and prepare surge protocols.
- Above 85% occupancy: High stress. Consider activating overflow beds, diverting non-emergent patients, or calling in additional staff.
Your specific targets should reflect your facility's design capacity, staffing model, and community needs. Rural hospitals, urban trauma centres, and suburban urgent care facilities often operate at different optimal levels.
How to Monitor Current ER Occupancy
Once you've set benchmarks and targets, establish a consistent monitoring process. Many healthcare organizations use real-time dashboards to track occupancy alongside related metrics such as:
- Average length of stay (LOS)
- Bed turnover rate
- Left without being seen (LWBS) rate
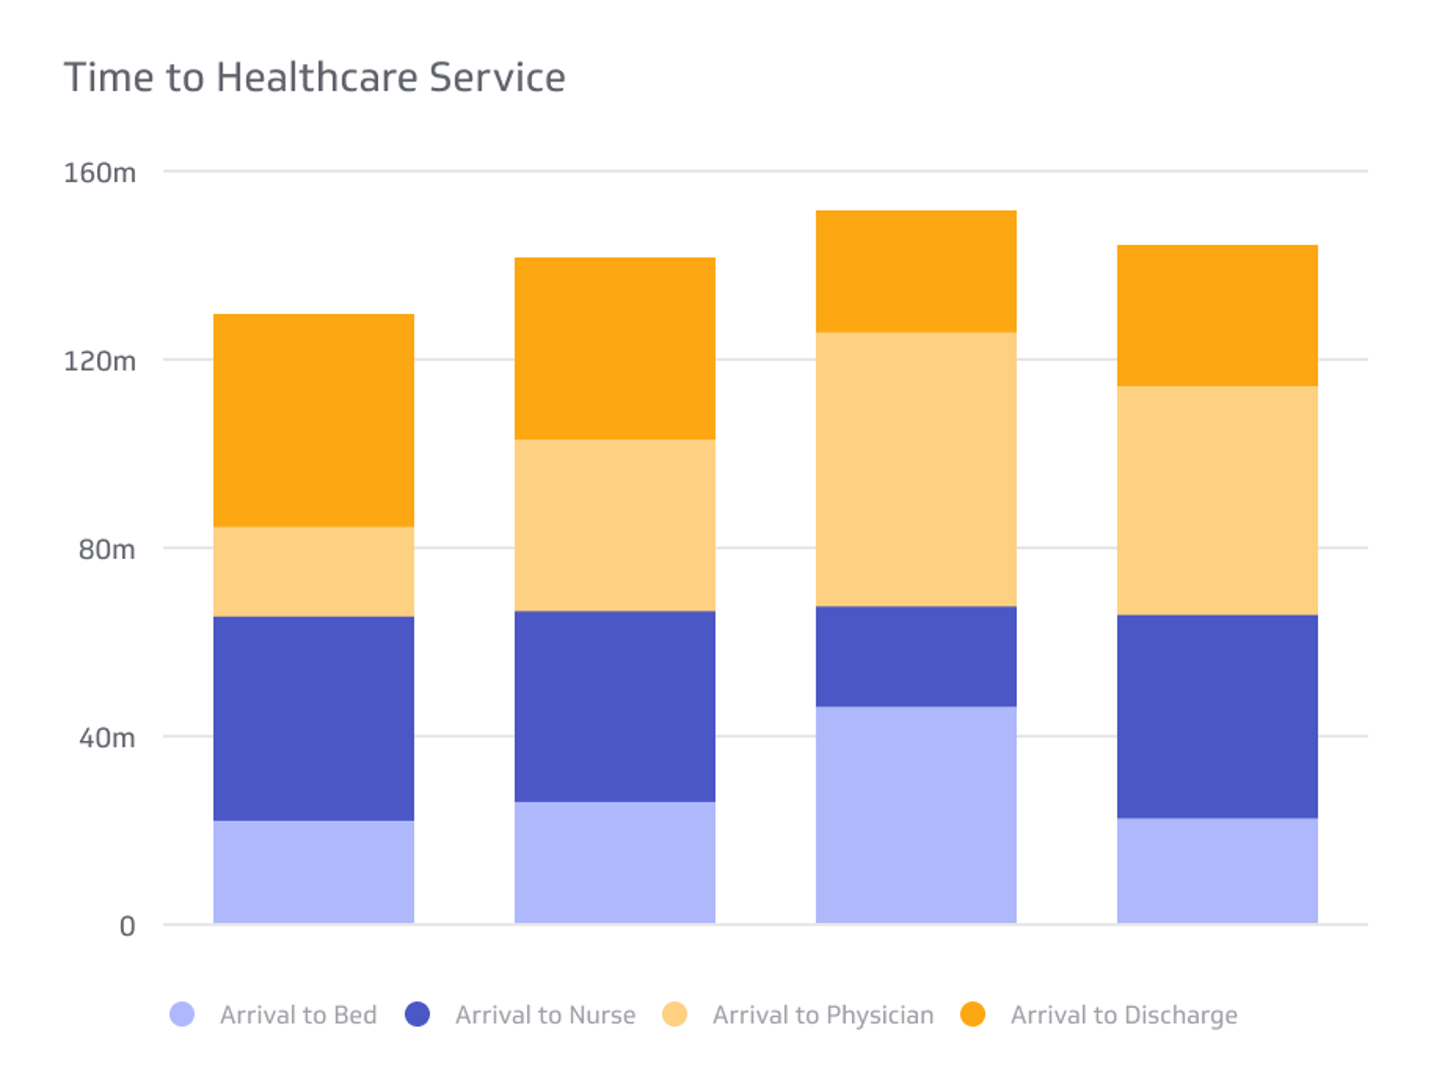
- Door-to-provider time
A centralized dashboard allows your team—from frontline staff to operations leadership—to see occupancy at a glance and respond quickly to changing conditions. Automated alerts can notify managers when occupancy crosses critical thresholds, enabling immediate action.
Related Healthcare KPIs
To build a complete picture of ER performance, pair Current ER Occupancy with these complementary metrics:
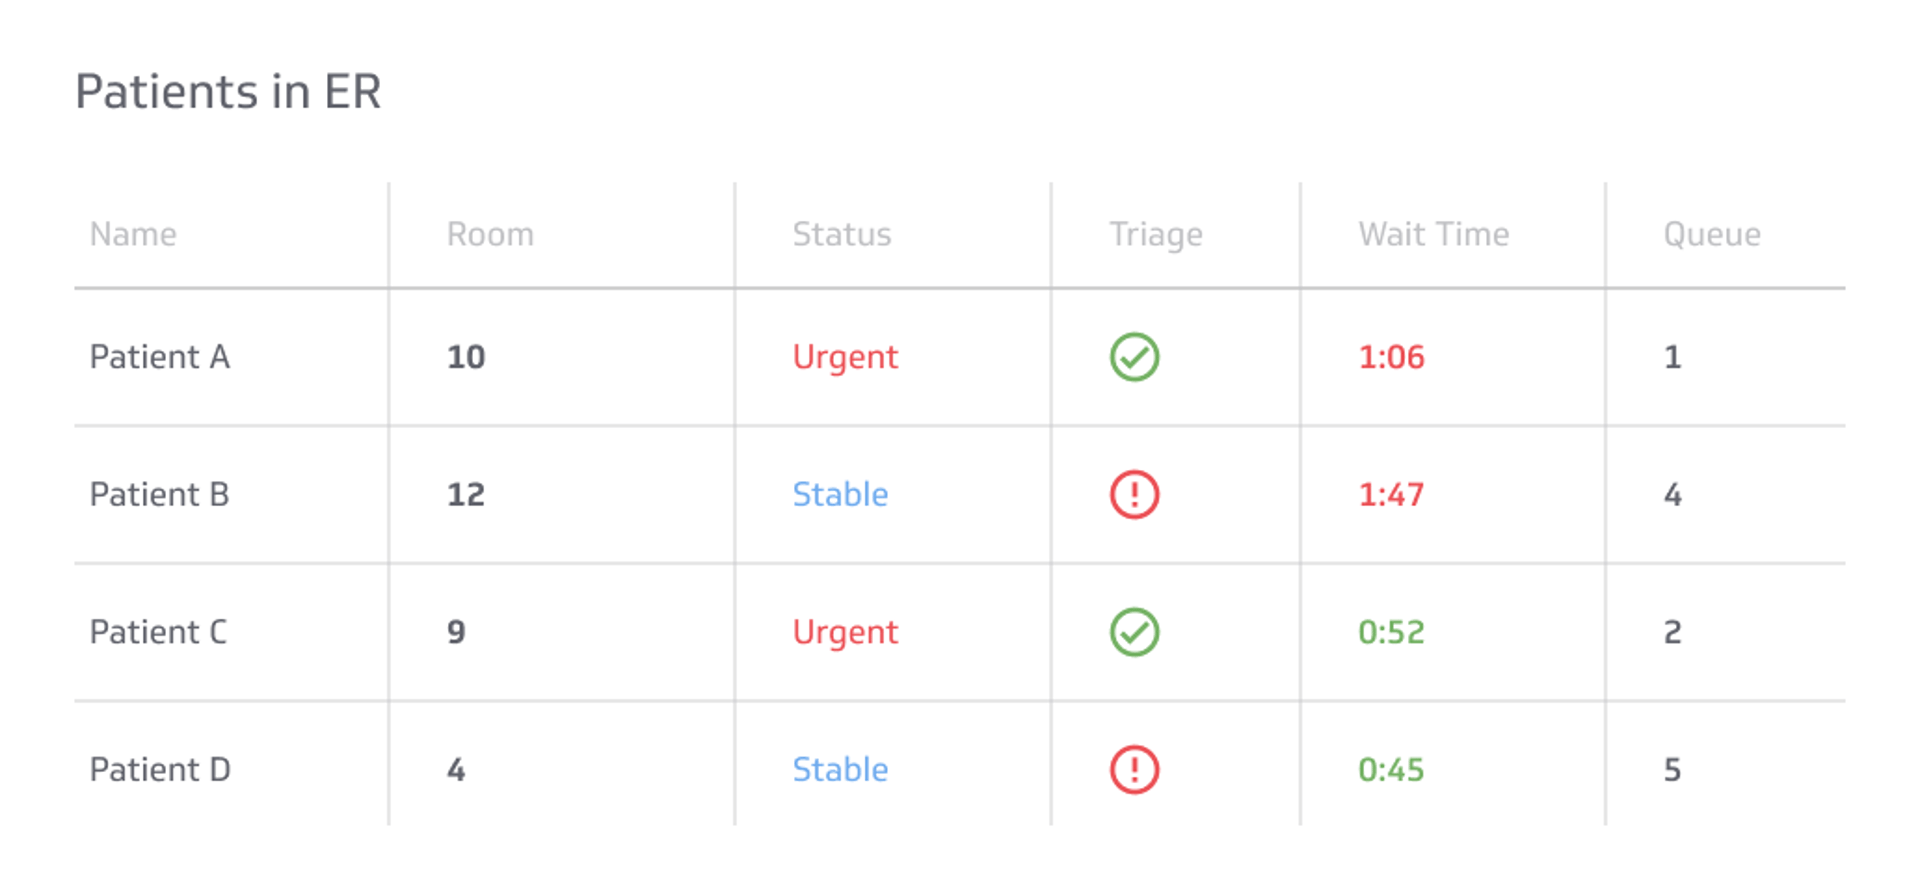
- ER Wait Time: How long patients wait from arrival to being seen.
- Average Length of Stay (LOS): How long patients remain in the ER before discharge or admission.
- Bed Turnover Rate: How quickly beds are cleaned and readied for the next patient.
- Left Without Being Seen (LWBS): Patients who leave before receiving care—often a sign of excessive wait times.
- ER Admission Rate: The percentage of ER patients admitted to inpatient beds.
Monitoring these metrics together gives you a more complete understanding of ER efficiency and patient flow.
Key Takeaway
Current ER Occupancy is a critical operational metric that directly influences your ability to deliver emergency care. By monitoring it in real-time, setting realistic benchmarks, and pairing it with related metrics, you empower your team to make smarter decisions about patient flow, staffing, and resource allocation. The result is better patient outcomes and a more resilient emergency department.
Related Metrics & KPIs